Báo cáo hóa học: " Research Article Analysis of Filter-Bank-Based Methods for Fast Serial Acquisition of BOC-Modulated Signals" potx
Bạn đang xem bản rút gọn của tài liệu. Xem và tải ngay bản đầy đủ của tài liệu tại đây (1.14 MB, 11 trang )
Hindawi Publishing Corporation
EURASIP Journal on Wireless Communications and Networking
Volume 2007, Article ID 25178, 11 pages
doi:10.1155/2007/25178
Research Article
Analysis of Filter-Bank-Based Methods for Fast Serial
Acquisition of BOC-Modulated Signals
Elena Simona Lohan
Institute of Communications Engineering, Tampere University of Technology, P.O. Box 553, 33101 Tampere, Finland
Received 29 September 2006; Accepted 27 July 2007
Recommended by Anton Donner
Binary-offset-carrier (BOC) signals, selected for Galileo and modernized GPS systems, pose significant challenges for the code ac-
quisition, due to the ambiguities (deep fades) which are present in the envelope of the correlation function (CF). This is different
from the BPSK-modulated CDMA signals, where the main correlation lobe spans over 2-chip interval, without any ambiguities or
deep fades. To deal with the ambiguities due to BOC modulation, one solution is to use lower steps of scanning the code phases
(i.e., lower than the traditional step of 0.5 chips used for BPSK-modulated CDMA signals). Lowering the time-bin steps entails
an increase in the number of timing hypotheses, and, thus, in the acquisition times. An alternative solution is to transform the
ambiguous CF into an “unambiguous” CF, via adequate filtering of the signal. A generalized class of frequency-based unambigu-
ous acquisition methods is proposed here, namely the filter-bank-based (FBB) approaches. The detailed theoretical analysis of
FBB methods is given for serial-search single-dwell acquisition in single path static channels and a comparison is made with other
ambiguous and unambiguous BOC acquisition methods existing in the literature.
Copyright © 2007 Elena Simona Lohan. This is an open access article distributed under the Creative Commons Attribution
License, which permits unrestricted use, distribution, and reproduction in any medium, provided the original work is properly
cited.
1. INTRODUCTION
The modulation selected for modernized GPS and Galileo
signals is BOC modulation, often denoted as BOC(m, n),
with m
= f
sc
/f
ref
, n = f
c
/f
ref
.Here, f
c
is the chip rate, f
sc
is the subcarrier rate, and f
ref
= 1.023 MHz is the reference
chip frequency (that of the C/A GPS signal) [1]. Alterna-
tively, a BOC-modulated signal can also be defined via its
BOC modulation order N
BOC
2 f
sc
/f
c
[2–4]. Both sine and
cosine BOC variants are possible (for a detailed description
of sine and cosine BOC properties, see [3, 4]). The acqui-
sition of BOC-modulated signals is challenged by the pres-
ence of several ambiguities in CF envelope (here, CF refers to
the correlation between the received signal and the reference
BOC-modulated code). That is, if the so-called ambiguous-
BOC (aBOC) approach [5–7] is used (meaning that there
is no bandlimiting filtering at the receiver or that this filter
has a bandwidth sufficiently high to capture most energy of
the incoming signal), the resultant CF envelope will exhibit
some deep fades within
±1 chip interval around the correct
peak [5, 8], as it will be illustrated in Section 4.Weremark
that sometimes the term “ambiguities” refers to the multi-
ple peaks within
±1 chip interval around the correct peak;
however, they are also related to the deep fades within this
interval. The terminology used here refers to the deep fades
of CF envelope.
The number of fades or ambiguities within 2-chip inter-
val depends on the N
BOC
order (e.g., for SinBOC, we have
2N
BOC
−2 ambiguities around the maximum peak, while for
CosBOC, we have 2N
BOC
ambiguities [4]). The distance be-
tween successive ambiguities in the CF envelope sets an up-
per bound on the step of searching the time-bin hypotheses
(Δt)
bin
, in the sense that if the time-bin step becomes too
high, the main lobe of the CF envelope might be lost during
the acquisition. Typically, a step of one-half the distance be-
tween the correlation peak and its first zero value, or, equiva-
lently, one quarter of the main lobe width is generally consid-
ered [9]. For example, acquisition time-bin steps of 0.5 chips
are used for BPSK modulation (such as for C/A code of GPS),
where the width of the main lobe is 2 chips, and steps of 0.1–
0.2 chips are used for SinBOC(1,1) modulation, where the
width of the main lobe is about 0.7 chips (such as for Galileo
Open Service) [5, 10, 11].
In order to be able to increase the time-bin step (and,
thus, the speed of the acquisition process), several Filter-
Bank-Based (FBB) methods are proposed here, which exploit
2 EURASIP Journal on Wireless Communications and Networking
Time uncertainty
Δt
max
.
.
.
.
.
.
···
···
···
(Δ f )
bin
Time-bin step (Δt)
bin
Frequency uncertainty Δ f
max
One time-frequency bin
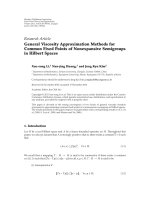
Figure 1: Illustration of the time/frequency search space.
the property that by reducing the signal bandwidth before
correlation, we are able to increase the width of the CF
main lobe. A thorough theoretical model is given for the
characterization of the decision variable in single-path static
channels and the theoretical model is validated via sim-
ulations. The proposed FBB methods are compared with
two other existing methods in the literature: the classical
ambiguous-BOC processing (above-mentioned) and a more
recent, unambiguous-BOC technique, introduced by Fish-
man and Betz [9] (denoted here via B&F method, but also
known as sideband correlation method or BPSK-like tech-
nique) and further analyzed and developed in [2, 6, 7, 10, 11].
It is mentioned that FBB methods have also been studied by
the author in the context of hybrid-search acquisition [12].
However, the theoretical analysis of FBB methods is newly
introduced here.
2. ACQUISITION PROBLEM AND AMBIGUOUS
(ABOC) ACQUISITION
In Global Navigation Satellite Systems (GNSS) based on code
division multiple access (CDMA), such as Galileo and GPS
systems, the signal acquisition is a search process [13]which
requires replication of both the code and the carrier of the
space vehicle (SV) to acquire the SV signal. The range di-
mension is associated with the replica code and the Doppler
dimension is associated with the replica carrier. Therefore,
the signal match is two dimensional. The combination of
one code range search increment (code bin) and one velocity
search increment (Doppler bin) is a cell.
The time-frequency search space is illustrated in Figure 1.
The uncertainty region represents the total number of cells
(orbins)tobesearched[13–15].Thecellsaretestedbycor-
relating the received and locally generated codes over a dwell
or integration time τ
d
. The whole uncertainty region in time
Δt
max
is equal to the code epoch length. The length of the fre-
quency uncertainty region Δ f
max
may vary according to the
initial information: if assisted-GPS data are available, Δ f
max
can be as small as couple of Hertzs or couple of tens of Hertzs.
If no Doppler-frequency information exists (i.e., no assis-
tance or autonomous GPS), the frequency range Δ f
max
can
beaslargeasfewtensofkHz[13].
The time-frequency bin defines the final time-frequency
error after the acquisition process and it is characterized by
one correlator output: the length of a bin in time direction
(or the time-bin step) is denoted by (Δt)
bin
(expressed in
chips) and the length of a bin in frequency direction is de-
noted by (Δ f )
bin
. For example, for GPS case, a typical value
for the (Δt)
bin
is 0.5 chips [13]. The search procedure can
be serial (if each bin is searched serially in the uncertainty
space), hybrid (if several bins are searched together), or fully
parallel (if one decision variable is formed for the whole un-
certainty space) [13]. This paper focuses on the serial search
approach.
One of the main features of Galileo system is the intro-
duction of longer codes than those used for most GPS sig-
nals. Also, the presence of BOC modulation creates some ad-
ditional peaks in the envelope of the correlation function, as
well as additional deep fades within
±1 chip from the main
peak. For this reason, a time-bin step of 0.5 chips is typically
not sufficient and smaller steps need to be used [5, 10, 11].
On the other hand, decreasing the time-bin step will increase
the mean acquisition time and the complexity of the receiver
[9].
In the serial search code acquisition process, one decision
variable is formed per each time-frequency bin (based on the
correlation between the received signal and a reference code),
and this decision variable is compared with a threshold in
order to decide whether the signal is present or absent. The
ambiguous-BOC (aBOC) processing means that, when form-
ing the decision variable, the received signal is directly corre-
lated with the reference BOC-modulated PRN sequence (all
the spectrum is used for both the received signal and refer-
ence code).
3. BENCHMARK UNAMBIGUOUS ACQUISITION:
B&F METHOD
The presence of BOC modulation in Galileo systems poses
supplementaryconstraintsoncodesearchstrategies,dueto
the ambiguities of the CF envelope. Therefore, better strate-
gies should be used to insure reasonable performance (acqui-
sition time and detection probabilities) as those obtained for
short codes. One of the proposed strategies to deal with the
ambiguities of BOC-modulated signals is the unambiguous
acquisition (known under several names, such as sideband
correlation method or BPSK-like technique).
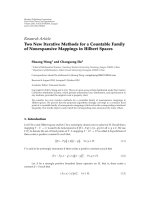
The original unambiguous acquisition technique, pro-
posed by Fishman and Betz in [9, 16], and later modified
in [6, 10], uses a frequency approach, shown in Figure 2.In
what follows, we denote this technique via B&F technique,
from the initials of the main authors. The block diagrams of
the B&F method (single-sideband processing) is illustrated
in Figure 2, for upper sideband- (USB-) processing [9, 16].
The same is valid for the lower sideband- (LSB-) processing.
The main lobe of one of the sidebands of the received sig-
nal (upper or lower) is selected via filtering and correlated
with a reference code, with tentative delay
τ and reference
Doppler frequency
f
D
. The reference code is obtained in a
ElenaSimonaLohan 3
Upper sideband processing
Lower sideband processing
Upper sideband
filter
Upper sideband
filter
Received BOC-modulated
signal
Reference BOC-modulated
PRN code
Coherent and non
coherent integration
Σ
To w a r d s
detection
stage
∗
0
0.2
0.4
0.6
0.8
1
Normalized PSD
−4 −3 −2 −10123 4
Frequecy (MHz)
SinBOC(1,1) spectrum
Figure 2: Block diagram of B&F method, single-sideband processing (here, upper sideband).
similar manner with the received signal, hence the autocor-
relation function is no longer the CF of a BOC-modulated
signal, but it will resemble the CF of a BPSK-modulated sig-
nal. However, the exact shape of the resulting CF is not iden-
tical with the CF of a BPSK-modulated signal, since some in-
formation is lost when filtering out the sidelobes adjacent to
the main lobe (this is exemplified in Section 4). This filtering
is needed in order to reduce the noise power. When the B&F
dual-sideband method is used, we add together the USB and
LSB outputs and form the dual-sideband statistic.
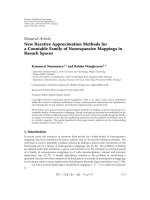
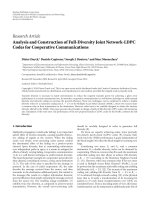
4. FILTER-BANK-BASED (FBB) METHODS
The underlying principle of the proposed FBB methods is
illustrated in Figure 3 and the block diagram is shown in
Figure 4. The number of filters in the filter bank is denoted
by N
fb
and it is related to the number of frequency pieces per
sideband N
pieces
via: N
fb
= 2N
pieces
if dual sideband (SB) is
used, or N
fb
= N
pieces
if single SB is used. In Figure 3, the
upper plot shows the spectrum of a SinBOC(1,1)-modulated
signal, together with several filters (here N
fb
= 4) which cover
the useful part of the signal spectrum (the useful part is con-
sidered here to be everything between the main spectral lobes
of the signal, including these main lobes). Alternatively, we
may select only the upper (or lower) SB of the signal (i.e.,
single-SB processing).
The filters may have equal or unequal frequency widths.
Two methods may be employed and they have been denoted
here via equal-power FBB (FBB
ep
), where each filter lets the
same signal’s spectral energy to be passed, thus they have un-
equal frequency widths (see upper plot of Figure 3), or equal-
frequency-width FBB (FBB
efw
), where all the filters in the fil-
ter bank have the same bandwidth (but the signal power is
different from one band to another). An observation ought
to be made here with respect to these denominations: indeed,
before the correlation takes place and after filtering the in-
coming signal (via the filter bank), the noise power density
is exactly in reverse situation compared to the signal power,
since the noise power depends on the filter bandwidth (i.e.,
the noise power is constant from one band to another for
the FBB
efw
case, and it is variable for the FBB
ep
case). How-
ever, the incoming (filtered) signal is correlated with the ref-
erence BOC-modulated code. Thus, the noise, which may
be assumed white before the correlation, becomes coloured
noise after the correlation with BOC signal, and its spectrum
(after the correlation) takes the shape of the BOC power
spectral density. Therefore, after the correlation stage at the
receiver (e.g., immediately before the coherent integration
block), both signal power density and noise power density
are shaped by the BOC spectrum. Thus, the denominations
used here (FBB
ep
and FBB
efw
) are suited for both signal and
noise parts, as long as the focus is on the processing after the
correlation stage (as it is the case in the acquisition).
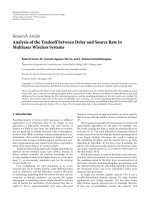
As seen in Figure 4, the same filter bank is applied to
both the signal and the reference BOC-modulated pseudo-
random code. Then, filtered pieces of the signal are corre-
lated with filtered pieces of the code (as shown in Figure 4)
and an example of the resultant CF is plotted in the lower
part of Figure 3. For reference purpose, also aBOC and B&F
cases are shown. It is noticed that, when N
pieces
= 1, the pro-
posed FBB methods (both FBB
ep
and FBB
efw
) become identi-
cal with B&F method, and the higher the N
pieces
is, the wider
the main lobe of the CF envelope becomes, at the expense of
a higher decrease in the signal power.
The block diagram in Figure 4 applies not only to FBB
methods, but also to other GPS/Galileo acquisition meth-
ods, such as single/dual SB, and ambiguous-/unambiguous-
BOC acquisition methods (i.e., aBOC corresponds to the
case when no filtering stage is applied to the received and
reference signals, while B&F corresponds to the case when
N
pieces
= 1). The complex outputs y
i
(·), i = 1, , N
fb
of the
coherent integration block of Figure 4 can be written as
y
i
τ,
f
D
, n
=
1
T
coh
nT+T
coh
nT
r
i
(t)c
i
(t − τ)e
j2π
f
D
t
dt,(1)
4 EURASIP Journal on Wireless Communications and Networking
−3 −2 −10 1 2 3
Frequency (MHz)
0
0.1
0.2
0.3
0.4
0.5
0.6
0.7
Spectrum
Dual sideband processing, equal-power pieces
BOC PSD
Filter 1
Filter 2
Filter 3
Filter 4
(a)
−3 −2 −10 1 2 3
Delay error (chips)
0
0.5
1
1.5
2
2.5
3
3.5
|CF|
2
Squared CF envelope, N
pieces
= 2, N
BOC
= 2
BOC
B&F, dual SB
FBB
ep
,dualSB
FBB
efw
,dualSB
(b)
Figure 3: Illustration of the FBB acquisition methods, SinBOC(1,1)
case. Upper plot: division into frequency pieces, via N
fb
= 4filters
(FBB
ep
method). Lower plot: squared CF shapes for 2 FBB meth-
ods, compared with ambiguous BOC (aBOC) and unambiguous
Betz&Fishman (B&F) methods.
where n is the symbol (or code epoch) index, T is the symbol
interval,
r
i
(t) is the filtered signal via the ith filter, c
i
(t) is the
filtered reference code (note that the code c(t) before the filter
bank is the BOC-modulated spread spectrum sequence),
τ
and
f
D
are the receiver candidates for the delay and Doppler
shift, respectively, and T
coh
is the coherent integration length
(if the code epoch length is 1 millisecond, then the number of
coherent code epochs N
c
may be used instead: T
coh
= N
c
ms).
Without loss of generality, we may assume that a pilot chan-
nel is available (such as it is the case of Galileo L1 band), thus
the received signal r(t)(beforefiltering)hastheform
r(t)
=
E
b
c(t − τ)e
−j2πf
D
t
+ η
wb
(t), (2)
where τ and f
D
are the delay and Doppler shift introduced
by the channel, η
wb
(t) is the additive white Gaussian noise at
wideband level, and E
b
is the bit energy.
The coherent integration outputs y
i
(·) are Gaussian pro-
cesses (since a filtered Gaussian processes is still a Gaussian
processes). Their mean is either 0 (if we are in an incorrect
time-frequency bin) or it is proportional to a time-Doppler
deterioration factor
E
b
F (Δτ, Δ
f
D
)[11], with a proportion-
ality constant dependent on the number of filters and of the
acquisition algorithm, as it will be shown in Section 5.Here,
F (
·) is the amplitude deterioration in the correct bin due
to a residual time error Δ
τ and a residual Doppler error Δ
f
D
[11]
F
Δτ, Δ
f
D
=
R
Δτ
sin
πΔ
f
D
T
coh
πΔ
f
D
T
coh
. (3)
As mentioned above, Δ
τ = τ −τ, Δ
f
D
= f
D
−
f
D
,andR(Δτ)
is the CF value at delay error Δ
τ (CF is dependent on the used
algorithm, as shown in the lower plot of Figure 3). Moreover,
if we normalize the y
i
(·) variables with respect to their max-
imum power, the variance of y
i
(·) variables (in both the cor-
rect and incorrect bins) is proportional to the postintegration
noise variance
σ
2
10
−(CNR+10log
10
T
coh
)/10
,(4)
where CNR
= E
b
B
W
/N
0
is the Carrier-to-Noise Ratio, ex-
pressed in dB-Hz [5, 7, 11], B
W
is the signal bandwidth after
despreading (e.g., B
W
= 1 kHz for GPS and Galileo signals),
and N
0
is the double-sided noise spectral power density in
the narrowband domain (after despreading or correlation on
1 millisecond in GPS/Galileo). The proportionality constants
are presented in Section 5. The decision statistic Z of Figure 4
is the output of noncoherent combining of N
nc
N
fb
complex
Gaussian variables, where N
nc
is the noncoherent integration
time (expressed in blocks of N
c
ms):
Z
=
1
N
nc
1
N
fb
N
nc
n=1
N
fb
i=1
y
i
τ,
f
D
, n
2
. (5)
We remark that the coloured noise impact on Z statistic is
similar with the impact of a white noise; the only difference
will be in the moments of Z, as discussed in Section 5.1 (since
a filtered Gaussian variable is still a Gaussian variable, but
with different mean and variance, according to the used fil-
ter). Thus, if those Gaussian variables have equal variances,
Z is a chi-square distributed variable [17, 18], whose num-
ber of degrees of freedom depends on the method and the
number of filters used. Next section presents the parameters
of the distribution of Z for each of the analyzed methods.
ElenaSimonaLohan 5
c(t)
Ref code
r(t)
Rx sign.
N
fb
filters
FB
N
fb
filters
FB
Optional stage
.
.
.
c
N
fb
(t)
c
1
(t)
.
.
.
r
N
fb
(t)
r
1
(t)
∗
∗
y
N
fb
y
1
Coherent
integr.
Coherent
integr.
.
.
.
||
2
||
2
.
.
.
N
nc
N
nc
.
.
.
N
fb
Z
Figure 4: Block diagram of a generic acquisition block.
5. THEORETICAL MODEL FOR FBB
ACQUISITION METHODS
5.1. Test statistic distribution
As explained above, the test statistic Z for aBOC, B&F, and
proposed FBB
ep
approaches
1
is either a central or a noncen-
tral χ
2
-distributed variable with N
deg
degrees of freedom, ac-
cording to whether we have an incorrect (bin H
0
)ora
correct (bin H
1
) time-frequency bin, respectively. Its non-
centrality parameter λ
Z
and its variance σ
2
Z
are thus given by
λ
Z
= ξ
λ
bin
F
Δτ, Δ
f
D
,
σ
2
Z
= ξ
σ
2
bin
σ
2
N
nc
,
(6)
where F (
·)isgivenin(3), σ
2
isgivenin(4), and ξ
σ
2
bin
and
ξ
λ
bin
are two algorithm-dependent factors shown in Tab le 1
(they also depend on whether we are in a correct bin or in an
incorrect bin). We remark that the noncentrality parameter
used here is the square-root of the noncentrality parameter
defined in [17], such that it corresponds to amplitude lev-
els (and not to power levels). The relationship between the
distribution functions and their noncentrality parameter and
variance will be given in (8).
All the parameters in Ta bl e 1 have been derived by in-
tuitive reasoning (explained below), followed by a thorough
verification of the theoretical formulas via simulations. For
clarity reasons, we assumed that the bit energy is normalized
to E
b
= 1 and all the signal and noise statistics are present
with respect to this normalization.
Clearly, for aBOC algorithm, ξ
σ
2
bin
= 1 and the noncen-
trality factor ξ
λ
bin
is either 1 (in a correct bin) or 0 (in an in-
correct bin) [5, 7, 19]. Also, N
deg
= 2N
nc
for aBOC, because
we add together the absolute-squared valued of N
nc
complex
variables (or the squares 2N
nc
real variables, coming from
real and imaginary parts of the correlator outputs). For B&F,
the noncentrality deterioration factor and the variance dete-
rioration factor depend on the normalized power per main
lobe (positive or negative) P
ml
of the BOC power spectral
1
The case of FBB
efw
is discussed separately, later in this section.
density (PSD) function. P
ml
canbeeasycomputedanalyti-
cally, using, for example, the formulas for PSD given in [3, 4]
andsomeillustrativeexamplesareshowninFigure 5; the
normalization is done with respect to the total signal power,
thus P
ml
< 0.5.; P
ml
factor is normalized with respect to the
total signal power, thus P
ml
< 0.5(e.g.,P
ml
= 0.428 for Sin-
BOC(1,1)). The decrease in the signal and noise power after
the correlation in B&F method (and thus, the decrease in ξ
λ
H
1
and ξ
σ
2
bin
parameters) is due to the fact that both the signal
and the reference code are filtered and the filter bandwidth is
adjusted to the width of the PSD main lobe. Also, in dual-
SB approaches, the signal power is twice the signal power
for single SB, therefore, the noncentrality parameter (which
is a measure of the amplitude, not of the signal power) in-
creases by
√
2. Furthermore, in dual-SB approaches, we add
a double number of noncoherent variables, thus the num-
ber of degrees of freedom is doubled compared to single-SB
approaches.
The derivation of χ
2
parameters for FBB
ep
is also straight-
forward by keeping in mind that the variance of the vari-
ables y
i
is constant for each frequency piece (the filters were
designed in such a way to let equal power to be passed
through them). Thus, the noise power decrease factor is
ξ
σ
2
bin
= P
ml
/N
pieces
,bin= H
0
, H
1
, and the signal power de-
creases to N
pieces
(P
2
ml
/N
2
pieces
), thus x
λ
bin
= P
ml
/
N
pieces
for
single SB (and x
λ
bin
=
√
2P
ml
/
N
pieces
for dual SB).
For FBB
efw
, the reasoning is not so straightforward (be-
cause the sum of squares of Gaussian variables of different
variancesisnolongerχ
2
distributed) and the bounds given
in Ta bl e 1 were obtained via simulations. It was noticed (via
simulations) that the noise variance in the correct and in-
correct bins is no longer the same. It was also noticed that
the distribution of FBB
efw
test statistic is bounded by two χ
2
distributions. Moreover, P
max
pp
is the maximum power per
piece (in the positive or in the negative frequency band). For
example, if N
pieces
= 2andFBB
efw
approach is used for Sin-
BOC(1,1) case, the powers per piece of the positive-sideband
lobe are 0.10 and 0.34, respectively (hence, P
max
pp
= 0.34).
Again, these powers can be derived straightforwardly, via the
formulas shown in [1, 3, 4, 20].
Figure 6 compares the simulation-based complementary
CDF (i.e., 1-CDF) with theoretical complementary CDFs
for FBB
ep
case (similar plots were obtained for aBOC,
B&F, and FBB
efw
but they are not included here due to
6 EURASIP Journal on Wireless Communications and Networking
Table 1: χ
2
parameters for the distribution of the decision variable Z, various acquisition methods.
Correct bin (hypothesis H
1
) Incorrect bin (hypothesis H
0
)
ξ
λ
H
1
ξ
σ
2
H
1
N
deg
ξ
λ
H
0
ξ
σ
2
H
0
N
deg
aBOC
112N
nc
01 2N
nc
Single-sideband
B& F
P
ml
P
ml
2N
nc
0 P
ml
2N
nc
Dual-sideband
B&F
√
2P
ml
P
ml
4N
nc
0 P
ml
4N
nc
Single-sideband
FBB
ep
and lower
bound of single-
sideband FBB
efw
P
ml
N
pieces
P
ml
N
pieces
2N
nc
N
pieces
0
P
ml
N
pieces
2N
nc
N
pieces
Dual-sideband
FBB
ep
and lower
bound of dual-
sideband FBB
efw
√
2
P
ml
N
pieces
P
ml
N
pieces
4N
nc
N
pieces
0
P
ml
N
pieces
4N
nc
N
pieces
Upper bound of
single-sideband
FBB
efw
P
ml
N
pieces
P
max
pp
N
pieces
2N
nc
N
pieces
0
P
ml
N
pieces
2N
nc
N
pieces
Upper bound of
dual-sideband
FBB
efw
√
2
P
ml
N
pieces
P
max
pp
N
pieces
4N
nc
N
pieces
0
P
ml
N
pieces
4N
nc
N
pieces
lack of space). For the simulations shown in Figure 6,
SinBOC(1,1) signal was used, with coherent integration
length N
c
= 20 milliseconds, noncoherent integration length
N
nc
= 2, CNR = 24 dB-Hz, number of samples per BOC
interval N
s
= 4, and single-SB filter bank with 4 fil-
ters (i.e., N
fb
= N
pieces
= 4). It was also noticed that
the bounds for FBB
efw
approach are rather loose. How-
ever, simulation results showed that the average behavior
of FBB
efw
, while keeping between the bounds, is also very
similar with the average behavior of FBB
ep
[12], therefore,
from now on, it is possible to rely on FBB
ep
curves alone
in order to illustrate the average performance of proposed
FBB methods. We remark that the plots of complementary
CDF were chosen instead of CDF, in order to show bet-
ter the tail matching of the theoretical and simulation-based
distributions.
5.2. Detection probability and
mean acquisition times
In serial search acquisition, the detection probability per
bin P
d
bin
(Δτ) is the probability that the decision variable Z
is higher than the decision threshold γ, provided that we
are in a correct bin (hypothesis H
1
). Similarly, the false
alarm probability P
fa
is the probability that the decision vari-
able is higher than γ, provided that we are in an incor-
rect bin (hypothesis H
0
). These probabilities can be easily
computed based on the cumulative distribution functions
(CDFs) of Z in the correct F
nc
(·) and incorrect bins F
c
(·)
[11]:
P
d
bin
Δτ, Δ
f
D
=
1 −F
nc
(γ,λ
Z
),
P
fa
= 1 −F
c
(γ),
(7)
2 3 4 5 6 7 8 9 10 11 12
BOC modulation order N
BOC
0.36
0.37
0.38
0.39
0.4
0.41
0.42
0.43
Power per main (positive or negative) lobe P
ml
Power per main lobe of BOC-modulated signal
Sine BOC
Cosine BOC
Figure 5: Normalized power per main lobe P
ml
for BOC-modulated
signals for various N
BOC
orders.
where F
nc
(·) is the CDF of a noncentral χ
2
variable and
F
c
(·) is the CDF of a central χ
2
variable, given by [17]:
F
c
(z) = 1 −
N
deg
/2−1
k=0
e
−z/σ
2
Z
z
σ
2
Z
k
1
k!
in incorrect bins H
0
F
nc
z, λ
Z
=
1 −Q
N
deg
/2
λ
Z
√
2
σ
Z
,
√
2z
σ
Z
in correct bins H
1
(8)
ElenaSimonaLohan 7
00.05 0.10.15 0.20.25 0.30.35 0.4
Test statistic levels
0
0.1
0.2
0.3
0.4
0.5
0.6
0.7
0.8
0.9
1
1-CDF
Matching to χ
2
complementary CDF for SSB, FBB
Sim, non-central
Th, non-central
Sim, central
Th, central
Figure 6: Matching with χ
2
distributions, (complementary CDF:
1-CDF), theory (th) versus simulations (sim), FBB
ep
, N
fb
=
N
pieces
= 4.
with σ
2
Z
, N
deg
,andλ
Z
given in (6) and in Ta bl e 1 ,and
Q
N
deg
/2
(·) being the generalized Marcum-Q function [17].
Due to the fact that the time-bin step may be smaller than
the 2-chip interval of the CF main lobe, we might have
several correct bins. The number of correct bins is: N
t
=
2T
c
/(Δt)
bin
,whereT
c
is the chip interval. Thus, the global
detection probability P
d
is the sum of probabilities of detect-
ing the signal in the ith bin, provided that all the previous
tested hypotheses for the prior correct bins gave a misdetec-
tion [11]:
P
d
Δτ
0
=
N
t
−1
k=0
P
d
bin
Δτ
0
+ k(Δt)
bin
, Δ
f
D
k−1
i=0
1 −P
d
bin
Δτ
0
+ i(Δt)
bin
, Δ
f
D
.
(9)
In (9), Δτ
0
is the delay error associated with the first sam-
pling point in the two-chip interval, where we have N
t
cor-
rect bins. Equation (9) is valid only for fixed sampling points.
However, due to the random nature of the channels, the sam-
pling point (with respect to the channel delay) is randomly
fluctuating, hence, the global P
d
is computed as the expecta-
tion E(
·) over all possible initial delay errors (under uniform
distribution, we simply take the temporal mean):
P
d
= E
Δτ
0
P
d
Δτ
0
,
(10)
and the worst detection probability is obtained for the worst
sequence of sampling points: P
d,worst
= min
Δτ
0
(P
d
(Δτ
0
)).
The mean acquisition time
T
acq
for the serial search is
computed according to the global P
d
, the false alarm P
fa
, the
penalty time K
penalty
(i.e., the time lost to restart the acqui-
sition process if a false alarm state is reached), and the total
number of bins in the search space [21]:
T
acq
=
2+
2 −P
d
(q − 1)
1+K
penalty
P
fa
2P
d
τ
d
, (11)
where τ
d
= N
nc
T
coh
is the dwell time, q is the total num-
ber of bins in the search space, and P
d
and P
fa
are given by
(7)to(10). An example of the theoretical average detection
probability P
d
compared with the simulation results is shown
in Figure 7, where a very good match is observed. The small
mismatch at high (Δt)
bin
for the dual B&F method can be ex-
plained by the number of points used in the statistics: about
5000 random points have been used to build such statistics,
which seemed enough for most of (Δt)
bin
ranges. However, at
very low detection probabilities, this number is still too small
for a perfect match. However, the gap is not significant, and
low P
d
regions are not the most interesting from the analysis
point of view.
An example of performance (in terms of average and
worst detection probabilities) of the proposed FBB methods
is given in Figure 8. The gap between proposed FBB methods
and aBOC method is even higher from the point of view of
the worst P
d
. Here, SinBOC(1,1)-modulated signal was used,
and N
c
= 20 ms, N
nc
= 2. The other parameters are specified
in the figures captions. The small edge in aBOC average per-
formance at around 0.7 chips is explained by the fact that a
time-bin step equal to the width of the main lobe of CF en-
velope (i.e., about 0.7 chips) would give worse performance
than a slightly higher or smaller steps, due to ambiguities in
the CF envelope. Also, the relatively constant slope in the re-
gion of 0.7–1 chips can be explained by the combination of
high time-bin steps and the presence of the deep fades in the
CF: since the spacing between those deep fades is around 0.7
chips for SinBOC(1,1), then a time-bin step of 0.7 chips is the
worst possible choice in the interval up to 1 chip. However,
there is no significant difference in average P
d
for time-bin
steps between 0.7 and 1 chip, since two counter-effects are
superposed (and they seem to cancel each other in the region
of 0.7 till 1 chip from the point of view of average P
d
): on
one hand, increasing the time-bin step is deteriorating the
performance; on the other hand, avoiding (as much as possi-
ble) the deep fades of CF is beneficial. This fact is even more
visible from the lower plot of Figure 8, where worst-case P
d
are shown. Clearly, having a time-bin step of about 0.7 chips
would mean that, in the worst case, we are always in a deep
fade and lose completely the peak of the main lobe. This ex-
plains the minimum P
d
achieved at such a step. Also, for steps
higher than 1.5 chips, there is always a sampling sequence
that will miss completely the main lobe of the envelope of CF
(thus, the worst P
d
will be zero).
It is noticed that FBB methods can work with time-bin
steps higher than 1 chip, due to the increase in the main lobe
of the CF envelope. Moreover, the proposed FBB methods
(both single and dual SB) outperform the B&F and aBOC
method if the step (Δt)
bin
is sufficiently high. Indeed, the
higher the time-bin step, the higher is the improvement of
FBB methods over aBOC and B&F methods. We remark that
even at (Δt)
bin
= 1 chip, we have a significantly high P
d
,
8 EURASIP Journal on Wireless Communications and Networking
00.20.40.60.811.21.41.61.82
(Δt)
bin
(chips)
10
−3
10
−2
10
−1
10
0
P
d
P
d
at P
fa
= 0.001, dual B&F, CNR = 27 dB-Hz
Sim, average
Th, average
Sim, worst
Th, worst
(a)
00.20.40.60.811.21.41.61.82
(Δt)
bin
(chips)
10
−2
10
−1
10
0
P
d
P
d
at P
fa
= 0.001, dual FBB
ep
,CNR= 27 dB-Hz, N
pieces
= 2
Sim, average
Th, average
Sim, worst
Th, worst
(b)
Figure 7: Comparison between theory and simulations for Sin-
BOC(1,1). Left: dual-sideband B&F method. Right: Dual-sideband
FBB
ep
method, N
pieces
= 2. N
c
= 10 milliseconds, N
nc
= 5, CNR =
27 dB-Hz, N
s
= 5.
due to the widening of the CF main lobe. The constant P
d
at higher time-bin steps is explained by the fact that, if the
step increases with respect to the correlation function width,
only noise is captured in the acquisition block. Thus, increas-
ing the step above a certain threshold would not change the
serial detection probability, since the decision variable will
only contains noise samples.
On the other hand, by increasing the time-bin step in
the acquisition process, we may decrease substantially the
mean acquisition time, because the number of bins in the
00.511.522.53
Time-bin step (Δt)
bin
0.2
0.3
0.4
0.5
0.6
0.7
0.8
0.9
1
P
d
Average P
d
, N
pieces
= 2, CNR = 30 dB-Hz
aBOC
Single B&F
Dual B&F
Single FBB
Dual FBB
(a)
00.51 1.522.53
Time-bin step (Δt)
bin
0
0.1
0.2
0.3
0.4
0.5
0.6
0.7
0.8
0.9
1
P
d
P
d,worst
, N
pieces
= 2, CNR = 30 dB-Hz
aBOC
Single B&F
Dual B&F
Single FBB
Dual FBB
(b)
Figure 8: Average (upper) and worst (lower) detection probabili-
ties versus (Δt)
bin
ambiguous and unambiguous BOC acquisition
methods (FBB
ep
was used here).
search space (see (11) is directly proportional to (Δt)
bin
.For
example, if the code epoch length is 1023 chips and only
one frequency bin is searched (assisted acquisition), q
=
1023/(Δt)
bin
. Moreover, the computational load required
for implementing a correlator acquisition receiver per unit of
time uncertainty is inversely proportional to (Δt)
2
bin
[9], thus,
when (Δt)
bin
increases, the computational load decreases.
An example regarding the needed time-bin step in or-
der to achieve a certain detection probability, at fixed CNR
and false alarm probability, is shown in what follows. We
ElenaSimonaLohan 9
25 26 27 28 29 30 31
CNR (dB-Hz)
0
0.5
1
1.5
2
(Δt)
bin
(chips)
Step needed to achieve a target P
d
= 0.9, (average case)
Dual SB, FBB
ep
Dual SB, B&F
(a)
25 26 27 28 29 30 31
CNR (dB-Hz)
0
0.5
1
1.5
(Δt)
bin
(chips)
Step needed to achieve a target P
d
= 0.9, (average case)
Single SB, FBB
ep
Single SB, B&F
(b)
25 26 27 28 29 30 31
CNR (dB-Hz)
10
1
10
2
10
3
MAT
Achieved MAT [s] at considered step
Dual SB, FBB
Dual SB, B&F
(c)
25 26 27 28 29 30 31
CNR (dB-Hz)
10
1
10
2
10
3
10
4
MAT
Achieved MAT [s] at considered step
Single SB, FBB
ep
Single SB, B&F
(d)
Figure 9: Step needed to achieve a target average P
d
= 0.9, at false alarm P
fa
= 10
−3
and corresponding mean acquisition time, SinBOC(1,1)
signal. Code length 4092 chips, penalty factor K
penalty
= 1, single frequency-bin. N
pieces
= 2forFBB
ep
. Left: dual sideband. Right: single
sideband.
assume a SinBOC(1,1)-modulated signal, a CNR = 30 dB-
Hz, and a target average detection probability of P
d
= 0.9at
P
fa
= 10
−3
.Forthesevalues,weneedastepof(Δt)
bin
= 1.2
chips for the dual-sideband B&F method (which will cor-
respond to a mean acquisition time
T
acq
= 86.24 s for sin-
gle frequency serial search and 4092-chip length code) and a
step of (Δt)
bin
= 1.7 chips for dual-sideband FBB
ep
method
with N
pieces
= 2(i.e.,T
acq
= 58.14 s). Thus, the step can be
about 50% higher for dual-sideband FBB case than for dual-
sideband B&F case, and we may gain about 48% in the MAT
(i.e., MAT is 48% less in dual-SB FBB case than in dual-SB
B&F case). For single-sideband approaches, the differences
between FBB and B&F methods are smaller. An illustrative
plots is shown in Figure 9, where the needed steps and the
achievable mean acquisition times are given with respect to
CNR. We notice that FBB methods outperform B&F meth-
ods at high CNRs. Below a certain CNR limit (which, of
course, depends on the (N
c
, N
nc
) pair), B&F method may
be better than FBB method.
The optimal number of pieces or filters to be used in the
filter bank depends on the CNR, on the method (single or
dual SB), and on the BOC modulation orders. From simu-
lation results (not included here due to lack of space), best
values between 2 and 6 have been observed. This is due to
the fact that a too high N
pieces
parameter would deteriorate
the signal power too much.
We remark that the choice of the penalty factor has not
been documented well in the literature. The penalty time se-
lection is in general related to the quality of the following
code tracking circuit. There is a wide range of values that
K
penalty
may take and no general rule about the choice of
K
penalty
has been given so far, to the author’s knowledge. For
example, in [22]apenaltyfactorK
penalty
= 1 was consid-
ered; in [23] simulations were carried out for K
penalty
= 2, in
[24] a penalty factor of K
penalty
= 10
3
was used, while in [25]
we have K
penalty
= 10
6
. Penalty factors with respect to dwell
times were also used in the literature, for example: K
penalty
=
10
5
/(N
c
N
nc
)[26, 27], or K
penalty
= 10
7
/(N
c
N
nc
)[27](inour
simulations, N
c
N
nc
= 40 ms). Therefore, K
penalty
may spread
over an interval of [1, 10
6
], therefore, in our simulations we
considered the 2 extreme cases: K
penalty
= 1(Figure 9)and
K
penalty
= 10
6
(Figure 10). Figure 10 uses exactly the same
parameters as Figure 9, with the exception of the penalty
factor, which is now K
penalty
= 10
6
.ForK
penalty
= 10
6
of
Figure 10, MAT for the dual-sideband B&F method becomes
T
acq
= 8.62 ∗ 10
4
, which is still higher than MAT for the
dual-sideband FBB
ep
(T
acq
= 5.8 ∗ 10
4
s). Similar improve-
ments in MAT times via FBB processing (as for K
penalty
= 1)
are observed if we increase the penalty time.
The plots with respect to the receiver operating charac-
teristics (ROC) are shown in Figure 11 for a CNR of 30 dB-
Hz. ROC curves are obtained by plotting the misdetection
probability 1
−P
d
versus false alarm probability P
fa
[28]. The
lower the area below the ROC curves is, the better the per-
formance of the algorithm is. As seen in Figure 11, the dual
sideband unambiguous methods have the best performance.
10 EURASIP Journal on Wireless Communications and Networking
25 26 27 28 29 30 31
CNR (dB-Hz)
10
4
10
5
10
6
MAT
Achieved MAT [s] at considered step
Dual SB, FBB
ep
Dual SB, B&F
(a)
25 26 27 28 29 30 31
CNR (dB-Hz)
10
4
10
5
10
6
10
7
MAT
Achieved MAT [s] at considered step
Single SB, FBB
ep
Single SB, B&F
(b)
Figure 10: Mean acquisition time corresponding to the step needed to achieve a target average P
d
= 0.9, at false alarm P
fa
= 10
−3
, Sin-
BOC(1,1) signal. Code length 4092 chips, penalty factor K
penalty
= 10
6
, single frequency-bin. N
pieces
= 2forFBB
ep
. Left: dual sideband. Right:
single sideband.
10
−10
10
−8
10
−6
10
−4
10
−2
False alarm probability P
fa
0
0.1
0.2
0.3
0.4
0.5
0.6
0.7
0.8
0.9
1
Mis-detection probability 1-P
d
ROC, (Δt)
bin
= 0.5 chips, CNR = 30 dB-Hz
aBOC
Single BF
Dual BF
Single FBB
Dual FBB
(a)
10
−10
10
−8
10
−6
10
−4
10
−2
False alarm probability P
fa
0
0.1
0.2
0.3
0.4
0.5
0.6
0.7
0.8
0.9
1
Mis-detection probability 1-P
d
ROC, (Δt)
bin
= 1.5 chips, CNR = 30 dB-Hz
aBOC
Single BF
Dual BF
Single FBB
Dual FBB
(b)
Figure 11: Receiver operating characteristic for CNR = 30 dB-Hz, SinBOC(1,1) signal, N
c
= 20, N
nc
= 2. Left: (Δt)
bin
= 0.5 chips; right
(Δt)
bin
= 1.5 chips.
At low time-bin steps (e.g., (Δt)
bin
= 0.5 chips), the FBB and
B&F methods behave similarly, as it has been seen before also
in Figure 8. The main advantage of FBB methods is observed
for time-bin steps higher than one chip, as shown in the left
plot of Figure 11. For both time-bin steps considered here,
the single sideband unambiguous methods have a threshold
false alarm, below which their performance becomes worse
than that of ambiguous BOC approach. This threshold de-
pends on the CNR, on the integration times, and on the time-
bin step and it is typically quite low (below 10
−5
).
6. CONCLUSIONS
This paper introduces a new class of code acquisition meth-
ods for BOC-modulated CDMA signals, based on filter bank
processing. The detailed theoretical characterization of this
ElenaSimonaLohan 11
new method has been given and theoretical curves were val-
idated via simulations. The performance comparison with
other methods (i.e., ambiguous BOC and Betz&Fishman
sideband correlator) showed that FBB techniques can be suc-
cessfully employed if the target is to increase the time-bin
step of the acquisition process and to minimize the mean ac-
quisition times and the computational load of the correlator.
ACKNOWLEDGMENTS
This work was carried out in the project “Advanced Tech-
niques for Personal Navigation (ATENA)” funded by the
Finnish Funding Agency for Technology and Innovation
(Tekes). This work has also been supported by the Academy
of Finland.
REFERENCES
[1] J. W. Betz, “The offset carrier modulation for GPS moderniza-
tion,” in Proceedings of the International Technical Meeting of
the Institute of Navigation (ION-NTM ’99), pp. 639–648, San
Diego, Calif, USA, January 1999.
[2] A. Burian, E. S. Lohan, and M. Renfors, “BPSK-like methods
for hybrid-search acquisition of Galileo signals,” in Proceedings
of the IEEE International Conference on Communications (ICC
’06), vol. 11, pp. 5211–5216, Istanbul, Turkey, June 2006.
[3] E. S. Lohan, A. Lakhzouri, and M. Renfors, “Binary-offset-
carrier modulation techniques with applications in satel-
lite navigation systems,” Wireless Communications and Mobile
Computing, vol. 7, no. 6, pp. 767–779, 2006.
[4] E. S. Lohan, A. Lakhzouri, and M. Renfors, “Spectral shap-
ing of Galileo signals in the presence of frequency offsets and
multipath channels,” in Proceedings of 14th IST Mobile & Wire-
less Communications Summit, Dresden, Germany, June 2005,
CDROM.
[5] S.Fischer,A.Gu
´
erin, and S. Berberich, “Acquisition concepts
for Galileo BOC(2,2) signals in consideration of hardware lim-
itations,” in Proceedings of the 59th IEEE Vehicular Technology
Conference (VTC ’04), vol. 5, pp. 2852–2856, Milan, Italy, May
2004.
[6] N. Martin, V. Leblond, G. Guillotel, and V. Heiries, “BOC(x,y)
signal acquisition techniques and performances,” in Proceed-
ings of the 16th International Technical Meeting of the Satellite
Division of the Institute of Navigation (ION GPS/GNSS ’03),
pp. 188–198, Portland, Ore, USA, September 2003.
[7] B. Bandemer, H. Denks, A. Hornbostel, A. Konovaltsev, and
P. R. Coutinho, “Performance of acquisition methods for
Galileo SW receivers,” in Proceedings of the European Navi-
gation Conference (ENC-GNSS ’05), Munich, Germany, July
2005, CDROM.
[8]B.C.Barker,J.W.Betz,J.E.Clark,etal.,“Overviewofthe
GPS M code signal,” in Proceedings of the International Tech-
nical Meeting of the Institute of Navigation (ION-NTM ’00),
Anaheim, Calif, USA, January 2000, CDROM.
[9] P. Fishman and J. W. Betz, “Predicting performance of direct
acquisition for the M-code signal,” in Proceedings of the Inter-
national Technical Meeting of the Institute of Navigation (ION-
NTM ’00), pp. 574–582, Anaheim, Calif, USA, January 2000.
[10] V. Heiries, D. Roviras, L. Ries, and V. Calmettes, “Analysis of
non ambiguous BOC signal acquisition performance,” in Pro-
ceedings of the 18th International Technical Meeting of the Satel-
lite Division of the Institute of Navigation (ION-GNSS ’05),
Long Beach, Calif, USA, September 2005, CDROM.
[11] E. S. Lohan, “Statistical analysis of BPSK-like techniques for
the acquisition of Galileo signals,” in Proceedings of the 23rd
AIAA International Communication Systems Conference (IC-
SSC ’05), Rome, Italy, September 2005, CDROM.
[12] E. S. Lohan, “Filter-bank based technique for fast acquisition
of Galileo and GPS signals,” in Proceedings of the 17th IEEE
International Symposium on Personal, Indoor and Mobile Ra-
dio Communications (PIMRC ’06), pp. 1–5, Helsinki, Finland,
September 2006.
[13] E. D. Kaplan, Understanding GPS: Principles and Applications,
Artech House, London, UK, 1996.
[14] P. W. Ward, “GPS receiver search techniques,” in Proceedings
of the IEEE Position Location and Navigation Symposium,pp.
604–611, Atlanta, Ga, USA, April 1996.
[15] M. Katz, Code acquisition in advanced CDMA networks,Ph.D.
thesis, University of Oulu, Oulu, Finland, 2002.
[16] J. Betz and P. Capozza, “System for direct acquisition of re-
ceived signals,” US patent no. 2004/0071200 A1, April 2004.
[17] J. Proakis, Digital Communications, McGraw-Hill, New York,
NY, USA, 4th edition, 2001.
[18] R. R. Rick and L. B. Milstein, “Optimal decision strate-
gies for acquisition of spread-spectrum signals in frequency-
selective fading channels,” IEEE Transactions on Communica-
tions, vol. 46, no. 5, pp. 686–694, 1998.
[19] F. Bastide, O. Julien, C. Macabiau, and B. Roturier, “Analysis
of L5/E5 acquisition, tracking and data demodulation thresh-
olds,” in Proceedings of the International Technical Meeting of
the Satellite Division of the Institute of Navigation (ION-GPS
’02), pp. 2196–2207, Portland, Ore, USA, September 2002.
[20] S. H. Raghavan and J. K. Holmes, “Modeling and simulation of
mixed modulation formats for improved CDMA bandwidth
efficiency,” in Proceedings of the 60th IEEE Vehicular Technol-
og y Conference (VTC ’04), vol. 6, pp. 4290–4295, Los Angeles,
Calif, USA, September 2004.
[21] J. Holmes and C. Chen, “Acquisition time performance of PN
spread-spectrum systems,” IEEE Transactions on Communica-
tions, vol. 25, no. 8, pp. 778–784, 1977.
[22] G. J. R. Povey, “Spread spectrum PN code acquisition using
hybrid correlator architectures,” Wireless Personal Communi-
cations, vol. 8, no. 2, pp. 151–164, 1998.
[23] W. Zhuang, “Noncoherent hybrid parallel PN code acquisition
for CDMA mobile communications,” IEEE Transactions on Ve-
hicular Technology, vol. 45, no. 4, pp. 643–656, 1996.
[24] E. A. Homier and R. A. Scholtz, “Hybrid fixed-dwell-time
search techniques for rapid acquisition of ultra-wideband sig-
nals,” in Proceedings of the International Workshop on Ultra-
Wideband Systems, Oulu, Finland, June 2003.
[25] B J. Kang and I K. Lee, “A performance comparison of code
acquisition techniques in DS-CDMA system,” Wireless Per-
sonal Communications, vol. 25, no. 2, pp. 163–176, 2003.
[26] O S. Shin and K. B. Lee, “Utilization of multipaths for spread-
spectrum code acquisition in frequency-selective Rayleigh fad-
ing channels,” IEEE Transactions on Communications, vol. 49,
no. 4, pp. 734–743, 2001.
[27] D. DiCarlo and C. Weber, “Multiple dwell serial search: perfor-
mance and application to direct sequence code acquisition,”
IEEE Transactions on Communications, vol. 31, no. 5, pp. 650–
659, 1983.
[28] S. Soliman, S. Glazko, and P. Agashe, “GPS receiver sensitiv-
ity enhancement in wireless applications,” in Proceedings of
the IEEE MTT-S International Tipical Symposium on Technolo-
gies for Wireless Applications, pp. 181–186, Vancouver, Canada,
February 1999.