Báo cáo hóa học: " Research Article Inter- and Intrasite Correlations of Large-Scale Parameters from Macrocellular Measurements at 1800 MHz" doc
Bạn đang xem bản rút gọn của tài liệu. Xem và tải ngay bản đầy đủ của tài liệu tại đây (1.76 MB, 12 trang )
Hindawi Publishing Corporation
EURASIP Journal on Wireless Communications and Networking
Volume 2007, Article ID 25757, 12 pages
doi:10.1155/2007/25757
Research Article
Inter- and Intrasite Correlations of Large-Scale Parameters
from Macrocellular Measurements at 1800 MHz
Niklas Jald
´
en, Per Zetterberg, Bj
¨
orn Ottersten, and Laura Garcia
ACCES Linnaeus Center, KTH Signal Processing Lab, Royal Institute of Technology, 100 44 Stockholm, Sweden
Received 15 November 2006; Accepted 31 July 2007
Recommended by A. Alexiou
The inter- and intrasite correlation properties of shadow fading and power-weighted angle spread at both the mobile station and
the base station are studied utilizing narrowband multisite MIMO measurements in the 1800MHz band. The influence of the
distance between two base stations on the correlation is studied in an urban environment. Measurements have been conducted
for two different situations: widely separated as well as closely located base stations. Novel results regarding the correlation of the
power-weighted angle spread between base station sites with different separations are presented. Furthermore, the measurements
and analysis presented herein confirm the autocorrelation and cross-correlation properties of the shadow fading and the angle
spread that have been observed in previous studies.
Copyright © 2007 Niklas Jald
´
en et al. This is an open access article distributed under the Creative Commons Attribution License,
which permits unrestricted use, distribution, and reproduction in any medium, provided the original work is properly cited.
1. INTRODUCTION
As the demand for higher data rates increases faster than
the available spectrum, more efficient spectrum utilization
methods are required. Multiple antennas at both the receiver
and the transmitter, so-called multiple input multiple output
(MIMO) systems, is one technique to achieve high spectral
efficiency [1, 2]. Since multiantenna communication systems
exploit the spatial characteristics of the propagation envi-
ronment, accurate channel models incorporating spatial pa-
rameters are required to conduct realistic performance eval-
uations. Since future systems may reuse frequency channels
within the same cell to increase system capacity, the charac-
terization of the communication channel, including corre-
lation properties of spatial parameters, becomes more criti-
cal. Several measurement campaigns have been conducted to
develop accurate propagation models for the design, analy-
sis, and simulation of MIMO wireless systems [3–9]. Most of
these studies are based on measurements of a single MIMO
link (one mobile and one base station). Thus, these mea-
surements may not capture all necessary aspects required for
multiuser MIMO systems. From the measurement data col-
lected, several parameters describing the channel character-
istics can be extracted. This work primarily focusses on ex-
tracting some key parameters that capture the most essential
characteristics of the environment, and that later can be used
to generate realistic synthetic channels with the purpose of
link level simulations. To evaluate system performance with
several base stations (BS) and mobile stations (MS), it has
generally been assumed that all parameters describing the
channels are independent from one link (single BS to sin-
gle MS) to another [3, 10]. However, correlation between
the channel parameters of different links may certainly ex-
ist, for example, when one BS communicates with two MSs
that are located in the same vicinity, or vice versa. In this
case, the radio signals propagate over very similar environ-
ments and hence, parameters such as shadow fading and/or
spread in angle of arrival should be very similar. This has
also been experimentally observed in some work where the
autocorrelation of the so-called large scale (LS) is studied.
These LS parameters, such as shadow fading, delay spread,
and angle spread, are shown to have autocorrelation that de-
creases exponentially with a decorrelation distance of some
tenths of meters [11, 12]. High correlation of these parame-
ters is expected if the MS moves within a small physical area.
We believe that this may also be the case for multiple BSs
that are closely positioned. The assumption that the chan-
nel parameters for different links are completely indepen-
dent may result in over/under estimation of the performance
of the multiuser systems. Previous studies [13–15] have in-
vestigated the shadow fading correlation between two sepa-
rate base station sites and found substantial correlation for
2 EURASIP Journal on Wireless Communications and Networking
closely located base stations. However, the intersite correla-
tion of angle spreads has not been studied previously. Herein,
multisite MIMO measurements have been conducted to ad-
dress this issue. We investigate the existence of correlation
between LS parameters on separate links using data collected
in two extensive narrow-band measurement campaigns. The
intra- and intersite correlations of the shadow fading and the
power-weighted angle spread at the base and mobile stations
are investigated. The analysis provides unique correlation re-
sults for base- and mobile-station angle spreads as well as
log-normal (shadow) fading.
The paper is structured as follows: in Section 2 we give
a short introduction to the concept of large-scale parame-
ters and in Section 3 some relevant previous research is sum-
marized. The two measurement campaigns are presented in
Section 4.InSection 5, we state the assumptions on the chan-
nel model while Section 6 describes the estimation proce-
dure. The results are presented in Section 7 and conclusions
are drawn in Section 8.
2. INTRODUCTION TO LARGE-SCALE PARAMETERS
The wireless channel is very complex and consists of time
varying multipath propagation and scattering. We consider
channel modeling that aims at characterizing the radio media
for relevant scenarios. One approach is to conduct measure-
ments and “condense” the information of typical channels
into a parameterized model that captures the essential statis-
tics of the channel, and later create synthetic data with the
same properties for evaluating link and system-level perfor-
mance, and so on. Large-scale parameters are based on this
concept. The term large-scale parameters was used [3]fora
collection of quantities that can be used to describe the char-
acteristics of a MIMO channel. This collection of parameters
are termed large scale because they are assumed to be con-
stant over “large” areas of several wavelengths. Further, these
parameters are assumed to depend on the local environment
of the transmitter and receiver. Some of the possible LS pa-
rameters are listed below:
(i) shadow fading,
(ii) angle of arrival (AoA) angle spread,
(iii) angle of departure (AoD) angle spread,
(iv) AoA elevation spread,
(v) AoD elevation spread,
(vi) cross polarization ratio,
(vii) delay spread.
This paper investigates only the shadow fading and the
angle spread parameters. Shadow fading describes the varia-
tion in the received power around some local mean, which
depends on the distance between the transmitter and re-
ceiver; see Section 6.1. The power-weighted angle spread de-
scribes the size of the sector or area from which the majority
of the power is received. The angle spread parameter will be
different for the transmitter (Tx) and receiver (Rx) sides of
the link, since it largely depends on the amount of local scat-
MS
BS
1
BS
2
α
d
1
d
2
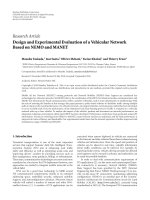
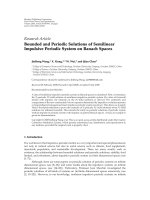
Figure 1: Model of the cross-correlation as a function of the relative
distance and angle separation, also proposed in [16].
tering; see further in Section 5. A description of the other LS
parameters may be found in [3].
3. PREVIOUS WORK
An early paper by Graziano [13] investigates the correlation
of shadow fading in an urban macrocellular environment be-
tween one MS and two BSs. The correlation is found to be
approximately 0.7-0.8 for small angles (α<10
◦
), where α
is defined as displayed in Figure 1.Later,Weitzenarguedin
[14] that the correlation for the shadow fading can be much
less than 0.7 even for small angles, in disagreement with the
results presented by Graziano. This was illustrated by ana-
lyzing measurement data collected in the downtown Boston
areausingonecustommadeMSandseveralpairsofBSs
from an existing personal communication system. These re-
sults are reasonable since in most current systems the BS sites
are widely spread over an area. If the angle α separating the
two BSs is small, the relative distance is large, and a small rel-
ative distance corresponds to a large angle separation. Thus,
a more appropriate model for the correlation of the shadow
fading parameter is to assume that it is a function of the rel-
ative distance d
= log
10
(d
1
/d
2
) between the two BSs and the
angle α separating them as proposed in [16]. The distances d
1
and d
2
are defined as in Figure 1. Further studies on the cor-
relation of shadow fading between several sites can be found
in, for example, [15, 17–19].
The angular spread parameter has been less studied. In
[12], the autocorrelation of the angle spread at a single base
station is studied and found to be well modeled by an expo-
nential decay, and the angle spread is further found to be neg-
atively correlated with shadow fading. However, to the au-
thors’ knowledge, the intersite correlation of the angle spread
at the MS or BS has not been studied previously. Herein, we
extend the analysis performed on the 2004 data in [20]. We
also investigate data collected in 2005 and find substantial
correlation between the shadow fading but less between the
angular spreads. The low correlation of the spatial parame-
ters may be important for future propagation modeling. The
angle spread at the mobile station is studied and a distribu-
tion proposed. Further, we find that the correlation between
the base station and mobile station angular spreads (of the
same link) is significant for elevated base stations but virtu-
ally zero for base stations just above rooftop.
Niklas Jald
´
en et al. 3
4. MEASUREMENT CAMPAIGNS
Two multiple-site MIMO measurement campaigns have
been conducted by KTH in the Stockholm area using cus-
tom built multiple antenna transmitters and receivers. These
measurements were carried out in the summer of 2004 and
the autumn of 2005 and will in the following be refereed to
as the 2004 and 2005 campaigns.
Because of measurement equipment shortcomings, the
measured MIMO channels have unknown phase rotations.
This is due to small unknown frequency offsets. In the 2004
campaign, these phase rotations are introduced at the mobile
side and therefore the relation between the measured channel
andthetruechannelisgivenby
H
measured, 2004
= Λ
f
H
true
,(1)
where Λ
f
= diag(exp(j2πf
1
t), ,exp(j2πf
n
t)) and f
1
, ,
f
n
are unknown. Similarly, the campaign of 2005 has un-
known phase rotations at the base station side
1
resulting in
the following relation:
H
measured, 2005
= H
true
Λ
f
. (2)
Thefrequencieschangedup5Hzpersecond.However,
the estimators that will be used are designed with these short-
comings in mind.
4.1. Measurement hardware
The hardware used for these measurements is the same as
the hardware described in [21, 22]. The transmitter continu-
ously sends a unique tone on each antenna in the 1800 MHz
band. The tones are separated 1 kHz from each other. The re-
ceiver downconverts the signal to an intermediate frequency
of 10 kHz, samples and stores the data on a disk. This data
is later postprocessed to extract the channel matrices. The
system bandwidth is 9.6 kHz, which allows narrow-band
channel measurements with high sensitivity. The offline and
narrow-band features simplify the system operation, since
neither real-time constrains nor broadband equalization is
required. For a thorough explanation of the radio frequency
hardware, [23] may be consulted.
4.2. Antennas
In both measurements campaigns, Huber-Suhner dual-
polarized planar antennas with slanted linear polarization
(
±45
◦
), SPA 1800/85/8/0/DS, were used at both the trans-
mitter and the receiver. However, only one of the polariza-
tions (+45
◦
) was actually used in these measurements. The
antennas were mounted in different structures on the mobile
and base stations as described below. For more information
on the antenna radiation patterns and so on, see [24].
1
In the 2004 campaign, the phase rotations are due to drifting and un-
locked local oscillators in the four mobile transmitters, while in the 2005
campaign they are due to drifting sample-rates in the D/A and A/D con-
verters.
2
3
(a)
Ref.
Tx
1
Tx
2
Tx
3
Tx
4
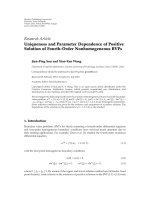
(b)
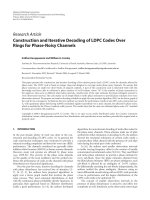
Figure 2: Mobile station box antenna.
4.2.1. Base satation array
At the base station, the antenna elements were mounted on
a metal plane to form a uniform linear array with 0.56 wave-
length (λ) spacing. In the 2004 campaign, an array of four by
four elements was used at the BS. However, the “columns”
were combined using 4 : 1 combiners to produce four ele-
ments with higher vertical gain. The base stations in the 2005
campaign were only equipped with 2 elements.
4.2.2. Mobile station array
At the mobile side, the four antenna elements were mounted
on separate sides of a wooden box as illustrated in Figure 2.
This structure is similar to the uniform linear array using
four elements. A wooden box is used so that the antenna ra-
diation patterns are unaffected by the structure.
4.3. 2004 campaign
In this campaign uplink measurements were made using one
4-element box-antenna transmitter at the MS, see Figure 2,
and three 4-element uniform linear arrays (ULA), with an
antenna spacing of 0.56λ, at the receiving BSs. The BSs cov-
ered 3 sectors on two different sites. Site 1, K
˚
arhuset-A, had
one sector while site 2, Vanadis, had two sectors, B and C,
separated some 20 meters and with boresights offset 120-
degrees in angle. We define a sector by the area seen from
the BS boresight
±60
◦
. The environment where the measure-
ments where conducted can be characterized as typical Eu-
ropean urban with mostly six to eight storey stone buildings
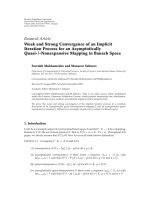
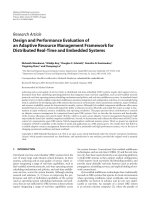
and occasional higher buildings and church towers. Figure 3
shows the location of the base station sites and the route cov-
ered by the MS. The BS sectors are displayed by the dashed
lines in the figure, and the arrow indicates the antenna point-
ing direction. Sector A is thus the area seen between the
dashed lines to the west of site K
˚
arhuset. Sector B and sec-
tor C are the areas southeast and northeast of site Vanadis,
respectively. A more complete description of the transmitter
hardware and measurement conditions can be found in [25].
4 EURASIP Journal on Wireless Communications and Networking
K
˚
arhuset
Vanadis
MS
1
2
3
4
Figure 3: Measurement geography and travelled route for 2004
campaign.
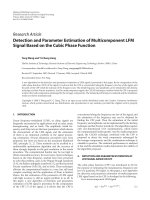
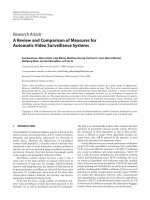
Figure 4: Measurement map and travelled route for the 2005 cam-
paign.
4.4. 2005 campaign
In contrast to the previous campaign, the 2005 campaign
collected data in the downlink. Two BSs with two antennas
each were employed (the same type of antenna elements as in
the 2004 campaign was used), each transmitting, simultane-
ously, one continuous tone separated 1 kHz in the 1800 MHz
band. The two base stations were located on the same roof
separated 50 meters, with identical boresight and therefore
covering almost the same sector. The characteristics of the
environment in the measured area are the same as 2004. The
routes were different but with some small overlap. The MS
was equipped with the 4-element box antenna as was used
in 2004, see Figure 2, to get a closer comparison between the
two campaigns. In Figure 4, we see the location of the two
BSs (in the upper left corner) and the measured trajectory
which covered a distance of about 10 km. The arrow in the
figure indicates the pointing direction of the base station an-
tennas. The campaign measurements were conducted during
two days, and the difference in color of the MS routes depicts
which area was measured which day. The setups were identi-
cal on these two days.
5. PRELIMINARIES
Assume we have a system with M Tx antennas at the base
station and K Rx antennas at the mobile station. Let h
k,m
(t)
denote the narrow-band MIMO channel between the kth
receiver antenna and the mth transmitter antenna. The
narrow-band MIMO channel matrix is then defined as
H(t)
=
⎛
⎜
⎜
⎜
⎜
⎜
⎝
h
1,1
(t) h
1,2
(t) h
1,M
(t)
h
2,1
(t)
.
.
.
.
.
.
.
.
.
.
.
.
.
.
.
h
K,1
(t) h
K,M
(t)
⎞
⎟
⎟
⎟
⎟
⎟
⎠
. (3)
The channel is assumed to be composed of N propaga-
tion rays. The nth ray has angle of departure θ
k
,angleof
arrival α
k
,gaing
k
,andDopplerfrequency f
k
. The steering
vector
2
of the transmitter given by a
Tx
(θ
k
) and that of the
receiver is a
Rx
(α
k
). Thus,thechannelisgivenby
H
=
N
k=1
g
k
e
j2πf
k
t
a
Rx
α
k
a
Tx
θ
k
H
. (4)
The ray parameters (θ
k
, α
k
, g
k
,and f
k
)areassumedtobe
slowly varying and approximately constant for a distance of
30λ. Below, we define the shadow fading and the base station
and the mobile station angle spread.
5.1. Shadow fading
The measured channel matrices are normalized so that they
are independent of the transmitted power. The received
power, P
Rx
, at the MS is defined as
P
Rx
= E|H|
2
P
Tx
=
N
k=1
g
k
2
a
BS
θ
k
2
a
MS
,
α
k
2
P
Tx
,
(5)
where P
Tx
is the transmit power. The ratio of the received and
the transmitted powers is commonly assumed to be related as
[26]
P
Rx
P
Tx
=
K
R
n
S
SF
,(6)
2
The steering vector a(θ) can be seen a complex-valued vector of length
equal to the number of antenna elements in the array. The absolute value
of the kth element is the square root of the antenna gain of that element
and the phase shift of the element relative to some common reference
point. That is a
k
(θ) =
a
k
(θ)e
jφ
k
.
Niklas Jald
´
en et al. 5
where K is a constant, proportional to the squared norms of
the steering vectors that depend on the gain at the receiver
and transmitter antennas as well as the carrier frequency,
base station height, and so on. The distance separating the
transmitter and receiver is denoted by R. The variable S
SF
de-
scribes the slow variation in power, usually termed shadow
fading, and is due to obstacles and obstruction in the propa-
gation path. Expressing (6) in decibels (dB) and rearranging
the terms in the path loss, which describe the difference be-
tween transmitted and received powers, we have
L
= 10log
10
P
Tx
−10log
10
P
Rx
=
n10log
10
(R) −10log
10
(K) − 10log
10
S
SF
,
(7)
where the logarithm is taken with base ten. Thus, the path
loss is assumed to be linearly decreasing with log-distance
separating the transmitter and receiver when measured in
dB.
5.2. Base station power-weighted angle spread
The power-weighted angle spread at the base station, σ
2
AS,BS
,
is defined as
σ
2
AS,BS
=
N
k=1
p
k
θ
k
−θ
2
,(8)
where p
k
=
g
k
2
is the power of the kth ray and the mean
angle
θ is given by
θ =
N
k=1
p
k
θ
k
. (9)
5.3. Mobile station power-weighted angle spread
The power-weighted angle spread at the mobile station,
σ
2
AS,MS
,isdefinedas
σ
2
AS,MS
= min
α
1
N
k
=1
p
k
N
k=1
p
k
mod
α
k
−α
2
, (10)
where
mod is short for modulo and defined as
mod (α) =
⎧
⎪
⎪
⎨
⎪
⎪
⎩
α + 180, when α<−180,
α, when
|α| < 180,
α
−180, when α>180.
(11)
The definition of the MS angle spread is equivalent to the
circular spread definition in [10, Annex A]. In the following,
the power-weighted angle spread will be refereed to as the
angle spread.
6. PARAMETER ESTIMATION PROCEDURES
In the measurement equipment, the receiver samples the
channel on all Rx antennas simultaneously at a rate which
provides approximately 35 channel realizations per wave-
length. The first step of estimating the LS parameters is
Table 1: Number of measured 30λ segments from each measure-
maent campaign, and number of segments in each BS sector.
All data 2004 S
A
S
B
S
C
All data 2005
2089 1742 1636 453 1637
to segment the data into blocks of length 30λ. This corre-
sponds to approximately a 5m trajectory, during which the
ray-parameters are assumed to be constant, [12], and there-
fore the LS parameters are assumed to be constant as well.
Then smaller data sets for each BS are constructed such that
they only contain samples within the given BS’s sector and
blocks outside the BS’s sector of coverage are discarded; see
definition in Section 4.3. Tab le 1 shows the total number of
measured 30λ segments from the campaigns as well as the
number of segments within each BS sector.
6.1. Estimation of shadow fading
The fast fading due to multipath scattering varies with a dis-
tance on the order of a wavelength [26]. Thus, the first step
to estimate the shadow fading is to remove the fast fading
component. This is done by averaging the received power
over the entire 30 λ-segment and over all Tx and Rx anten-
nas. The path loss component is estimated by calculating the
least squares fit to the average received powers from all 30 λ-
segments against log-distance. The shadow fading, which is
the variation around a local mean, is then estimated by sub-
tracting the distant dependent path loss component from the
average received power for each local area. This estimation
method for the shadow fading is the same as in, for example,
[12].
6.2. Estimation of the base station
power-weighted angle spread
Although advanced techniques have been developed for es-
timating the power-weighted angle spread, [27–29], a sim-
ple estimation procedure will be used here. Previously re-
ported estimation procedures use information from several
antenna elements where both amplitude and phase informa-
tion is available. In [25], the angle spread for the 2004 data
set is estimated using a precalculated look-up table generated
using the gain from a beam steered towards the angle of ar-
rival. However, as explained in Section 4.4, the BSs used in
2005 were only equipped with two antenna elements with
unknown frequency offsets, and thus a beam-forming ap-
proach, or more complex estimation methods, are not appli-
cable. Therefore, we have devised another method to obtain
reasonable estimates of the angle spread applicable to both
our measurement campaigns. We cannot measure the angle
of departure distribution itself, thus we will only consider its
second-order moment, that is, the angle of departure spread.
This method is similar to the previous one [25] in that a look-
up table is used for determining the angle spreads. How-
ever here the cross-correlation between the signal envelopes
is used instead of the beam-forming gain.
6 EURASIP Journal on Wireless Communications and Networking
The look-up table, which contains the correlation coeffi-
cient as a function of the angle spread and the angle of depar-
ture, has been precalculated by generating data from a model
with a Laplacian (power-weighted) AoD distribution, since
this distribution has been found to have a very good fit to
measurement data; see, for example, [30]. The details of the
look-up table generation is described in Appendix A.Note
that our method is similar to the method used in [31], where
the correlation coefficient is studied as a function of the an-
gle of arrival and the antenna separation. To estimate the an-
gle spread with this approach, only the correlation coefficient
between the envelopes of the received signals at the BS and
the angle to the MS is calculated, where the latter is derived
using the GPS information supplied by the measurements.
For the 2005 measurements, which were conducted with
two antenna elements at the BS and four antennas at the MS,
the cross-correlation between the signal envelopes at the BS
is averaged over all four mobile antennas as
c
1,2
=
4
k=1
E
H
k,1
−
m
k,1
H
k,2
−
m
k,2
σ
k,1
σ
k,2
, (12)
where
m
k,1
= E
H
k,1
,
m
k,2
= E
H
k,2
,
σ
2
k,1
= E
H
k,1
−
m
k,1
2
,
σ
2
k,2
= E
H
k,2
−
m
k,2
2
.
(13)
For the 2004 measurements, where also the BS had 4 anten-
nas, the average correlation coefficient over the three antenna
pairs is used.
The performance of the estimation method presented
above has been assessed by generating data from the SCM
model, [10], then calculating the true angle spread (which
is possible on the simulated data since all rays are known)
and the estimated angle spread using the method described
above. The results of this comparison are shown in Figure 5.
From the estimates in the figure, it is readily seen that the an-
gle spread estimate is reasonably unbiased, with a standard
deviation of 0.1 log-degrees.
6.3. Estimation of the mobile station
power-weighted angle spread
At the mobile station, an estimate of the power-weighted an-
gle spread is extracted from the power levels of the four MS
antennas. Accurate estimate cannot be expected, however,
the MS angle spread is usually very large due to rich scat-
tering at ground level in this environment and reasonable es-
timatescanstillbeobtainedaswillbeseen.
A first attempt is to use a four-ray model where the AoAs
of the four rays are identical to the boresights of the four MS
antennas, that is, α
n
= 90
◦
(n − 2.5). The powers of the four
rays p
1
, , p
4
are obtained from the powers of the four an-
tennas, that is, the Euclidean norm of the rows of the chan-
nel matrices H. These estimates are obtained by averaging the
fast fading over the 30λ segments. From the powers the angle
1.6
1.4
1.2
1
0.8
0.6
0.4
0.2
0
log
10
estimated angle spread
0 0.2 0.4 0.6 0.8 1 1.2 1.4 1.6
log
10
true angle spread
Figure 5: Performance of the angle spread estimator on SCM gen-
erated data.
spread is calculated using the circular model defined in (11)
resulting in
σ
2
AS,MS-fe
= min
α
1
4
n
=1
p
n
4
n
=1
p
n
mod
90
n −2.5
−α
2
,
(14)
where (
·)
fe
is short for first-estimate. As explained in [10,
Annex A], the angle spread should be invariant to the ori-
entation of the antenna, hence, knowledge of the moving di-
rection of the MS is not required. The performance of the
estimate is first evaluated by simulating a large number of
widely different cases, using the SCM model, and estimating
the spread based on four directional antennas as proposed
here. The result is shown in Figure 6. The details of the sim-
ulation are described in Appendix B.
The results show that the angle spread is often overesti-
mated using the proposed method. However, as indicated by
Figure 6, a better second estimate (
·)
se
is obtained by the fol-
lowing compensation:
σ
2
AS,MS-se
=
σ
2
AS,MS-fe
−30
100
70
. (15)
The performance of this updated estimator is shown in
Figure 7. The second estimate is reasonable when
σ
2
AS,MS-se
>
33. When
σ
2
AS,MS-se
< 33, the true angle spread may be any-
where from zero and
σ
2
AS,MS-se
. For small angle spreads, prob-
lems occur since all rays may fall within the bandwidth of a
single-antenna. The estimated angle spread from our mea-
surements at the MS is usually larger than 33
◦
, thus this
drawback in the estimation method has little impact on the
final result. From the estimates in Figure 7, it is readily seen
that the angle spread estimate is unbiased, with a standard
deviation of 6 degrees.
Niklas Jald
´
en et al. 7
100
90
80
70
60
50
40
30
20
10
0
Tr ue angl e s pr ea d
30 40 50 60 70 80 90 100
First estimate of MS angle spread
Estimates
Fitted line y
= (x −30)
∗
100/70
Figure 6: Performance of the first mobile station angle spread esti-
mate.
100
90
80
70
60
50
40
30
20
10
0
Tr ue angl e s pr ea d
0 102030405060708090100
Second estimate of MS angle spread
Estimates
Line y
= x
Figure 7: Performance of the second mobile station angle spread
estimate.
7. RESULTS
In this section, the results of the analysis are presented in
three parts. First the statistical information of the param-
eters is shown followed by their autocorrelation and cross-
correlation properties.
7.1. Statistical properties
The first- and the second-order statistics of the LS parameters
are estimated and shown in Ta ble 3 . The standard deviation
of the shadow fading is given in dB while the angle spread at
the BS is given in logarithmic degrees. Further, the MS an-
Table 2: Parmeters α and β for the beta best fit distribution to the
angle spread at the mobile.
2004:A 2004:B 2004:C 2005:1 2005:2
α 8.69 5.74 4.22 6.85 7.07
β 2.85 2.36 2.44 2.72 2.77
gle spread is given in degrees. The mean value of the shadow
fading component is not tabulated since it is zero by defini-
tion. As seen from the histograms in Figure 8, which shows
the statistics of the LS parameters for site 2004:B, the shadow
fading and log-angle spread can be well modeled with a nor-
mal distribution. This agrees with observations reported in
[12, 26]. The angle spread at the mobile on the other hand is
better modeled by a scaled beta distribution, defined as
f (x, α, β)
=
1
B(α,β)
x
η
α−1
1 −
x
η
β−1
, (16)
where η
= 360/
√
12 is a normalization constant, equal to the
maximum possible angle spread. The best fit shape parame-
ters α and β for each of the measurement sets are tabulated in
Ta ble 2 . The parameter B(α, β) is a constant which depends
on α and β such that
η
0
f (x, α, β)dx = 1. The distributions
of the parameters from all the other measured sites are sim-
ilar, with statistics given in Ta ble 3. From the table it is seen
that the angle spread clearly depends on the height of the BS.
The highest elevated BS, 2004:B, has the lowest angle spread
and correspondingly, the BS at rooftop level, 2004:A, has the
largest angle spread. The mean angle spreads at the base sta-
tion are quite similar to the typical urban sites in [12] (0.74–
0.95) and to those of the SCM urban macromodel (0.81–
1.18) [10]. Furthermore, the standard deviations of the an-
gle spread and the shadow fading found here, see Table 3 ,are
somewhat smaller than those of [12]. One explanation for
this could be that the measured propagation environments
in 2004 and 2005 are more uniform than those measured in
[12].
7.2. LS autocorrelation
The rate of change of the LS parameters is investigated by
estimating the autocorrelation as a function of distance trav-
elled by the MS. The autocorrelation functions for the large-
scale parameters are shown in Figures 9 and 10, where the
correlation coefficient between two variables is calculated as
explained in Appendix C. Note that the autocorrelation func-
tions can be well approximated by an exponential function
with decorrelation distances as seen in Ta ble 4.Thedecorre-
lation distance is defined as the distance for which the cor-
relation has decreased to e
−1
. Furthermore, it can be noted
that these distances are very similar for the 2004 and the
2005 measurements, which is reasonable since the environ-
ments are similar. The exponential model has been proposed
before, see [12], for the shadow fading and angle spread at
the BS. The results shown herein indicate that this is a good
model for the angle spread at the MS as well.
8 EURASIP Journal on Wireless Communications and Networking
Table 3: Inter-BS correlation for measurement campaign 2004 site A.
2004:A 2004:B 2004:C 2005:1 2005:2
std[SF] 5.6 dB 5.2 dB 5.4 dB 4.9 dB 4.9 dB
E[
σ
AS,BS
] 1.2 ld 0.91 ld 0.85 ld 0.96 ld 0.87 ld
std[
σ
AS,BS
] 0.25 ld 0.2 ld 0.23 ld 0.19 ld 0.17 ld
E[
σ
AS,MS
] 75.1 deg 70.6 deg 65.9 deg 71.6 deg 72.2 deg
std[
σ
AS,MS
] 15.7deg 18.7 deg 19.2 deg 16.1 deg 16.9 deg
Table 4: Average decorrelation distane in maters for the estimated
large-scale parameters.
SF σ
AS,BS
σ
AS,MS
d
decorr
(m) 113 88 32
Table 5: Intra-BS correlation of LS parameters for measurement
campaign 2004 site A.
2004:A
SF
σ
AS,MS
σ
AS,BS
SF 1.00 −0.37 −0.46
σ
AS,MS
−0.37 1.00 0.10
σ
AS,BS
−0.46 0.10 1.00
7.3. Intrasite correlation
The intrasite correlation coefficients between different large-
scale parameters at the same site are calculated for the two
separate measurement campaigns. In Tables 5 and 6, the cor-
relation coefficients for the two base stations, sectors A and
B, from 2004 are shown, respectively. The last sector (C) is
not shown since it is very similar to B and these parame-
ters are based on a much smaller set of data, see Ta ble 1.In
Ta ble 7 , the same results are shown for the 2005 measure-
ments. Since sites (2005:1 and 2005:2) show similar results
and are from similar environments, the average correlation
of the two is shown. It follows from mathematics that these
tables are symmetrical, and in fact they only contain three
significant values. The reason for showing nine values, in-
stead of three, is to ease comparison with the intersite cor-
relation coefficients shown in Tables 8–10. As seen from the
tables, the angle spread is negatively correlated with shadow
fading as was earlier found in for example [3, 12]. The cross-
correlation coefficient between the shadow fading and base
stationanglespreadisquiteclosetothatof[12], that is
−0.5
to
−0.7. For the two cases where the BS is at rooftop level,
K
˚
arhuset, 2004:A, and the 2005 sites, there is no correlation
between the angle spreads at the MS and the BS. However,
for Vanadis, 2004:B, there is a positive correlation of 0.44. A
possible explanation is that the BS is elevated some 10 meters
over average rooftop height. Thus, no nearby scatterers exist
and the objects that influence the angle spread at the BS are
the same as the objects that influence the angle spread at the
MS. A BS at rooftop on the other hand may have some nearby
scatterers that will affect the angle of arrival and spread. In
Figure 11, this is explained graphically. The stars are some of
0.09
0.08
0.07
0.06
0.05
0.04
0.03
0.02
0.01
0
20 0 20
(dB)
Shadow fading
(a)
2
1.8
1.6
1.4
1.2
1
0.8
0.6
0.4
0.2
0
00.511.5
log
10
(degrees)
Angle spread at BS
(b)
0.025
0.02
0.015
0.01
0.005
0
0 50 100
(Degrees)
Angle spread at MS
(c)
Figure 8: Histograms of the estimated large-scale parameters for
site 2004:B.
the scatterers and the dark section of the circles depicts the
area from which the main part of the signal power comes,
that is the angle spread. In the left half of the picture, we see
an elevated BS, without close scatterers, and therefore a large
MS angle spread results in a large BS spread. In the right half
of Figure 11, a BS at rooftop is depicted, with nearby scatter-
ers, and we see how a small angle spread at the MS can result
in a large BS angle spread (or the other way around).
7.4. Inter-BS correlation
The correlation coefficients between large-scale parameters
at two separate sites are calculated for the data collected from
both measurement campaigns. Only the data points which
are common to both base station sectors, S
i
∩ S
j
,areused
for this evaluation, that is, points that are within the
±60
◦
beamwidth of both sites. As seen in section 4, describing the
measurement campaigns, there is no overlap between site
2004:B and 2004:C if one considers
±60
◦
sectors. For this
specific case, the sector is defined as the area within
±70
◦
of
the BS’s boresight, thus resulting in a 20
◦
sector overlap. The
results of this analysis are displayed in Tables 8, 9,and10 for
2004:A-B, B-C, and 2005:1-2, respectively. As earlier shown
in [20], the average correlation between the two sites 2004:A
Niklas Jald
´
en et al. 9
1
0.8
0.6
0.4
0.2
0
0.2
0.4
Correlation
0 100 200 300 400 500
Distance (m)
Site: A SF
Site: A AS
BS
Site: B SF
Site: B AS
BS
Site: 05 SF
Site: 05 AS
BS
Figure 9: Autocorrelation of the shadow fading and the angle
spread at the base station for both measurements.
1
0.9
0.8
0.7
0.6
0.5
0.4
0.3
0.2
0.1
0
Correlation
0 20406080100
Distance (m)
Site: A AS
MS
Site: B AS
MS
Site: 05 AS
MS
Figure 10: Autocorrelation of the angle spread at the mobile station
for both measurements.
and 2004:B is close to zero. This is not surprising since the
angular separation is quite large and the environments at the
two separate sites are different. The correlations between sec-
tors B and C of 2004 are similar as between sectors 1 and 2
of 2005. In both cases, the two BSs are on the same roof, and
separated 20 and 50 meters for 2004 and 2005, respectively.
As can be seen, these tables (Tables 8–10) are not symmetric.
Thus the correlation of, for example, the shadow fading at BS
2005:1 and the angle spread at BS 2005:2 is not the same as
the correlation of the shadow fading of BS 2005:2 and the an-
BS
BS
BS
MS MS MS
Elevated BS BS at rooftop (2 examples)
Figure 11: Model of correlation between angle spread at base sta-
tion and mobile station.
Table 6: Intra-BS correlation of LS parameters for measurement
campaign 2004 site B.
2004:B
SF
σ
AS,MS
σ
AS,BS
SF 1.00 −0.54 −0.69
σ
AS,MS
−0.54 1.00 0.44
σ
AS,BS
−0.69 0.44 1.00
Table 7: Intra-BS correlation of LS parameters for measurement
campaign 2005.
2005
SF
σ
AS,MS
σ
AS,BS
SF 1.00 −0.25 −0.59
σ
AS,MS
−0.25 1.00 0.11
σ
AS,BS
−0.59 0.11 1.00
Table 8: Inter-BS correlation of all studied LS parameters between
site A and site B from 2004 measurements.
2004:A
SF
σ
AS,MS
σ
AS,BS
2004:B
SF
−0.14 0.08 −0.06
σ
AS,MS
−0.07 −0.05 0.03
σ
AS,BS
−0.04 −0.09 0.07
Table 9: Inter-BS correlation of all studied LS parameters between
site B and site C from 2004 measurements.
2004:B
SF
σ
AS,MS
σ
AS,BS
2004:C
SF 0.83
−0.23 −0.52
σ
AS,MS
−0.19 0.53 0.18
σ
AS,BS
−0.54 0.22 0.31
gle spread of BS 2005:1 (SF
2005:1
, σ
2005:2
AS,BS
=SF
2005:2
, σ
2005:1
AS,BS
),
and so on. This is not surprising.
In Figure 12, the correlation coefficient is plotted against
the angle separating the two base stations with the mobile
in the vertex. The large variation of the curve is due to a
lack of data. This may be surprising in the light of the quite
10 EURASIP Journal on Wireless Communications and Networking
Table 10: Inter-BS correlation of all studied LS parameters between
site B1 and B2 from 2005 measurements.
2005:1
SF
σ
AS,MS
σ
AS,BS
2005:2
SF 0.85
−0.06 −0.45
σ
AS,MS
−0.05 0.46 0.04
σ
AS,BS
−0.27 0.18 0.33
0.8
0.6
0.4
0.2
0
0.2
0.4
0.6
0.8
Correlation
40 60 80 100 120 140 160 180
Angle separating the base stations (deg)
Shadow fading
AnglespreadatBS
AnglespreadatMS
Figure 12: Intersite correlation of the large-scale parameters as a
function of the angle separating the base stations for the 2004 mea-
surements.
long measurement routes. However, due to the long decorre-
lation distances of the LS parameters (
∼100 m), the number
of independent observations is small. The high correlation
for large angles of about 180
◦
is mainly due to a very small
data set available for this separation. Furthermore, this area
of measurements is open with a few large buildings in the
vicinity and thus the received power to both BSs is high.
If, on the other hand, the cross-correlation of the large-
scale parameters between the two base stations from the 2005
measurements is studied, it is found that the correlation is
substantial, see Table 1 0. Also, note that the correlation in an-
gle spread is much smaller than the shadow fading. If the cor-
relation is plotted as a function of the angle, separating the
BSsasinFigure 13, a slight tendency of a more rapid drop
in the correlation of angle spread than that of the shadow
fading for increasing angles is seen. The intersite correlation
results shown in Figures 12 and 13 are calculated disregard-
ing the relative distance, see Figure 1. However, for the 2005
campaign this distance d
≈ 0 is due to the location of the
base stations.
The intersite correlation of the angle spread was cal-
culated in the same way as the shadow fading. Only the
measurement locations common to two sectors were used
for these measurements. The angle spread is shown to have
1
0.8
0.6
0.4
0.2
0
0.2
0.4
0.6
Correlation
12345678910
Angle separating the base stations (deg)
Shadow fading
AnglespreadatBS
AnglespreadatMS
Figure 13: Intersite correlation of the large-scale parameters as a
function of the angle separating the base stations for the 2005 mea-
surements.
smaller correlation than the shadow fading even for small
angular separations. This indicates that it may be less im-
portant to include this correlation in future wireless channel
models. It should be highlighted that the correlations shown
in Ta ble 10 are for angles α<10
◦
and a relative distance
|d = log (d
1
/d
2
)|≈0.
8. CONCLUSION
We studied the correlation properties of the three large-scale
parameters shadow fading, base station power-weighted an-
gle spread, and mobile station power-weighted angle spread.
Two limiting cases were considered, namely when the base
stations are widely separated,
∼900 m, and when they are
closely positioned, some 20–50 meters apart.
The results in [12] on the distribution and autocorrela-
tion of shadow fading and base station angle spread were
confirmed although the standard deviations of the angular
spread and shadow fading were slightly smaller in our mea-
surements. The high interbase station shadow fading cor-
relation, when base stations are close, as observed in [13],
was also confirmed in this analysis. Our results also show
that angular spread correlation exists at both the base station
and the mobile station if the base station separation is small.
However, the correlation in angular spread is significantly
smaller than the correlation of the shadow fading. Thus it
is less important to model this effect. For widely separated
base stations, our results show that the base station and mo-
bile station angular spreads as well as the shadow fading are
uncorrelated.
The angle spread at the mobile was analyzed and a scaled
beta distribution was shown to fit the measurements well.
Further, we have also found that the base station and mo-
bile station angular spreads are correlated for elevated base
Niklas Jald
´
en et al. 11
stations but uncorrelated for base station just above rooftop.
Correlation can be expected if the scatters are only located
close to the mobile station, which is the case for macrocellu-
lar environments, as illustrated in Figure 11.
In the future, it will be of interest to assess also the region
in between the two limiting cases studied herein. Note that
the limiting case of distances of 20–50 meters has a practi-
cal interest. For instance, the sectors of three-sector sites are
sometimes not colocated but placed on different edges of a
roof. The two base stations may also belong to different op-
erators and the properties studied here could then be impor-
tant when studying adjacent carrier interference.
APPENDICES
A. GENERATION OF ANGLE SPREAD LOOK-UP TABLE
The Laplacian angle of departure distribution is given by
P
A
(θ) = Ce
(−|θ−θ
0
|)/(σ
AoD
)
,(A.1)
where θ
0
is the nominal direction of the mobile and σ
AoD
is
angle-of-departure spread. The variable C is a constant such
that
π
−π
P
A
(θ)dθ = 1. When generating data, the channel
covariance matrix is first estimated as
R
=
180
◦
θ=−180
◦
P
A
(θ)a(θ)a
∗
(θ)dθ,(A.2)
where a(θ) is the array steering vector which is given by
a(θ)
= p(θ)
1, exp
− j2πd
spacing
sin(θ)
T
,(A.3)
p(θ) is the (amplitude) antenna element diagrams of the ar-
ray, and d
spacing
is the spacing between the antenna elements
given in wavelengths. In our case the element diagrams are
approximated by
p
2
(θ) = max
10
1.4
cos
2
(θ), 10
−0.2
,(A.4)
and the antenna element spacing is 0.56 wavelength. The
procedure for calculating the look-up table is then (1) fix an-
gle spread and nominal angle of arrival, (2) calculate the co-
variance matrix R and it is eigendecomposition, (3) generate
data from the model and calculate the envelope correlation.
The choice of Laplacian (power-weighted) AoD distribu-
tion over others, such as the Gaussian one, does only affect
the estimation results marginally due to the short antenna
spacing distance. This is further explained in [31].
B. EVALUATION OF THE MOBILE STATION
ANGLE SPREAD ESTIMATOR
To test the estimator of the (power-weighted) RMS angle
spread at the mobile-station side, some propagation chan-
nels were generated. Each channel had random number of
clusters which was equally distributed between 1 and 10. The
AoA of each cluster is uniformly distributed between 0
◦
and
360
◦
. The powers of the clusters are log-normally distributed
with a standard deviation of 8 dB. Each cluster is modeled
with between 1 and 100 rays (all with equal power) which
are uniformly distributed within the cluster width. The clus-
ter widths are uniformly distributed between 0 and 10 de-
grees. One-thousand propagation (completely independent)
channels are drawn from this model. The powers of the four
antennas are calculated based on the powers of the rays, their
angle of arrival, and the antenna pattern. The true angle
spread is first estimated as described in [10, Annex A], and
then the estimation method described in Section 6.3 is ap-
plied.
C. LARGE SCALE CORRELATIONS
The correlation coefficient between two variables is defined
by the normalized covariance as
ρ
=a,b=
E[ab] −m
a
m
b
E
a
2
−
m
2
a
E
b
2
−
m
2
b
. (C.5)
At all times when calculating the cross-correlation between
LS parameters, even for small subsets of data, like when an-
alyzing the correlation as a function of angular separation
between BSs, the mean values are global. Hence the values
m
a
and m
b
are calculated using the full data set of each BSs
sector, respectively. If the mean values would be estimated
locally, it is equal to assuming that the parameters are locally
zero mean, and this is not what we are studying. What we
want to investigate is if one parameter is large (or small) given
the other.
ACKNOWLEDGMENTS
This work was sponsored partly within the Antenna Center
of Excellence (FP6-IST 508009), the WINNER project IST-
2003-507581, and wireless@KTH.
REFERENCES
[1] G. Foschini and M. J. Gans, “On limits of wireless communica-
tions in a fading environmen when using multiple antennas,”
Wireless Personal Communications, vol. 6, no. 3, pp. 311–335,
1998.
[2] I. E. Telatar, “Capacity of multi-antenna Gaussian channels,”
European Transactions on Telecommunications, vol. 10, no. 6,
pp. 585–595, 1999.
[3] D. S. Baum, H. El-Sallabi, T. J
¨
ams
¨
a, et al., “IST-WINNER D5.4,
final report on link and system level channel models,” http://
www.ist-winner.org/, October 2005.
[4] D. Chizhik, J. Ling, P. Wolniansky, R. Valenzuela, N. Costa,
and K. Huber, “Multiple-input-multiple-output measure-
ments and modeling in manhattan,” IEEE Journal on Selected
Areas in Communication, vol. 21, no. 3, pp. 321–331, 2003.
[5] V. Eiceg, H. Sampath, and S. Catreux-Erceg, “Dual-polariza-
tion versus single-polarization MIMO channel measurement
results and modeling,” IEEE Transactions on Wireless Commu-
nications, vol. 5, no. 1, pp. 28–33, 2006.
[6] P.Kyritsi,D.C.Cox,R.A.Valenzuela,andP.W.Wolniansky,
“Correlation analysis based on MIMO channel measurements
in an indoor environment,” IEEE Journal on Selected Areas in
Communications, vol. 21, no. 5, pp. 713–720, 2003.
12 EURASIP Journal on Wireless Communications and Networking
[7] M. Steinbauer, A. F. Molisch, and E. Bonek, “The double-
directional radio channel,” IEEE Antennas and Propagation
Magazine, vol. 43, no. 4, pp. 51–63, 2001.
[8] R. Stridh, K. Yu, B. Ottersten, and P. Karlsson, “MIMO chan-
nel capacity and modeling issues on a measured Indoor radio
channel at 5.8 GHz,” IEEE Transactions on Wireless Communi-
cations, vol. 4, no. 3, pp. 895–903, 2005.
[9] J. Wallace and M. Jensen, “Time-varying MIMO channels:
measurement, analysis, and modeling,” IEEE Transactions on
Antennas and Propagation, vol. 54, no. 11 ,part 1, pp. 3265–
3273, 2006.
[10] 3GPP-SCM, “Spatial channel model for multiple input
multiple output (MIMO) simulations,” TR.25.966 v.6.10,
September 2003.
[11] M. Gudmundson, “Correlation model for shadow fading in
mobile radio systems,” IEEE Electronics Letters, vol. 27, no. 23,
pp. 2145–2146, 1991.
[12] A.Algans,K.I.Pedersen,andE.P.Mogensen,“Experimental
analysis of the joint statistical properties of azimuth spread,
delay spread, and shadow fading,” IEEE Journal on Selected Ar-
eas in Communications, vol. 20, no. 3, pp. 523–531, 2002.
[13] V. Graziano, “Propagation correlation at 900MHz,” IEEE
Transactions on Vehicular Technology, vol. 27, no. 4, pp. 182–
189, 1978.
[14] J. Weitzen and T. J. Lowe, “Measurement of angular and dis-
tance correlation properties of log-normal shadowing at 1900
MHz and its application to design of PCS systems,” IEEE
Transactions on Vehicular Technology, vol. 51, no. 2, pp. 265–
273, 2002.
[15] A. Mawira, “Models for the spatial correlation functions of the
(log)-normal component of the variability of VHF/UHF field
strength in urban environment,” in Proceedings of the 3rd IEEE
International Symposium on Personal, Indoor and Mobile Ra-
dio Communications (PIMRC ’92), pp. 436–440, Boston, Mass,
USA, October 1992.
[16] K. Zayana and B. Guisnet, “Measurements and modelisation
of shadowing cross-correlationsbetween two base-stations,” in
IEEE International Conference on Universal Personal Commu-
nications (ICUPC ’98), vol. 1, pp. 101–105, Florence, Italy, Oc-
tober 1998.
[17] E. Perahia, D. C. Cox, and S. Ho, “Shadow fading cross cor-
relation between basestations,” in The 53rd IEEE Vehicular
Technology Conference (VTC ’01), vol. 1, pp. 313–317, Rhodes,
Greece, May 2001.
[18] H. W. Arnold, D. C. Cox, and R. R. Murray, “Macroscopic di-
versity performance measured in the 800-MHz portable radio
communications environment,” IEEE Transactions on Anten-
nas and Propagation, vol. 36, no. 2, pp. 277–281, 1988.
[19] T. Klingenbrunn and P. Mogensen, “Modelling cross-
correlated shadowing in network simulations,” in The 50th
Vehicular Technology Conference (VTC ’99), vol. 3, pp. 1407–
1411, Amsterdam, The Netherlands, September 1999.
[20] N. Jald
´
en, P. Zetterberg, M. Bengtsson, and B. Ottersten,
“Analysis of multi-cell MIMO measurements in an urban
macrocell environment,” in General Assembly of International
UnionofRadioScience(URSI’05), New Delhi, India, October
2005.
[21] L. Garcia, N. Jald
´
en, B. Lindmark, P. Zetterberg, and L. D.
Haro, “Measurements of MIMO capacity at 1800MHz with in-
and outdoor transmitter locations,” in Proceedings of the Eu-
ropean Conference on Antennas and Propagation (EuCAP ’06),
Nice, France, November 2006.
[22] L. Garcia, N. Jaldin, B. Lindmark, P. Zetterberg, and L. D.
Haro, “Measurements of MIMO indoor channels at 1800MHz
with multiple indoor and outdoor base stations,” EURASIP
Journal on Wireless Communication and Networking, vol. 2007,
Article ID 28073, 10 pages, 2007.
[23] P. Zetterberg, “WIreless DEvelopment LABoratory (WIDE-
LAB) equipment base,” Signal Sensors and Systems (KTH), iR-
SB-IR-0316, August 2003.
[24] />[25]P.Zetterberg,N.Jald
´
en, K. Yu, and M. Bengtsson, “Analysis
of MIMO multi-cell correlations and other propagation issues
based on urban measurements,” in Proceedings of the 14th IST
Mobile and Wireless Communications Summit,Dresden,Ger-
many, June 2005.
[26] T. Rappaport, Wireless Communications: Principles and Prac-
tice, Prentice-Hall, Upper Saddle River, NJ, USA, 1996.
[27] T. Trump and B. Ottersten, “Estimation of nominal direction
of arrival and angular spread using an array of sensors,” Signal
Processing, vol. 50, no. 1-2, pp. 57–69, 1996.
[28] M. Bengtsson and B. Ottersten, “Low-complexity estimators
for distributed sources,” IEEE Transactions on Signal Process-
ing, vol. 48, no. 8, pp. 2185–2194, 2000.
[29] M. Tapio, “Direction and spread estimation of spatially dis-
tributed signals via the power azimuth spectrum,” in Pro-
ceedings of IEEE International Conference on Acoustics, Speech,
and Signal Processing (ICASSP ’02), vol. 3, pp. 3005–3008, Or-
lando, Fla, USA, May 2002.
[30] K. I. Pedersen, P. E. Mogensen, and B. H. Fleury, “A stochas-
tic model of the temporal and azimuthal dispersion seen at
the base station in outdoor propagation environments,” IEEE
Transactions on Vehicular Technology, vol. 49, no. 2, pp. 437–
447, 2000.
[31] N. Jald
´
en, “Analysis of radio channel measurements using
multiple base stations,” Licenciate Thesis, Royal Institute of
Technology, Stockholm, Sweden, May 2007.