Báo cáo hóa học: " Research Article A Markovian Model Representation of Individual Mobility Scenarios in Ad Hoc Networks and Its Evaluation" ppt
Bạn đang xem bản rút gọn của tài liệu. Xem và tải ngay bản đầy đủ của tài liệu tại đây (980.63 KB, 14 trang )
Hindawi Publishing Corporation
EURASIP Journal on Wireless Communications and Networking
Volume 2007, Article ID 35946, 14 pages
doi:10.1155/2007/35946
Research Article
A Markovian Model Representation of Individual Mobility
Scenarios in Ad Hoc Networks and Its Evaluation
C. A. V. Campos and L. F. M. de Moraes
High-Speed Networks Laboratory, RAVEL COPPE/Federal University of Rio de Janeiro (UFRJ), RJ, Brazil
Received 15 July 2006; Revised 27 January 2007; Accepted 30 January 2007
Recommended by Marco Conti
Adequate representation of mobility is a very important issue in simulation of mobile ad hoc networks. In this context, we consider
the characterization of the mobile nodes movement through a Markovian modeling. Our proposed representation allows for
smooth movements and the generation of several different mobility profiles. This approach is also shown to be more suitable
for use in various ad hoc networks scenarios than other proposed mobility models, such as the random waypoint (RWP) model.
An evaluation of the proposed model is provided, under different border rule scenarios. In addition, the performance of AODV,
DSR, and DSDV routing protocols is also studied through simulations, utilizing the proposed model, and the results obtained are
discussed.
Copyright © 2007 C. A. V. Campos and L. F. M. de Moraes. This is an open access article distributed under the Creative Commons
Attribution License, which permits unrestricted use, distribution, and reproduction in any medium, provided the original work is
properly cited.
1. INTRODUCTION
Mobile ad hoc networks (MANETs) are wireless networks
that do not need an infrastruc ture to be set up for communi-
cation and data distribution. Thus, a sender node can either
forward data directly to the destination device when it is close
enough, or through intermediate devices when the destina-
tion is out of reach in a single hop. In this context, all the
wireless mobile nodes (MNs) must have the capacity to for-
ward data acting as routers. However, in these networks, u ser
mobility adds problems that should be addressed, mainly
due to the dynamism of the network topology, diminishing
communication link lifetime. As a consequence of this dy-
namic behavior, the performance of proposed solutions (ap-
plications and subsystems) from MANETs is directly affected,
forcing researchers to take mobility into account when evalu-
ating developed algorithms and protocols for such networks.
In spite of the huge amount of work and research dedi-
cated to ad hoc networks in the last years, several problems
and challenges remain open. For example, since MANETs
are still in a development stage, it is quite difficult to ob-
tain mobility traces from real scenarios. As a consequence,
the use of synthetic mobility models, that tr y to represent
the MNs movement behavior becomes necessary in order to
simulate user mobility profiles. Several mobility models have
been proposed in the past few years, but they present some
problems, such as mean speed decay with time and sudden
changes in movement direction and speed.
In the present work, a detailed study of the motion be-
havior of MNs and its impact on the routing protocol per-
formance for MANETs are presented.
The rest of this paper is outlined as follows. In Section 2,
we describe the main published works about mobility mod-
els available for MANETs. Our proposed Markovian model-
ing and the characterization of different mobility profiles al-
lowedbyitarepresentedinSection 3. Section 4 presents an
analysis for the impact of border rules on the proposed mo-
bility model. In Section 5, we present the performance eval-
uation for AODV, DSR, and DSDV routing protocols, which
result from simulations using the proposed mobility model.
Finally, Section 6 concludes the paper, highlighting the main
contributions of our work, and proposing some directions
for future research.
2. MOBILITY IN MANETs
As mentioned before, mobility models are used to repre-
sent the mobility patterns of an MN. These models are used
in performance evaluations of applications and communica-
tion systems, allowing analysis of the impact caused by mo-
bility on their functioning. Mobility models can be applied
in many studied environments, such as the management of
2 EURASIP Journal on Wireless Communications and Networking
7006005004003002001000
X (m)
0
50
100
150
200
250
300
350
400
450
500
Y (m)
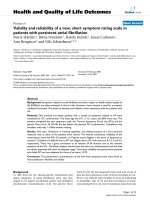
Figure 1: Course taken by one MN using the RWP model.
cryptographic key distribution, packet-loss ev aluation, traf-
fic management, performance evaluation of routing proto-
cols [1, 2], partition prediction, service discovery in par-
titionable networks [3], and medium access protocols for
MANETs, among others.
These models can be further classified in two categories:
Individual mobility models (IMM) and group mobility mod-
els (GMM). Thus, these categories and mobility related to
previous works are described below.
2.1. Individual mobility models
IMMs represent the movement pattern of an MN indepen-
dent of other MNs in the neighborhood, and are the most
used models in performance evaluation of MANETs [1]. In
thissection,someIMMswillbebrieflydescribed.
One of the most used mobility models in MANET simu-
lation is the random walk mobility model [4]. In this model,
the movement direction and speed at some time t + Δt has
no relationship with the direction and speed at time t. This
characteristic makes this model memoryless, and generates a
nonrealistic movement for each MN, presenting sharp turns,
sudden stops, and accelerations. Some other models based
on the random walk mobility model have also been proposed
[5, 6].
The random waypoint (RWP) model, described in [7],
divides the course taken by the MN into two periods, the
movement period and the pause period. The MN stays at
some place for a random amount of time (pause time)and
then moves to a new place chosen randomly with a speed
that follows an exponential distribution between [minspeed,
maxspeed], as shown in Figure 1. Nowadays, this is the most
widely used model. This model is also memoryless, and has
the same drawbacks of the random mobility model. In [8–
11], studies about the har mful behavior of RWP model are
presented, mainly about the nonstationarity behavior. Thus,
this model presents undesirable characteristics and that must
be taken in consideration in the MANETs simulations.
0.70.7
0.5
0.3
0.5
0.3
(1)
X
= X − 1
(0)
X
= X
(2)
X
= X +1
0.70.7
0.5
0.3
0.5
0.3
(1)
Y
= Y − 1
(0)
Y
= Y
(2)
Y
= Y +1
X
:nextX coordinate
Y
:nextY coordinate
X:currentX coordinate
Y:currentY coordinate
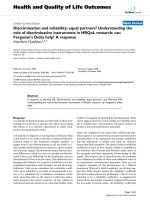
Figure 2: MRP model.
The markovian random path (MRP) is a probability
model proposed by Chiang in [12], which explores a less sud-
den movement by the nodes. This probability model is con-
trolled by a three-state Markov chain to represent the move-
ment behavior in directions x and y on the plane. One should
notice that the states of the MCs (for each direction, x and y)
in this case represent the position variation and not the X
and Y position themselves. Therefore, as shown by Figure 2,
the state-transition diagrams of X-direction and Y-direction
will represent the direction changes of the MN. Initially, both
X-direction and Y-direction are on state E
0
; in the next step,
going from E
0
to E
2
represents an increase in the respective
coordinate (x,ory), and a transition to E
1
will denote a de-
crease in the respective coordinate (again, x,ory).
In other words, the Markov chains states (0, 1, and 2)
control the movement behavior of MNs, instead of directly
representing their positions. The reader should refer to [12]
for additional details about this mobility model.
In this model, movements in the horizontal and vertical
directions as well as stops are not possible for an interval of
time greater than one step. Besides that, once the MN starts
to move it is likely to remain in the same direction, because
the probability to stay in state (1) or (2) of the Markov chain
is greater than the probability to go back to state (0). An-
other property of this model is that it does not allow sudden
changes in the movement direction. This is because there are
no step transitions between states (1) and (2), that is, before
changing direction the MN first has to stop.
Additional models for individual mobility have been pro-
posed in the literature. The work in [13] introduced a dis-
cretized version of a Gauss-Markov process to model the
MNs velocity in one dimension (a multidimensional exten-
sionispresentedin[14]). The latter exploits the predictabil-
ity of user mobility patterns, therefore being more realis-
tic than random-walk or constant-velocity models. In this
sense, the Markovian model presented by us is somehow re-
lated to that in [13]. However, we further emphasize that, in
spite of being related to the work in [13], the Markov chain
C.A.V.CamposandL.F.M.deMoraes 3
model presented here is different. As in [12], the states of the
Mark ov chain here are used to represent changes in motion.
In [1] it is presented a boundless simulation area model. The
city section model is proposed in [1] and tries to represent
the movement of an MN in urban environments. In [15],
a smooth model, which represents motion smoother than in
random walk and waypoint models, is proposed. A more re-
alistic model where obstacles in the scenario are taken into
consideration is proposed in [8].
2.2. Group mobility models
Group mobility models are used to represent the movement
of a group of MNs. These models have recently been used
to predict the partitioning of MANETs, which is defined as
a wide-scale topology change, caused mainly by the group
movement behavior of the MNs.
A group mobility model developed by Hong et al. in [16]
is the group point reference mobility (GPRM) model. For
each MN there is an associated reference point which states
the group movement. The MNs are initially placed randomly
around the reference point within a geographical area. Each
reference point has a group movement vector, which is added
to the random movement vector of each MN to determine
the next position of the respective MN. The GPRM model
defines the g roup movement explicitly, determining a move-
ment path for each group.
2.3. Frameworks for mobility models
Recently, researchers have been seeking to represent mobility,
not only through mobility model development, but through
synthetic environment representations and user movement
analysis in possible MANET scenarios.
In [15], a conceptual map of mobility representation
used in the simulation and analysis of wireless systems is pre-
sented. This representation is performed through the com-
ponents: randomness level (deterministic, hybrid, or ran-
dom), detailing level (micromobility, macromobility, indi-
vidual, and group movements), simulation or analytical rep-
resentation, and representation dimensions (1D, 2D, or 3D).
Moreover, in the random approach, several border rules are
used to choose new movement directions. This representa-
tion can be applied in both infrastructureless and infrastruc-
tured wireless networks. Such proposal characterizes mobil-
ity in an interesting and comprising way; however, evaluation
metrics of mobility or conceptual map components are not
defined. This limits simulation evaluations that follow this
modeling. It is important to notice that this was a first at-
tempt of mobility representation through a framework for
MANETs.
Important is a framework proposed in [17], to systemat-
ically analyze the mobility impact on the performance of the
routing protocols for MANETs. For this, mobility and con-
nectivity graph metrics were proposed, independently of the
protocols. The frameworks comprise the following aspects:
mobility models, metrics for the mobility and connectivity
graph characterization, and the relationship between mobil-
ity and the routing performance.
This framework has the following contributions:
(i) focuses on the mobility characteristics, such as spa-
tial dependence, geographical restric tions and tempo-
ral dependence;
(ii) definitions of metrics of the connectivity graphs,
studying the interaction of mobility metrics with the
connectivity metrics and its effects on the protocols’
performance;
(iii) analyses of the reasons for the differences in the proto-
col performance as a whole, through the investigation
of the mobility of the parts that compose the protocol
effect.
This framework is a great contribution to mobility model
evaluation, aiming at the level of realism of the models for the
simulation of mobility in MANETs. Therefore, the proposed
metrics to evaluate the movement behavior and the network
topology are totally independent from the protocols, which
allow a mobility model behavior evaluation. The proposed
metrics in [17], provided new insights in the performance
evaluation of the routing protocols.
3. PROPOSAL OF AN ALTERNATIVE MODELING FOR
INDIVIDUAL MOBILITY
As presented in Section 2, user movement representation is
important and necessary for a preliminary analysis of the ap-
plication behavior used in MANETs. This representation al-
lows a detailed and in-depth study of these networks, even
without a real world implementation.
As in [18], a Markov chain model is used in this paper.
In addition, the proposed modeling can be characterized by
Bettstetter’s framework [15], where a random approach for
the direction and speed change was applied with probabilis-
tic values distributed nonuniformly. Modeling can represent
several dimensions; however, as a framework detailing level
it can represent only individual movements. In the direction
choice, all the border rules of the framework can be used.
The proposed models are based on [12] and Markovian
processes [18], and will b e detailed in the following subsec-
tions.
3.1. Simple individual Markovian mobility model
As described in Section 2 , the MRP model tries to describe
the movement with a more adequate behavior than the ran-
dom walk and RWP models. However, in accordance with
the description given in Section 2.1, we notice that the MRP
model does not al low the following: (i) vertical or horizontal
movements; (ii) pause durations of two or more consecutive
time intervals (in other words, pauses, whenever they occur,
can last at most one time interval); and (iii) smooth changes
of speed.
In this way, an extension of the MRP model is proposed
supporting such characteristics. This extension is denomi-
nated simple individual markovian mobility (SIMM) model.
In the next sections, analytical modeling and mobility profile
generation will be addressed.
4 EURASIP Journal on Wireless Communications and Networking
1 −q 1 −q
1
− 2p
(1) (0) (2)
q
pq
p
Figure 3: State transition diagram for the Markov chains represent-
ing movement in the SIMM model (for both x-andy-directions).
3.1.1. Analytical modeling
The SIMM model uses two Markov chains with discrete pa-
rameters and 3 states (0, 1, and 2), to represent movements
in the x-andy-coordinate, with changes in coordinates x
and y assumed to be independent. Figure 3 illustrates the
state transition diagram for the above-mentioned chains (the
same for both x-andy-coordinate). As noted, the transition
probabilities from state (0) to the other states a re defined by
p; on the other end, the transition probabilities from both
states (1) and (2), to state (0), are defined as q.
Figure 3 illustrates the SIMM model state transition dia-
gram. As it can be observed, this model presents a new char-
acteristic which is to allow transitions from state (0) to it-
self, with probability (1
− 2p), thus assuming that MNs can
remain in that state for one or more consecutive steps. The
model allows every MN to remain still, that is, x and y re-
main the same in one or more instants of time. However, the
permanence in states (1) or (2) is given by the probability
(1
− q).
Considering the extensions to MRP mentioned in the
previous paragraph, the SIMM model assumes that the
discrete-parameter Markov chains representing the shift in
directions x and y allow tr ansitions to take place from state
(0) to itself. Also, instead of representing the changes in each
direction by individual Markov chains, as shown in Figure 2,
the SIMM model utilizes a two-dimension state vector (i, j);
with i, j
∈{0, 1, 2}. Therefore, the analytical model for
SIMM utilizes a vector Markov chain with state space given
by S
={0,1, 2}×{0, 1, 2}, where each of the components,
i and j, are used to describe the shifts in directions x and y,
respectively. In addition, with respect to the motion in each
direction, the SIMM model generalizes the assumption made
by the MRP model by allowing the shift in position (in either
direction, x and/or y)totakeanabsolutevalueequaltoD
units (where D is an integer > 1). Thus, the SIMM model is
seen to generalize the MRP model. We note that, in the par-
ticular case of the SIMM model when D
= 1, and transitions
from the vector state (0, 0) to either state (0, j)or(i,0) with
i, j
∈ S, and vice-versa, are not allowed; so, it will represent
the same behavior as in the MRP model. Looking at the state
transition diag ram shown in Figure 4, we emphasize that the
states are given by the vector (i, j), with i, j
∈ S.
We defi ne P
SIMM
as the one-step, stationary transi-
tion probabilities matrix associated to the (homogeneous)
Table 1: Possible motion representation of state (0, 0) g iven by
state-transitions of the SIMM model.
Transi tions from → to Motion representation
(0, 0) −→ (0, 0) X
= X; Y
= Y;
(0, 0)
−→ (2, 0) X
= X + D; Y
= Y;
(0, 0)
−→ (0, 2) X
= X; Y
= Y + D;
(0, 0)
−→ (1, 0) X
= X −D; Y
= Y;
(0, 0)
−→ (0, 1) X
= X; Y
= Y − D;
(0, 0)
−→ (2, 2) X
= X + D; Y
= Y + D;
(0, 0)
−→ (1, 1) X
= X −D; Y
= Y − D;
(0, 0)
−→ (1, 2) X
= X −D; Y
= Y + D;
(0, 0)
−→ (2, 1) X
= X + D; Y
= Y − D;
Table 2: Possible motion representation of state (2, 0) g iven by
state-transitions of the SIMM model.
Tra nsi tio ns from → to Motion representation
(2, 0) −→ (2, 0) X
= X + D; Y
= Y;
(2, 0)
−→ (2, 1) X
= X + D; Y
= Y − D;
(2, 0)
−→ (0, 0) X
= X; Y
= Y;
(2, 0)
−→ (2, 2) X
= X + D; Y
= Y + D;
(2, 0)
−→ (0, 2) X
= X; Y
= Y + D;
(2, 0)
−→ (0, 1) X
= X; Y
= Y − D;
Markov chain representing the SIMM model,
P
SIMM
=
⎡
⎢
⎢
⎢
⎢
⎢
⎢
⎢
⎢
⎢
⎢
⎢
⎢
⎢
⎢
⎣
A
2
Ap Ap Ap Ap p
2
p
2
p
2
p
2
Aq AB 0 pq pq Cp 0 Cp 0
Aq 0 AB pq pq 0 Cp 0 Cp
Aq pq pq AB 0 Cp Cp 00
Aq pq pq 0 AB 00Cp Cp
q
2
Bq 0 Bq 0 B
2
000
q
2
0 Bq Bq 00B
2
00
q
2
Bq 00Bq 00B
2
0
q
2
0 Bq 0 Bq 000B
2
⎤
⎥
⎥
⎥
⎥
⎥
⎥
⎥
⎥
⎥
⎥
⎥
⎥
⎥
⎥
⎦
,
(1)
where A
= (1 −2p), B = (1 − p), and C = (1 − q).
Starting at position X, Y, which in the state diagram is
given by (0, 0) of the Markov chain, the transitions illustrated
represent, respectively, the motion representation given in
Table 1.
Given that the MN has been for the state (2, 0) the pos-
sible transitions are shown with the respective motion repre-
sentations described in Ta bl e 2.
Assuming that the MN is in the state (2, 2), Table 3 shows
the possible motion representations.
According to this characteristic, the SIMM model can
represent movements with just three velocity values
{0, D,
D
√
2} m/s or Km/h. Thus it is indicated for scenarios of
small velocity variations, such as WLAN, bluetooth, and sen-
sor network applications with restricted mobility.
C.A.V.CamposandL.F.M.deMoraes 5
pq
pq
pq
pq
(1
− q)
2
(1
− q)
2
(1
− 2 p)(1 − q)
(1
− q)q
(1
− q)p
(1
− q)p
(1
− q)q
q
2
q
2
p
2
p
2
(1 − q)p
(1
− q)q
(1
− 2 p)p
(1
− q)p
(1
− q)q
(1 − 2p)q
(1
− 2p)q
(1
− 2 p)q
(1
− 2p)
2
(1
− 2p) p
(1
− 2p) p
(1
− 2 p)(1 − q)
(1
− 2p)(1 −q)
(1 − q)q
(1
− q)p
(1
− 2p)q
(1
− 2p) p
(1
− q)q
(1
− q)p
q
2
q
2
p
2
p
2
(1
− q)p
(1
− q)q
(1
− q)p
(1
− q)q
(1
− q)
2
(1
− q)
2
pq
pq
pq
pq
(1
− 2p)(1 −q)
(1, 2) (0, 2) (2, 2)
(1, 0) (0, 0) (2, 0)
(1, 1) (0, 1) (2, 1)
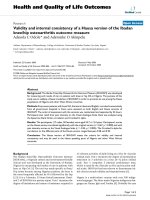
Figure 4: Example of state-transition diagram for the SIMM model—the components i and j (of the two-dimension vector states (i, j))
describe the shifts made by the mobile node (MN) in directions x and y,respectively.
Table 3: Possible motion representation of state (2, 0) given by
state-transitions of the SIMM model.
Tra nsi tio ns from → to Motion representation
(2, 2) −→ (2, 2) X
= X + D; Y
= Y + D;
(2, 2)
−→ (0, 2) X
= X; Y
= Y + D;
(2, 2)
−→ (0, 0) X
= X; Y
= Y;
(2, 2)
−→ (2, 0) X
= X + D; Y
= Y;
From P
SIMM
matrix and in Figure 4 the following charac-
teristics in the SIMM model can be observed.
(1) The probability that an MN remains stopped at a point
in time is g iven by (1
−2p)
2
.Ifp has a large value, this
model will allow very few stops.
(2) The probability that an MN remains moving in the
same (vertical and horizontal) direction is given by
(1
−2p)(1−q)ifp has a very few moves in these direc-
tions. Besides that, as q increases, fewer will be moved
into these directions.
(3) The probability that a MN remains moving in the same
(diagonal) direction is given by (1
− q)
2
. This way, the
less is the value of q, the greater will be to move into
this direction.
As it was described in the characteristics above, varying
p and q probabilities values, between [0, 0.5], a behavior va-
riety is generated by SIMM model, characterizing it so, as a
reconfigurable and adaptive model to specific situations. To
this degree, this model will allow the generation of the sev-
eral nodes mobility profiles in a network. These profiles will
be detailed in the following section.
3.1.2. Mobility profiles
A mobility profile can be defined as being a subgroup of
values attributed to each characteristics, correlating them
within MN movement following a mobility model in a spe-
cific simulation area. Thus, each mobility profile represents a
specific movement behavior.
As characteristics of movement of an MN, these are ve-
locity variation, direction change behavior, stop number in
movement, pause time, and MN motion dependence inter-
val with other members of network. Varying the value of each
characteristic, it is possible to attain a specific mobility pro-
file.
Likewise, the utilization of the transition probability dif-
ferent matrix permits the generation of several mobility pro-
files. It is only necessary to attribute different values for the p
and q parameters, which will allow specific mobility profiles,
as some shown below. Furthermore, on the mobility profile
generation the D parameter define the size of the increment
in the displacement of the MN in the time. This displacement
of the MN in the time gives the MN speed. In this context,
if the D parametertobeequalto1andtransitionbetween
the states duration time equal to 1 second, it will produce a
displacement of 1 m or 1.41 m per second. As described in
Section 3.1.1, the D parameter can be changed. In what fol-
lows the SIMM model is used to exemplify the description of
different mobility profiles.
SIMMa mobility profile
The SIMMa mobility profile is defined by adjustment of p
and q parameters as 0.4 and 0.3, respectively. Thus, P
xy
ma-
trix transforms itself into the P
a
matrix, shown below.
6 EURASIP Journal on Wireless Communications and Networking
300250200150100
X (m)
200
250
300
350
400
450
Y (m)
Figure 5: Course of two MNs using the SIMMa profile.
From P
a
, following characteristics from SIMMa profile
can be observed: rare pauses on the movement, small verti-
cal or horizontal movement, and large movement in diago-
nal directions. This profile can represent the people move-
ment in irregular areas with very rare pauses, as illustrated in
Figure 5:
P
a
=
⎡
⎢
⎢
⎢
⎢
⎢
⎢
⎢
⎢
⎢
⎢
⎢
⎢
⎢
⎢
⎢
⎣
0.04 0.08 0.08 0.08 0.08 0.16 0.16 0.16 0.16
0.06 0.14 0 0.12 0.12 0.2800.28 0
0.06 0 0.14 0.12 0.12 0 0.28 0 0.28
0.06 0.12 0.12 0.14 0 0.28 0.28 0 0
0.06 0.12 0.1200.14 0 0 0.28 0.28
0.09 0.21 0 0.21 0 0.49 0 0 0
0.09 0 0.21 0.21 0 0 0.49 0 0
0.09 0.21 0 0 0.21 0 0 0.49 0
0.09 0 0
.2100.21 0 0 0 0.49
⎤
⎥
⎥
⎥
⎥
⎥
⎥
⎥
⎥
⎥
⎥
⎥
⎥
⎥
⎥
⎥
⎦
.
(2)
SIMMb mobility profile
SIMMb mobility profile is defined by p
= 0.4andq = 0.15.
From these values, the following characteristics from SIMMb
profile can be observed in Figure 6: rare pauses in the move-
ment, small movement in the vertical and horizontal direc-
tions, and a very large movement in the diagonal directions.
SIMMc mobility profile
SIMMc mobility profile is defined by p
= 0.05 and q = 0.2.
From these values, the following SIMMc profile characteris-
tics are made evident: various pauses with a high possibility
of remaining still in consecutive time instants, furthermore,
there is a frequent motion in all directions. However, as can
be seen in Figure 7, the movement is very curvelinious, ir-
regular, and with many pauses, characterizing a small dis-
placement during the simulation time. This profile can rep-
resent disaster situations, where MNs have irregular move-
ments and remain still for long periods of t ime.
800700600500400300200
X (m)
0
50
100
150
200
250
300
350
400
450
500
Y (m)
Figure 6: Course of the MN following the SIMMb profile.
7006005004003002001000
X (m)
0
50
100
150
200
250
300
350
400
450
500
Y (m)
Figure 7: Courses of the various MNs using the SIMMc profile.
SIMMd mobility profile
SIMMd mobility profile is defined by p
= 0.05 and q = 0.05.
From these values, the following characteristics can be ob-
served: rare pauses due to transition to state being equal to
0.05; however, with large possibilities of remaining still for
a long time. Moreover, there is a high dynamism in all di-
rections, mainly in the diagonals, characterizing rectilinear
movements like in some urban regions. This behavior can be
seen in Figure 8.
As it was presented in Section 3.1.1, the SIMM model al-
lows vertical and horizontal movements, as well as pauses in
the movements during one or more time intervals. In addi-
tion, with adjustments of fine parameters, the model gener-
ates various mobility scenarios, a s described in Section 3.1.2.
Nevertheless, the SIMM model does not allow velocity vari-
ations in the same direction. Therefore, a generic model will
be presented in the next section.
C.A.V.CamposandL.F.M.deMoraes 7
7006005004003002001000
X (m)
0
50
100
150
200
250
300
350
400
450
500
Y (m)
Figure 8: Course of various MNs using the SIMMd profile.
3.2. Generic individual mobility
Markovian model
In most scenarios w here MANETs are used, MNs move
changing their speeds. In order to represent different mobil-
ity patterns in a more realistic way, we propose next a generic
Markovian model which is able to support a broader range
of possibilities concerning speed variations; this is going to
be called the generic individual markovian mobility (GIMM)
model. In the latter, the absolute value of the position incre-
ments can be a real number in the interval [1, Δ
max
]. By al-
lowing the increments in position to assume absolute values
in this more general interval, a broader range of sp eeds, cor-
responding to MNs moves, from a current position, X, to the
next position, X
,canberepresented.
As for the SIMM model (see Section 3.1.1), the GIMM
modelisalsobasedontwodiscreteparameterMarkovchains
to represent the movements in the x and y directions, with
changes in coordinates x and y assumed to be independent.
However, as a consequence of the broader range of values
that can be assumed by changes in MNs position (in each
direction), the state space of those chains are now going to
be given by S
={−e, −e +1, , −1, 0, 1, , e − 1, e}.Here,
the states k/
= 0 correspond to changes from current posi-
tion X (or Y) to next position X
(or Y
); and state k = 0
represents no change in the corresponding coordinate (i.e.,
X
= X
and/or Y = Y
).
Moreover, in the definition above, the state represented
by e corresponds to the absolute value of the maximum
change in position allowed in a single move of an MN (in
each direction, x or y). Therefore, considering the fact that
the absolute value of position increments are in the inter-
val [1, Δ
max
], the states (e)and(−e) must correspond to
amovefromcurrentpositionX (or Y ) to next position
X
= X ± Δ
max
(or Y
= Y ±Δ
max
).
We further emphasize that the states of the Markov
chains defined above represent changes in positions (for each
coordinate, x and y), and not the positions themselves.
For this model, the absolute value of the velocity varia-
tion is given by a truncated geometric random variable dis-
tributed between 1 and b
e−1
,whereb>1andb ∈ R is the
base of the number representing the increments in positions
(X
→ X
,orY → Y
).
Therefore, by the definitions given above, we have
Δ
max
= b
e−1
for e>0. (3)
Thus, the correspondence of the states in the Markov
chains (for directions x and y) with the changes in positions
(see Figure 9) allow the next position of an MN to be ob-
tained as follows:
X
= X + s · b
α
for 0 ≤ α ≤ e − 1;
Y
= Y + s ·b
α
for 0 ≤ α ≤ e − 1.
(4)
In the above, s
∈{−1, 0, 1} is used to represent the mo-
tion direction (
−1 for opposite way, 0 for unchanged posi-
tion, and 1 for the same way) and the parameter α is an inte-
ger number in the interval [0, e
− 1].
In order to compute the transition probabilities for the
state transition diagram in Figure 9, we are going to define
p
k, j
as being the probability of going to state (j) on the next
interval, given that we are currently at state (k).
In what following, we summarize the steps to get transi-
tions probabilities for the Markov chain in Figure 9.
Looking to each state of the chain in Figure 9,exceptfor
states (e)and(
−e), we have the following.
(i) m is the sum value of all tr a nsition probabilities to any
state at the right-hand side of the current state, given
the rules of the state transition diagram for the Markov
chain in this Figure. This sum is given by a finite geo-
metric series with ratio 1/2. This value is defined in (5)
for state (0) and also for positive states; and in (6)for
negative states.
(ii) The sum of all transition probabilities to any state at
the left-hand side of the current state is also equal to
m, given the rules of the state transition diagram as
shown in Figure 9. This value is defined in (7) for state
(0) and also for negative states; and in (8)forpositive
states.
(iii) To stay at current state the value is equal to (1
− 2m),
as defined in (9):
e
j=k+1
p
k, j
= m for 0 ≤ k<e,
(5)
0
j=k+1
p
k, j
= m for − e ≤ k<0,
(6)
−e
j=k−1
p
k, j
= m for − e<k≤ 0,
(7)
0
j=k−1
p
k, j
= m for 0 <k≤ e,
(8)
p
k,k
= 1 −2m for − e<k<e.
(9)
8 EURASIP Journal on Wireless Communications and Networking
p
−e,−e
p
−e,0
p
−e,−2
p
−e,−e+1
p
−e+1,−e
p
−2,−1
p
−1,−2
p
−1,−e
p
0,−e
p
0,−2
p
−2,0
p
−1,−1
p
−1,0
p
0,−1
p
0,0
p
0,e
p
0,1
p
1,0
p
2,0
p
0,2
p
1,1
p
1,2
p
2,1
p
e,0
p
1,e
p
e,1
p
e−1,e
p
e,e−1
p
e,e
(−e)(−1) (0) (1) (e)
Figure 9: State transition diagram for the Markov chains representing movement in the GIMM model (for both x-andy-directions).
500450400350300250200
X (m)
160
180
200
220
240
260
280
300
Y (m)
Figure 10: Course of MN using GIMMa profile.
Unlike the other states, (−e)and(e) are the Markov chain
edgesasshowninFigure 9. The state (
−e) only has transi-
tion to other states at its right-hand side until the state (0),
in which the sum of all possible probability values is equal to
m,asdefinedin(6), or to itself, with the probability value of
1
−m,asdefinedin(10). In a symmetrical way, state (e), only
has possible transition to other states at its left-hand side, in
which the sum of all possible probability values until the state
(0) is also equal to m,asdefinedin(7), or to itself, with the
probability value of 1
− m, as defined:
p
e,e
= p
−e,−e
= 1 −m. (10)
In addition, from the model assumptions and (5)–(8), we
note the following:
p
k, j
=
m2
(k−j)
1 − 2
(k−e)
,with(0≤ k<e, k<j≤ e)
or (
−e<k≤ 0, −e ≤ j<k);
p
k, j
=
m2
(k−j)
1 − 2
(−k)
,with(−e ≤ k<0, k<j≤ 0)
or (0 <k
≤ e,0≤ j<k).
(11)
(i) Velocity increases exponentially until Δ
max
value.
(ii) Once in state (k
→ positive), it is not possible to change
to a state (k
→ negative) without passing through state
(0) and vice versa. With this, the GIMM model avoids
sharp tur ns.
Moreover, the GIMM model can still represent patterns
that only increment the position by one (like the SIMM
model), and also increment the position by arbitrary values
within [1, Δ
max
] (for the coordinates x and y). This way, the
GIMM model is generic, allowing the representation of many
movement patterns.
3.2.1. Mobility profiles
As defined in Section 3.1.2, mobility profile is characterized
by a sub-g roup which has values attributed by the model pa-
rameters. This way, each GIMM model profile represents a
specific movement behavior.
To generate different mobility profiles, it is necessary to
attribute different values to m, n,andb values, as shown be-
low.
GIMMa mobility profile
The GIMMa profile is defined by the m, e,andb parameter
adjustment in the following way: 0.4; 4, and 2, respectively.
Therefore, Figure 10 illustrates the behavior of an MN fol-
lowing the GIMMa profile. As the e parameter is equal to
4, this profile reaches its maximum speed of approximately
40 km/h, allowing to represent the displacement of vehicles
in a city.
Several other mobility profiles can be represented using
the GIMM model, but because of lack of space, only GIMMa
was described.
As presented, the GIMM model has the capacity of rep-
resenting not only patterns with only one increment in the
x and y coordinates (e.g., the SIMM model), but also with
several increment values in these coordinates, with a smooth
variation in this increment. This smoothness is given by the
careful adjustment of the transition probabilities between
chain states. In other words, it could be said that modeling
allows a careful velocity variation, which is an adequate char-
acteristic to represent user . Furthermore, the GIMM model
is generic, allowing various pattern representation in user .
An evaluation of presented modeling was described in
[19], showing that not only the SIMM model, but also the
GIMM model is more adequate and possesses a behavior that
is closer to reality than the RWP model. Thus, as proposed
models are reconfigurable, these possess a very large appli-
cability potential, needing only to make a fine adjustment of
C.A.V.CamposandL.F.M.deMoraes 9
β
β
(a)
α
α
(b)
α
α
(c)
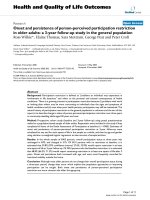
Figure 11: Types of border rules.
their parameters in accordance with characteristics of each
profile to be represented.
4. BORDER RULES APPLIED TO THE PROPOSED
MODELING
In the literature, there are several border rules [15]. The main
rules will be described below : bounce, delete and replace, and
wrap around.
4.1. Bounce
Thebounceborderrule,presentedin[15, 20], is defined as
being a reflection of the MN movement on the simulation
area border, obliging the new course of the MN to remain
within the simulation area. This new movement is character-
ized by two components, β direction angle and s speed, as
seen in Figure 11(a). The new value for β
angle will be −β in
the borders and value of s will remain the same.
There are some extensions of this rule, as presented in
[15, 20], in which the new β value is distributed uniformly
between [0, 180
◦
], in the superior, inferior, and lateral bor-
ders and [0, 90
◦
] in the simulation area corners. The value of
s also follows a uniform distribution between [s min, s max].
4.2. Delete and replace
This rule to represent a scenario where the MNs can cross
the area border, as it can be seen in many real situations (ve-
hicle movement in hig hway, entrances, a nd exits of people in
a room). It is defined by this rule that when an MN reaches
the border, it is removed from the simulation area and in-
serted again, randomly inside the simulated area, with a new
direction angle α
, which can be seen in Figure 11(b).
This rule has the charac teristic of representing the exit of
the MN from the simulation area, which sometimes is a re-
alistic characteristic. This rule, however, has an undesirable
characteristic that is placing of same MN randomly in any
position in the area, to avoid that the scenario remains with-
out MNs dur ing the simulation.
4.3. Wrap around
This rule uses the reflection mechanism from the MN move-
ment in the opposite border the frontier. This movement
reflection preserves the same α angle and s speed from the
MN in the movement reaching the border, as illustrated in
Figure 11(c).
With the aim of evaluating the impact from border rules
on the GIMM model, Figure 12 shows sharp turn the num-
ber of each node with the direction change angle 90
◦
.
For this, the same simulation environment configuration de-
scribed in [19] and sharp direction turn metric defined as
being sharp when the movement direction change angle is in
the interval [90
◦
, 180
◦
]. This metric indicates if the turns in
direction are smooth or not, because a user usually changes
direction with an angle of 90
◦
maximum. So, a change in
an angle bigger than 90
◦
is considered sharp. This evaluation
was not made in the RWP because the border rule insertion
would modify its basic functioning.
Figure 12(a) illustrates this number w hen it uses the
bounce rules and in Figure 12(b) the impact to modified
bounce rule. As the second rule is a variation of the first one,
they have similar behaviors, which explain the similar impact
on the sharp turn change metric. Contrasting this, in Figures
12(c) and 12(d), the GIMM model used the wrap around
and delete replace rules, respectively, in which it is possible to
observe a small decrease in the sharp change number when
compared with the previous rules. Thus, it is possible to con-
clude that there is a variation in the direction change behav-
ior when a different border rule is used.
Within this context, there should be criteria for the
choice of border rule and should be used carefully, for these
rules influence the performance evaluation of both systems
and simulated applications.
5. IMPACT OF THE MOBILITY MODELS ON THE
PERFORMANCE OF THE MANETs
The impact of the mobility models on the routing protocols
will be evaluated in this section. This evaluation has the aim
of showing the importance of the mobility model and bor-
der rule criteria choice to represent a specific environment,
as shown in [1, 19, 21]. In contrast, the large majority of
the evaluations made in MANETs used the RWP model. To
accomplish the routing, it is necessary to utilize the routing
protocols. In this manner, the AODV, DSDV, and DSR proto-
cols, which are the most used in MANETs, wil l be evaluated.
The simulation environment and obtained results will be de-
scribed below.
5.1. Performance metrics
To evaluate the routing protocol performance, it is neces-
sary to use evaluation metrics. In this paper, the following
10 EURASIP Journal on Wireless Communications and Networking
454035302520151050
MN
0
200
400
600
800
1000
Sharp turn
(a) Bounce rule
454035302520151050
MN
0
200
400
600
800
1000
Sharp turn
(b) Modified bounce rule
454035302520151050
MN
0
200
400
600
800
1000
Sharp turn
(c) Wrap around rule
454035302520151050
MN
0
200
400
600
800
1000
Sharp turn
(d) Delete and replace rule
Figure 12: Number of sharp turns with the direction angle change 90
◦
in the GIMM model with several border rules.
evaluation metrics were used: delivery rate, received packets
number, sent packets number, routing packets number, and
routing overhead.
(1) Delivery rate is defined as being the ratio between the
number of the packets received and the number of the
sent packets. This metric is used to evaluate the proto-
col efficiency.
(2) Number of received packets is the quantity of the appli-
cation packets that reached their destiny correctly. This
measure is used in the delivery rate metric.
(3) Number of sent packets is the quantity of the applica-
tion packets that are sent by the origin. This measure
is also used in the delivery rate metric.
(4) Number of routing packets is the discovery and mainte-
nance routes packets quantity sent by the origin or for-
warded by the intermediate nodes. This value is nec-
essary for the calculus of the routing overhead in the
network.
(5) Routing overhead is calculated through the ratio be-
tween the quantity of routing packets transmitted in
the network and the number of data packets sent by
the application. This metric is important to deter-
mine the scalability capacity of the protocol, that is,
the smaller the banwidth of the network, the smaller
should be the routing traffic if compared with the
application data traffic. In a congested network, the
routing overhead leads to the packet discard, harming
the throughput and the discovery and the updating of
the routes. Furthermore, the overhead affects the bat-
tery energy consumption and with a greater number
of routing packets moving through the network, the
greater will be the probability of collision. This fact in-
fluences not only the delivery rates, but also the end-
to-end delay. In the next section, the simulation envi-
ronment and the obtained results will be described.
5.2. Simulation environment
The network simulator (NS-2 version 2.1b9) [22]waschosen
to simulate the MANETs and the ScenGen simulator [23]to
C.A.V.CamposandL.F.M.deMoraes 11
20181614121086
CBR sources
0
0.2
0.4
0.6
0.8
1
Normalized delivery rate
AODV
DSR
DSDV
Figure 13: Delivery rate of protocols using the GIMM model.
simulate the mobility models. For the simulation scenarios,
a rectangular area of 700 m
× 500 m, containing 50 MNs ini-
tially positioned in a random way has been used. The mobil-
ity models, RWP (min-speed
= 0 m/s, max-speed = 12 m/s,
pause time
= 0 s), SIMM (p = 0.3, q = 0.4, D = 5), and
GIMM (m
= 0.4, b = 2, e = 4) were used. All the mod-
els had average speed approximately equal to 6 m/s. For the
GIMM model, the border rules were utilized: bounce, modi-
fied bounce, wrap around, delete, and replace were utilized.
As a traffic network specifier, a constant bit rate (CBR)
traffic was chosen, instead of the transmission control proto-
col (TCP) traffic because its congestion control mechanism
would affect the protocol evaluation. With the aim of eval-
uating several charges in the network, 5, 10, and 20 pairs
of CBR traffic sources were used in 4 packets of 512 bytes
per second rate. These sources were randomly initialized and
kept until the end of the simulation. Each evaluated scenario
was simulated ten times and the medium value with a confi-
ance level of 0.90 was calculated.
5.3. Achieved results
Figure 13 is presented to verify the traffic influence in the
delivery rate of the routing protocols. This analysis was pre-
sented only for the GIMM model because of the lack of space.
The AODV obtained the highest delivery rate even when the
network traffic was increased. In this way, the DSDV, which
is a proactive protocol, obtained the worst performance, as it
can be verified in most of the performance evaluations avail-
able in the literature. For this reason, the DSDV protocol was
not evaluated in this paper.
In Table 4, the AODV protocol performance is presented,
under the influence of the RWP, SIMM, and GIMM models.
In this scenario, the traffic of 10 CBR sources randomly ini-
tialized was generated and maintained until the end of simu-
Table 4: The influence of mobility in the AODV protocol.
Metrics RWP SIMM GIMM
Received packets no. 2334 1799 1753
Sent packets no.
2471 2485 2226
Delivery rate no.
94.46% 72.39% 78.75%
Routing packets no.
8139 34 464 25 337
Routing overhead no.
3.29 13.87 11.38
Table 5: The influence of mobility in the DSR protocol.
Metrics RWP SIMM GIMM
Received packets no. 2333 1948 2020
Sent packets no.
2491 2475 2229
Delivery tax no.
93.66% 78.71% 90.62%
Routing packets no.
3009 76 223 16 954
Routing overhead no.
1.21 30.79 7.61
lation (up to 1000 seconds). An enormous variation in the
delivery rate with the AODV was observed when the mo-
bility model was sw itched. Using the RWP, a delivery rate
of approximately 94.5% was obtained. However, when the
SIMM and GIMM models are used, which were verified to be
more realistic than the RWP, this rate decreases to 72.4% and
78.75%, respectively. Thus, this metric decreased approxi-
mately 22% between the RWP and the SIMM and of 16%
from the RWP to the GIMM.
This decrease on the delivery rate demonst rates that the
performance evaluations in the AODV protocol with the
RWP model can present an over-estimated value, which can
affect the validation of the applications and the subsystem
evaluation that use the AODV. The high delivery rate is justi-
fied by the fact that the RWP generates around 75% of the
sharp turn changes. This means that the MNs remain on
average, better distributed within the simulation area which
does not happen with the SIMM and GIMM models. In the
routing overhead metric, this same behavior is observed, be-
ing even more accentuated, seeing as the metric value, using
the RWP model, which is approximately 3.3 routing packets
propagate for each data packet that is sent. As to the SIMM
model, this value increases around 420% in comparison with
the RWP value and approximately 340% if compared to the
GIMM model. Once more, an over-estimated evaluation of
the AODV protocol is identified when the RWP model is
used.
In Table 5, the DSR protocol performance is presented
using the same mobility models. Again, a large variation is
observed in the packet delivery rate under the different mo-
bility models. Using the RWP model, a delivery rate of ap-
proximately 93.7% is obtained. However, when the SIMM
and GIMM are used, this rate decreases to 78.7% and 90.6%,
respectively. Therefore, the delivery rates using DSR under
SIMM and GIMM are, respectively, 15% and 3% less than
that obtained under the RWP model. The configurations as-
sumed for this scenario are identical to the previous ones.
For the routing overhead metric we observe that approx-
imately 1.2 routing packets propagate for each data packet
12 EURASIP Journal on Wireless Communications and Networking
200150100500
Time (s)
0
0.2
0.4
0.6
0.8
1
Normalized delivery rate
DSR-GIMM
AODV -GIMM
DSR-RWP
AODV -RWP
Figure 14: Delivery rate of the AODV and the DSR under the im-
pact of mobility.
sent under the RWP model. This value grows around 2400%
for the SIMM, and 530% for the GIMM, respectively, as com-
pared to the RWP model. This substantial increase is due to
the fact that, in the long range, for SIMM and GIMM the
mobile nodes tend to get concentrated in specific regions of
the simulation area. Therefore, under the DSR protocol, the
nodes tend to generate a great amount of overhead routing
packets for each data packet sent. On the other end, since
under the RWP model the mobile nodes tend to get better
distributed in the simulation area, routes should be avail-
able most of the time, a fact that implies in much less over-
head, due to routing, per transmitted packet. In Figure 14,
the AODV and the DSR protocol delivery rate variation be-
havior are shown, in relation to RWP and GIMM model sim-
ulation time. In this figure, a large delivery rate variation at
the beginning of the simulations can be observed, which, as
time passes, tends to disappear due to the protocol stability.
With the aim of evaluating the influence of the chosen
border rules, Figure 15 was displayed. The bounce and mod-
ified bounce generate a very similar impact on the delivery
rate and this impact is smaller, around 5%, than the delete
and replace rule. These results present an influence of the
border rule used in the performance of the routing protocols,
which means that the evaluation of these protocols must be
done carefully.
Figures 16, 17,and18 show the impact of the amount
of traffic on AODV performance using the border rules:
bounce, modified bounce, and delete and replace, respec-
tively. In these figures, the influence that a rule generates in
the delivery rate of the protocols with diverse traffics can be
observed. These variations prove the necessity of criteria in
the utilization of the border rules for the mobility represen-
tation in MANETs. In addition, border rules are also param-
eters to be taken into account in protocol performance eval-
uations.
200150100500
Time (s)
0
0.2
0.4
0.6
0.8
1
Normalized delivery rate
Bounce
Modified bounce
Delete and replace
Figure 15: The impact of the chosen border rule on AODV perfor-
mance.
200150100500
Time (s)
0
0.2
0.4
0.6
0.8
1
Normalized delivery rate
5CBR
10 CBR
20 CBR
Figure 16: The influence of traffic in AODV performance using the
bounce rule.
Finally, new researches on the evaluated protocols are
recommended such as, throughput, delay, number of hops,
and network density using the above method. Moreover, this
evaluation method can also be applied to the evaluation of
other routing protocols.
6. CONCLUSIONS AND FUTURE WORK
As described in Section 2, there are several mobility models
that are used in MANETs. However, characteristics of these
models restrict them to specific behaviors or simply do not
C.A.V.CamposandL.F.M.deMoraes 13
200150100500
Time (s)
0
0.2
0.4
0.6
0.8
1
Normalized delivery rate
5CBR
10 CBR
20 CBR
Figure 17: The influence of traffic in AODV performance using the
modified bounce rule.
200150100500
Time (s)
0
0.2
0.4
0.6
0.8
1
Normalized delivery rate
5CBR
10 CBR
20 CBR
Figure 18: The influence of traffic in AODV performance when ap-
plied the delete and replace rule.
represent the reality. Besides, more criteria on the choice of
the mobility model are demanded; otherwise, a nonrealistic
evaluation as shown in [9, 16, 19, 21] can be made. In this
manner, it is necessary to develop new models.
In this context, a mobility modeling was presented, in
which the changes of directions and the velocity variations
are closer to real scenarios than other existing models in the
literature.
The achieved results by simulations verified the model-
ing characteristics above showing that in certain cases the
proposed modeling is more adequate than the RWP model.
Moreover, the mobility profiles and border rules were in-
serted in the modeling, and the impact of these rules was
presented.
As an application of the presented modeling, a detailed
study of the AODV, DSDV, and DSR routing performance
was done. In this evaluation, it was observed that the mobility
model and the chosen border rule drastically affect, in some
cases, the functioning of these protocols.
The accomplished study showed, utilizing the RWP
model, optimistic results; in other words, an over-estimated
performance was found. It can be concluded that the chosen
mobility model drastically affects the performance evalua-
tion of the routing protocols in MANETs. Thus, this research
motivates a reevaluation not only of the routing protocols,
but also of all the applications and subsystems of MANETs.
As future works, it is intended to compare the proposed
modeling with real data using the methodology proposal in
the works of project CRAWDAD [24]. This comparison will
be made in relation to the velocity distribution, sharp turn
distribution, density of the network, and so forth.
ACKNOWLEDGMENTS
The authors would like to thank Bruno A. A. Nunes and
the anonymous reviewers for their criticism and suggestions,
which significantly contributed to improve the quality of this
paper. This work was sponsored by CAPES (Ministry of Ed-
ucation, Brazil), CNPq, and FINEP (Ministry of Science and
Technology, Brazil).
REFERENCES
[1] T. Camp, J. Boleng, and V. Davies, “A survey of mobility mod-
els for ad hoc network research,” Wireless Communications and
Mobile Computing, vol. 2, no. 5, pp. 483–502, 2002.
[2] S. R. Das, R. Castaneda, J. Yan, and R. Sengupta, “Comparative
performance evaluation of routing protocols for mobile, ad
hoc networks,” in Proceedings of the 7th International Confer-
ence on Computer Communications and Networks (IC3N ’98),
pp. 153–161, Lafayette, La, USA, October 1998.
[3] K. H. Wang and B. Li, “Efficient and guaranteed service cov-
erage in partitionable mobile ad hoc networks,” in Proceedings
of the 21st Annual Joint Conference of the IEEE Computer and
Communications Societies (INFOCOM ’02) , vol. 2, pp. 1089–
1098, New York, NY, USA, June 2002.
[4] M. M. Zonoozi and P. Dassanayake, “User mobility modeling
and characterization of mobility patterns,” IEEE Journal on Se-
lected Areas in Communications, vol. 15, no. 7, pp. 1239–1252,
1997.
[5] S. Basagni, I. Chlamtac, V. R. Syrotiuk, and B. A. Woodward,
“A distance routing effect algorithm for mobility (DREAM),”
in Proceedings of the 4th Annual ACM/IEEE International Con-
ference on Mobile Computing and Networking (MOBICOM
’98), pp. 76–84, Dallas, Tex, USA, October 1998.
[6] Y. B. Ko and N. H. Vaidya, “Location-aided routing (LAR)
in mobile ad hoc networks,” in Proceedings of the 4th Annual
ACM/IEEE International Conference on Mobile Computing and
Networking (MOBICOM ’98), pp. 66–75, Dallas, Tex, USA,
October 1998.
[7] D. B. Johnson and D. A. Maltz, “Dynamic source routing in
ad hoc wireless networks,” in Mobile Computing, vol. 353,
14 EURASIP Journal on Wireless Communications and Networking
chapter 5, pp. 153–181, Kluwer Academic, Dordrecht, The
Netherlands, 1996.
[8] A. Jardosh, E. M . Belding-Royer, K. C. Almeroth, and S. Suri,
“Towards realistic mobility models for mobile ad hoc net-
works,” in Proceedings of the 9th IEEE Annual Internat ional
Conference on Mobile Computing and Networking (MOBICOM
’03), pp. 217–229, San Diego, Calif, USA, September 2003.
[9] J. Yoon, M. Liu, and B. Noble, “Random waypoint considered
harmful,” in Proceedings of the 22nd Annual Joint Conference of
the IEEE Computer and Communications Societies (INFOCOM
’03), vol. 2, pp. 1312–1321, San Francisco, Calif, USA, March-
April 2003.
[10] W. Navidi and T. Camp, “Stationary distributions for the ran-
dom waypoint mobility model,” IEEE Transactions on Mobile
Computing, vol. 3, no. 1, pp. 99–108, 2004.
[11] J Y. Le Boudec and M. Vojnovi
´
c, “Perfect simulation and sta-
tionarity of a class of mobility models,” in Proceedings of the
24th Annual Joint Conference of the IEEE Computer and Com-
munications Societies (INFOCOM ’05), vol. 4, pp. 2743–2754,
Miami, Fla, USA, March 2005.
[12] C. Chiang, “Wireless networks multicasting,” Ph.D. disserta-
tion, Department of Computer Science, University of Califor-
nia, Los Angeles, Calif, USA, 1998.
[13] B. Liang and Z. J. Haas, “Predictive distance-based mobility
management for PCS networks,” in Proceedings of the 18th An-
nual Joint Conference of the IEEE Computer and Communi-
cations Societie (INFOCOM ’99), vol. 3, pp. 1377–1384, New
York, NY, USA, March 1999.
[14] B. Liang and Z. J. Haas, “Predictive distance-based mo-
bility management for multidimensional PCS networks,”
IEEE/ACM Transactions on Networking, vol. 11, no. 5, pp. 718–
732, 2003.
[15] C. Bettstetter, “Mobility modeling in wireless networks: cat-
egorization, smooth movement, and border effects,” ACM
SIGMOBILE Mobile Computing and Communications Review,
vol. 5, no. 3, pp. 55–66, 2001.
[16] X. Hong, M. Gerla, G. Pei, and C. Chiang, “A group mobility
model for ad hoc wireless networks,” in Proceedings of the 2nd
ACM International Workshop on Modeling, Analysis and Simu-
lation of Wireless and Mobile Systems (MSWiM ’99), pp. 53–60,
Seattle, Wash, USA, August 1999.
[17] F. Bai, N. Sadagopan, and A. Helmy, “The IMPORTANT
framework for analyzing the impact of mobility on perfor-
mance of routing protocols for ad hoc networks,” Ad Hoc Net-
works, vol. 1, no. 4, pp. 383–403, 2003.
[18] L. Kleinrock, Queueing Systems, vol. 1, John Wiley & Sons,
New York, NY, USA, 1975.
[19] C. A. V. Campos, D. C. Otero, and L. F. M. de Moraes, “Realis-
tic individual mobility Markovian models for mobile ad hoc
networks,” in Proceedings of IEEE Wireless Communications
and Networking Conference (WCNC ’04), vol. 4, pp. 1980–
1985, Atlanta, Ga, USA, March 2004.
[20] Z. J. Haas and M. R. Pearlman, “The performance of query
control schemes for the zone routing protocol,” ACM SIG-
COMM Computer Communication Review, vol. 28, no. 4, pp.
167–177, 1998.
[21] P. Johansson, T. Larsson, N. Hedman, B. Mielczarek, and M.
Degermark, “Scenario-based performance analysis of routing
protocols for mobile ad hoc networks,” in Proceedings of the 5th
Annual ACM/IEEE International Conference on Mobile Com-
puting and Networking (MOBICOM ’99), pp. 195–206, Seattle,
Wash, USA, August 1999.
[22] K. Fall and K. Varadhan, The NS Manual,TheVINTProject,
January 2002.
[23] L. Qiming, “The scenario generator: a tool to generate
MANET mobility scenarios for NS-2,” 2001.
[24] “CRAWDAD Project—A Community Resource for Archiving
Wireless Data at Dartmouth,” http://cr awdad.cs.dartmouth.
edu/.