Báo cáo hóa học: " Research Article Mapping Speech Spectra from Throat Microphone to Close-Speaking Microphone: A Neural Network Approach" potx
Bạn đang xem bản rút gọn của tài liệu. Xem và tải ngay bản đầy đủ của tài liệu tại đây (1.82 MB, 10 trang )
Hindawi Publishing Corporation
EURASIP Journal on Advances in Signal Processing
Volume 2007, Article ID 87219, 10 pages
doi:10.1155/2007/87219
Research Article
Mapping Speech Spectra from Throat Microphone to
Close-Speaking Microphone: A Neural Network Approach
A. Shahina
1
and B. Yegnanarayana
2
1
Department of Computer Science and Engineering, Indian Institute of Technology Madras, Chennai 600036, India
2
International Institute of Information Technology, Gachibowli, Hyderabad 500032, India
Received 4 October 2006; Accepted 25 March 2007
Recommended by Jiri Jan
Speech recorded from a throat microphone is robust to the surrounding noise, but sounds unnatural unlike the speech recorded
from a close-speaking microphone. This paper addresses the issue of improving the perceptual quality of the throat microphone
speech by mapping the speech spectra from the throat microphone to the close-speaking microphone. A neural network model is
used to capture the speaker-dependent functional relationship between the feature vectors (cepstral coefficients) of the two speech
signals. A method is proposed to ensure the stability of the all-pole synthesis filter. Objective evaluations indicate the effectiveness
of the proposed mapping scheme. The advantage of this method is that the model gives a smooth estimate of the spectra of the
close-speaking microphone speech. No distortions are perceived in the reconstructed speech. This mapping technique is also used
for bandwidth extension of telephone speech.
Copyright © 2007 A. Shahina and B. Yegnanarayana. This is an open access article distributed under the Creative Commons
Attribution License, which permits unrestricted use, distribution, and reproduction in any medium, provided the original work is
properly cited.
1. INTRODUCTION
Speech signal collected by a vibration pickup (called throat
microphone) placed at the throat (near the glottis) is clean,
but does not sound natural like a normal (close-speaking)
microphone speech. Mapping the speech spectra from the
throat microphone to the normal microphone aims at im-
proving the perceptual quality of the slightly muffled and
“metallic” speech from the throat microphone. This would
reduce the discomfort arising due to prolonged listening to
speech from a throat microphone in adverse situations as
in cockpits of aircrafts, in the presence of intense noise of
running engines at machine shops and engine rooms among
others, where it is currently used.
Mapping the speech spectra involves the following stages:
the first stage consisting of training involves recording speech
simultaneously using the throat microphone and normal mi-
crophone from a speaker. Simultaneous recording is essen-
tial for understanding the differences between components
of speech in both signals and for training appropriate models
to capture the mapping between the spectra of the two sig-
nals. Suitable speech features are extracted from the speech
signals. During training, the feature vectors extracted from
the throat microphone ( TM) speech are mapped onto the
corresponding feature vectors extracted from the normal mi-
crophone (NM) speech. In the second stage consisting of
testing, feature vectors corresponding to the NM speech are
estimated for each frame of the TM speech. The estimated
features are used to reconstruct the speech.
Two major issues are addressed in the approach proposed
in this paper: (a) a suitable mapping technique to capture the
functional relationship between the feature vectors of the two
types of speech signals, and (b) an approach to ensure that
the estimated feature vectors generated by the model result
in a stable all-pole filter for synthesis of speech.
The TM speech is typically a low bandwidth signal,
whereas the NM speech is of wide bandwidth. Since both
speech signals are recorded simultaneously from the same
speaker, it is assumed that the TM speech and the NM speech
are closely related. The problem of mapping then can be
viewed as mapping of the low-bandwidth (throat) signal to
the corresponding high-bandwidth (normal) signal. There
exist a variety of approaches in the literature dealing with
the issue of bandwidth extension of telephony speech [1–3],
which has a low bandwidth (300 to 3400 Hz). The motivation
for telephony speech has been to increase the bandwidth to
improve its pleasantness at the receiving end. The procedure
involves constructing the wideband residual signal (referred
2 EURASIP Journal on Advances in Signal Processing
to as high-frequency regeneration) and determining a set of
wideband linear prediction (LP) coefficients. Once these two
components are generated, the wideband residual is fed to
the wideband synthesis filter derived from the wideband LP
coefficients to produce a wideband speech signal.
The commonly adopted high-frequency regeneration
methods are [1, 4] (a) rectification of the upsampled narrow-
band residual to gener a te high-frequency spectral content,
followed by filtering through an LP analysis filter to generate
spectr ally flat residual, (b) spectr a l folding, which involves
the expansion of the narrowband residual through the in-
sertion of zeros between adjacent samples, and (c) spectral
shifting, where the upsampled narrowband residual is multi-
plied by a cosine function resulting in a shift in the original
spectrum.
There are several approaches for the reconstruction of
the wideband spectrum. Codebook mapping is one ap-
proach which relies on a one-to-one mapping between the
codebooks of narrowband and wideband spectral envelopes
[1, 5, 6]. During the testing phase, for each frame of the nar-
rowband speech, the best fitting entry of the wideband code-
book is selected as the desired estimate of the wideband spec-
tral envelope. Statistical approaches such as Gaussian mix-
ture models (GMM) and hidden Markov models (HMM)
used for the wideband spectral estimation were reported to
provide smooth classification indices, thereby avoiding un-
natural discontinuities prevalent in VQ-based approaches
[7, 8]. Neural network approaches that use a simple nonlin-
ear mapping from narrow to wideband speech signal have
been exploited to estimate the missing frequency compo-
nents [9, 10]. The stability of the all-pole filter derived from
the network output is important for synthesis. To ensure this
in the all-pole filter, poles existing outside the unit circle if
any were reflected within the unit circle.
Alternate speech sensors have been used to estimate fea-
ture vectors of clean close-talking microphone speech. In
[11], throat microphone and normal microphone were used
in combination to increase the robustness of sp eech rec-
ognizers. Noisy mel-cepstral features from the normal and
throat microphones, juxtaposed as an extended feature vec-
tor, were mapped to mel-cepstral feature vectors of clean nor-
mal microphone speech. In [12], a bone-conductive sensor,
integrated with a close-talking microphone, was used to en-
hance the wideband noisy speech for use with an existing
speech recognition system. A mapping from the bone sensor
signal to the clean speech signal was learnt, and then the bone
signal and the noisy signal were combined to obtain the final
estimate of the clean speech. In the above two studies, the al-
ternate speech sensor has been used in combination with a
normal microphone to obtain clean speech. In our study, we
estimate the features of the normal microphone speech from
the features of the throat microphone speech alone. This is
useful in situations where the throat microphone alone is
used by the speakers.
In this paper, a multilayered feedforward neural network
is used to capture the functional relationship between the
features of the TM speech and NM speech of a speaker.
We propose an approach that uses autocorrelation method
to derive the coefficients of a stable all-pole filter [13]. The
advantage of the proposed method is that no discontinuity
is perceived between successive frames of the reconstructed
speech. This is because the network provides a smooth esti-
mate of the wideband normal spectra.
The paper is organized as follows: Section 2 gives a de-
scription of the spectral characteristics of the TM speech
in comparison with those of the NM speech. The proposed
method for spectral mapping from the TM speech to the NM
speech is detailed in Section 3. The features and the mapping
network used for capturing the functional relationship be-
tween the TM speech and the NM speech are explained. This
section also discusses the behavior of the network in captur-
ing the mapping for different types of sound units, and il-
lustrates the efficiency of mapping during testing. An objec-
tive measure is used to assess the quality of the regenerated
speech. In this section, it is also shown that the mapping tech-
nique can b e effectively used to extend the bandwidth of nar-
rowband telephone speech. Section 4 summarizes this work
and lists some possible extensions.
2. SPECTRAL CHARACTERISTICS OF TM SPEECH
AND NM SPEECH
The perceptual differences between the TM speech and the
NM speech depend on their acoustic characteristics. This
section describes a comparative acoustic analysis of various
sound units in the two speech signals based on the analysis
of their acoustic waveforms, spectrograms, linear prediction
spectra derived from the closed-glottis regions after the in-
stants of significant excitation [14], and pitch synchronous
formant trajectories of syllables. The pitch synchronous anal-
ysis provides an accurate estimate of the frequency response
of the vocal tract system.
Five broad categories of sound units, namely, vowels,
stops, nasals, fricatives, and semivowels of the Indian lan-
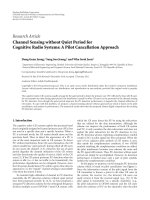
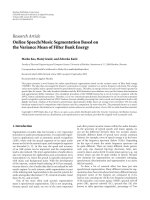
guage (Hindi) are studied. In the case of vowels, the lower
formants are spectrally well defined in the TM speech, as
in the NM speech. However, most of the higher frequencies
(above 3000 Hz) are missing in TM sp eech. This can be ob-
served in the LP spectra derived from the closed-glottis re-
gions of the vowels as shown in Figure 1. The formant loca-
tions of the back vowels in the two signals vary. For example,
in the case of back vowel /u/ in the NM speech, the second
formant is lowered due to the effect of lip rounding. T he first
and second formants are close, indicating the backness of the
vowels. But in the TM speech, the second formant is high
like in the front vowels. Figure 1 shows that the spectra of
vowel /u/ resemble that of vowel /i/ in the TM speech. This
increases the confusability between the two vowels. Conse-
quently, recognition of these two vowels is poorer in the case
of TM speech as compared to the NM speech [15].
In voiced stop consonants, the closure is characterised
by (low frequency) energy in the 0 to 500 Hz range for NM
speech. The vocal fold vibration accompanying the closure
is perceived as low frequency since the normal microphone
picks up the vibration during the closure phase as it propa-
gates through the walls of the throat. This activity is referred
A. Shahina and B. Yegnanarayana 3
−20
0
20
40
60
80
100
120
140
(dB)
0 500 1000 1500 2000 2500 3000 3500 4000
Frequency (Hz)
−20
0
20
40
60
80
100
120
(dB)
0 500 1000 1500 2000 2500 3000 3500 4000
Frequency (Hz)
(a)
−20
0
20
40
60
80
100
120
(dB)
0 500 1000 1500 2000 2500 3000 3500 4000
Frequency (Hz)
−20
0
20
40
60
80
100
120
140
(dB)
0 500 1000 1500 2000 2500 3000 3500 4000
Frequency (Hz)
(b)
−20
0
20
40
60
80
100
120
140
(dB)
0 500 1000 1500 2000 2500 3000 3500 4000
Frequency (Hz)
−20
0
20
40
60
80
100
120
140
(dB)
0 500 1000 1500 2000 2500 3000 3500 4000
Frequency (Hz)
(c)
Figure 1: LP spectra of 11 successive closed-glottis regions of (a) front vowel /i/,(b)midvowel/a/, and (c) back vowel /u/ from simultane-
ously recorded TM speech and NM speech.
to as the “voice bar” [16]. However, in the TM speech, the
closure region of each of the voiced stops is character ised by
distinct well-defined formant-like structures. This is due to
the placement of the throat microphone close to the vocal
folds. It picks up the resonances of the oral cavity (behind
the region of closure) associated with the vibrations of the
vocal folds during the closure of the voiced stop consonants.
These distinct formant-like structures in the TM speech serve
as acoustic cues that can be used to resolve the highly confus-
able voiced stops into classes based on the place of articula-
tion [15].
Nasal consonants in the NM speech are characterised by
distinct low amplitude, damped periodic waveforms. This is
because during the production of nasals the oral cavity is
4 EURASIP Journal on Advances in Signal Processing
Table 1: Characteristics of sound units in TM speech and NM speech.
Characteristics of sound units Normal speech Throat speech
Energy distribution Up to Nyquist frequency <3000 Hz
Formant bandwidth Narrow Large
Formant location of back vowels Low second formant High second formant like front vowels
Closure phase of voiced stop consonants Low frequency “voice-bar” Formant-like structures
Aspiration phase of stop consonants Large amplitude noise Low-amplitude noise
Signal damping in nasal consonants Highly damped Less damped like vowels
Intensity of formants in semivowels and
nasal consonants
Less compared to vowels Similar to vowels
Formant locations of nasal consonants Depend on nasal resonances
Higher-formant locations depend on oral
resonances also
completely closed at some location, and the sound is radi-
ated through the nostrils. The damping in the nostrils affects
the relative amplitude of the nasals. In contrast, in the TM
speech, the effect of damping is minimal. So, the waveforms
of nasals appear more like vowels. Distinct formant locations
characteristic of the nasals are seen in both the TM and NM
speeches. While the lower-formant locations are similar in
both the TM and NM speeches, the higher-formant locations
differ. T his could be due to the resonances of the oral tract
appearing in the TM speech.
Fricatives (/s/,/
/, /h/) in the NM speech signal are char-
acterised by the presence of energy distributed over a wide
range of frequencies extending even beyond 8000 Hz. In the
TM speech, fricatives are characterised by the distribution
of the noise energy restricted to a band of frequencies be-
tween 2000 and 3500 Hz. This is because the turbulence in
the airflow caused by the constriction in the oral tract is not
as effectively captured by the throat microphone as compared
to the normal microphone.
For semivowels, in the NM speech the formants have a
lower intensity than the vowels, with an abrupt change in in-
tensity observed at the transition from semivowel to vowel
(or vice versa). In the TM speech, the intensity of the for-
mants of the semivowels is similar to that of the vowels, and
hence there is no abrupt change at the transition region from
semivowel to vowel or vice versa.
Some of the differences in the acoustic characteristics be-
tween the TM speech and NM speech for various sound units
are summarized in Table 1.
3. MAPPING SPECTRAL FEATURES OF TM SPEECH
TO NM SPEECH
The study of the acoustic characteristics of TM and NM
speeches brings out the differences in the spectra of the
two speech signals for various sound units. These differ-
ences could be one of the contributing factors for the
unnaturalness of the TM speech. In order to improve the per-
ceptual quality of the TM speech, we need to compensate for
these differences in the spectra.
The focus in this paper is (a) to achieve an effective
mapping between the spectral features of the TM and NM
speeches, (b) to ensure that the all-pole synthesis filter de-
rived from the learnt mapping is stable, and (c) to ensure
that the synthesized speech does not suffer from discontinu-
ities due to spectral “jumps” between adjacent frames. The
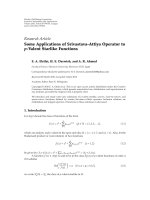
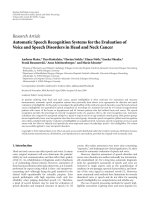
filter for synthesis is obtained by (1) using the cepstral coeffi-
cients from both the TM and NM sp eech signals for initially
training a mapping network, and (2) deriving an all-pole fil-
ter from the estimated cepstral coefficients that are obtained
from the trained mapping network. The method of deriving
the synthesis filter is described below.
3.1. Features for mapping
Cepstral coefficients are used to represent the feature vec-
tor of each frame of data. The cepstral coefficients are de-
rived from the LP coefficients. The cepstr al coefficients are
obtained from the LP spectrum as follows [17].
TheLPspectrumforaframeofspeechisgivenby
H(k)
2
=
1
1+
p
n
=1
a
n
e
− j(2π/M)nk
2
, k =0, 1, , M − 1,
(1)
where a
n
s are the LP coefficients, M is the number of spectral
values, and p is the LP order. The inverse discrete Fourier
transform (DFT) of the log LP spectrum gives the cepstral
coefficients c
n
.Let
S(k)
= log
H(k)
2
. (2)
Then
c
n
=
1
M
M−1
k=0
S(k)e
j(2π/M)kn
, n = 0, 1, , M − 1. (3)
Only the first q cepstral coefficients are chosen to represent
the LP spectrum. Normally, q is chosen much larger than p
in order to represent the LP spectrum adequately.
Linearly weighted cepstral coefficients nc
n
, n = 1, 2, ,
q, are chosen as a feature vector representing the frame of
speech. The weighted linear prediction cepstral coefficients
(wLPCCs) are derived for each frame of the throat speech
and for the corresponding fr ame of the NM speech. These
pairs of wLPCCs vectors are used as input-output pairs to
A. Shahina and B. Yegnanarayana 5
train a neural network model to capture the implicit map-
ping.
In the testing stage, the output of the trained network
for each frame of the TM speech of a test utterance gives an
estimate of the wLPCCs of the corresponding frame of NM
speech. The wLPCCs are deweighted. From these estimated
LPCCs
c
n
, n = 1, 2, , q, the estimate of the log LP spectrum
is obtained by performing DFT. Let
S(k), k = 0, 1, 2, , M −
1, be the estimated log spectrum. The estimated spectrum
P(k) is obtained as
P(k) = e
S(k)
, k = 0, 1,2, , M − 1. (4)
From the spectrum
P(k), the autocorrelation function
R(n)
is obtained using inverse DFT of
P(k).
The first p +1valuesof
R(n) are used in the Levinson-
Durbin algorithm to derive the LP coefficients. These LP co-
efficients for each frame are used to resynthesize the speech
by exciting the time-varying filter with the LP residual of the
TM speech. The all-pole synthesis filter derived from these
LP coefficients is stable because they are derived from the au-
tocorrelation function.
3.2. Neural network model for mapping
spectral features
Given a set of input-output pattern pairs (a
l
, b
l
), l =
1, 2, , L, the objective of pattern mapping is to capture
the implied mapping between the input and output vectors.
Once the system behavior is captured by the neural network,
the network would produce a possible output pattern for a
new input pattern not used in the t raining set. The possi-
ble output pattern would be an interpolated version of the
output patterns corresponding to the input training patterns
which are closest to the given test input pattern [18, 19].
The network is said to generalize well when the input-output
mapping computed by the network is (nearly) correct for the
test data that is different from the examples used to train the
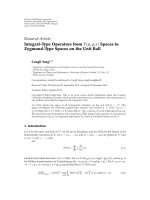
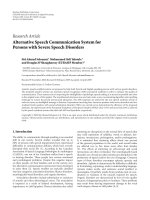
network [20]. A multilayered feedforward neural network
(MLFFNN) with at least two intermediate layers in addition
to the input and output layers can perform a pattern map-
ping task [18]. The additional layers are called the hidden
layers. The neurons in these layers, called the hidden neu-
rons, enable the network to learn complex tasks by extracting
progressively more meaning ful features from the input pat-
tern vectors. The input and output neurons for this task are
linear units, while the hidden neurons are nonlinear units.
The activation function of the hidden neurons is continu-
ously differentiable to enable the backpropagation of error.
The mapping between the training pattern pairs involves
iteratively determining a set of weights
{w
ij
} such that the ac-
tual output b
l
is equal (or nearly equal) to the desired output
b
l
for all the given L pattern pairs. The weights are deter-
mined by using the criterion that the total mean squared er-
ror between the desired output and the actual output is to
be minimized. The total error E over all the L input-output
Layer
1
23
4
.
.
.
.
.
.
.
.
.
.
.
.
Input layer
Output layer
Figure 2: A 4-layer mapping neural network of size 12L 24N 24N
12L,whereL refers to a linear unit and N to a nonlinear unit, the
numbers represent the number of nodes in a layer.
pattern pairs is given by
E
=
1
L
L
l=1
b
l
− b
l
2
. (5)
To arrive at an optimum set of weights to capture the map-
ping implicit in the set of input-output pattern pairs, and
to accelerate the rate of convergence, the conjugate gradient
method is used. In the conjugate gradient method, the incre-
ment in weight at the (m +1)thiterationisgivenby
Δw
= η(m)d(m), (6)
where η is the learning rate parameter. The direction of in-
crement d(m) in the weight is a linear combination of the
current gradient vector and the previous direction of the in-
crement in the weight [18]. That is,
d(m)
=−g(m)+α(m − 1)d(m − 1), (7)
where g(m)
= ∂E/∂w. The value of α(m) is obtained in terms
of the gradient using the Fletcher-Reeves formula given by
α(m)
=
g
T
(m +1)g(m +1)
g
T
(m)g(m)
. (8)
The objective is to determine the value of η for which the
error E[w(m)+d(m)] is minimized for the given values of
w(m)andd(m).
3.3. Experimental results
The t raining and testing data are obtained from the same
speaker because the mapping is speaker-dependent. The si-
multaneously recorded speech signals from a throat micro-
phone and a normal microphone are sampled at a rate of
8 kHz. For training, 5 minutes of speech data (read from a
text, and containing sp eech as well as nonspeech regions)
are used. LP analysis is performed on Hamming windowed
speech frames, each of 20 millisecond dur ation. The overlap
between adjacent frames is 5 milliseconds. The wLPCCs are
derived from the TM speech and the NM speech. After exper-
imenting with several LP orders, an LP order of p
= 8and
6 EURASIP Journal on Advances in Signal Processing
Training stage
Throat
speech
LP
analysis
LPC
LPC to
cepstrum
conversion
wLPCC
input
vector
desired
vector
Mapping
network
MLFFNN
wLPCC
LPC to
cepstrum
conversion
LPC
LP
analysis
Normal
speech
Testing stage
Throat
speech
LP
analysis
LPC
LP residual
LPC to
cepstrum
conversion
wLPCC
Trained
MLFFNN
wL
PCC
estimate
Cepstrum
to LPC
conversion
L
PC
Synthesis
(all pole)
filter
Reconstructed
speech
Figure 3: Block diagram of the proposed approach for modeling the relationship between the TM speech and the NM speech of a speaker.
the number of wLPCCs q = 12 are chosen, although these
choices are not critical. Each training pattern is preprocessed
so that its mean value, averaged over the entire training set,
is close to zero. Each pattern (vector) is normalized so that
the component values fall within the range [
−1, 1]. This ac-
celerates the training process of the network [20]. These pre-
processed wLPCCs derived from the TM speech and the NM
speech form the input-output training pairs, respectively, for
the mapping network. The training pattern pairs are pre-
sented to the network in the batch mode. The order in which
the patterns are presented is randomized from one epoch to
the next. This heuristic is motivated by a desire to search
more of the weight space. The hyperbolic tangent function
given by (16/9) tanh(2x/3), where x is the input activation
value, is the antisymmetric activation function used. This an-
tisymmetric activation function is suitable for faster learning
of the network [20]. Various network structures have been
explored in this study. The network structure finally chosen is
illustrated in Figure 2. The network is trained for 200 epochs.
The block diagram of the proposed system for improving the
quality of the TM speech is shown in Figure 3.
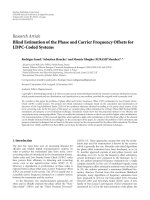
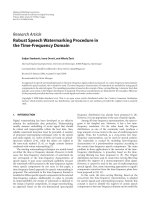
In the testing stage, the cepstral coefficients of the NM
speech are estimated as described in Section 3.1.TheLP
spectra (LP order
= 8) of the test (TM) input speech and the
corresponding (desired) NM speech, and the reconstructed
LP spectra are shown for various sound units in Figure 4.The
reconstructed spectra are similar to the NM spectra for var-
ious sound units. It is seen that, in the case of vowels, the
higher formants have a steep fall in the case of TM spectra.
In contrast, the spectral roll-off in the reconstructed spectra
is comparatively less, as in the NM spectra. This shows that
higher formants are emphasized in the reconstructed spec-
tra. The TM spectra for the voiced stop consonants /g/ and
/d/ resemble that of a vowel. This is due to the presence of
formant-like structures during the closure phase. However,
in the reconstructed spectra, as in the NM spectra, no such
well-defined peaks are visible. In the case of nasals, the loca-
tion of the formant(s) in the reconstructed spectra and the
NM spectra differs only slightly. The oral resonance seen in
the TM spectra is missing in the reconstructed spectra. It
is observed that the mapping is generally not learnt well in
the case of fricatives. This is because of the random noise-
like signal characteristic of fr icatives. The LP spect ra for a
sequence of frames of the TM and NM speeches, and the cor-
responding reconstructed spectra are shown in Figure 5.Itis
seen that the higher-frequency content, missing in the TM
spectra is incorporated in the reconstructed spectra. It is also
seen from this figure that the network is able to provide a
smooth estimate of the NM spectra over consecutive frames.
The advantage of this method is that no distortion (due to
spectral discontinuity between adjacent frames) is perceived
in the reconstructed speech.
The performance of this mapping technique is evaluated
using the Itakura distance measure as the objective criterion.
The Itakura distance measures the distance between two LP
spectra. The Itakura distances between two LP vectors, say a
k
and b
k
,aregivenby[13]
d
ab
a
k
, b
k
=
b
T
k
R
s
a
b
k
a
T
k
R
s
a
a
k
,
d
ba
a
k
, b
k
=
a
T
k
R
s
b
a
k
b
T
k
R
s
b
b
k
,
(9)
where d
ab
and d
ba
are the asymmetric distances from a
k
to
b
k
and vice versa, respectively.
R
s
a
={r
s
a
} and
R
s
b
={r
s
b
},
where
{r
s
a
} and {r
s
b
} are the signal autocorrelation coeffi-
cients of the speech frames corresponding to a
k
and b
k
,re-
spectively. The symmetric Itakura distance between the two
vectorsisgivenbyd
= 0.5(d
ab
+ d
ba
). The Itakura distance
between the TM and the reconstructed spectra, and the NM
and the reconstructed spec tra are computed for each frame.
Figure 6 shows the Itakura distance plot for an utterance. It
can be observed that the distance between the NM and the re-
constructed spectra is very small when compared to the dis-
tance between the NM and the TM spectra. This shows that
the reconstructed spectra are very close to the NM spectra.
Thus, the mapping network is able to capture the spectral
correlation between the TM and NM speeches of a speaker.
Listening to the reconstructed speech (speech synthesized us-
ing the estimated LP coefficients derived from the network
A. Shahina and B. Yegnanarayana 7
−10
−5
0
5
10
15
20
(dB)
0 500 1000 1500 2000 2500 3000 3500 4000
Frequency (Hz)
Throat
Normal
Reconstructed
Vowel /a/
−15
−10
−5
0
5
10
15
20
25
(dB)
0 500 1000 1500 2000 2500 3000 3500 4000
Frequency (Hz)
Throat
Normal
Reconstructed
Vowel /e/
−20
−15
−10
−5
0
5
10
15
20
25
30
(dB)
0 500 1000 1500 2000 2500 3000 3500 4000
Frequency (Hz)
Throat
Normal
Reconstructed
Stop consonant /g/
−15
−10
−5
0
5
10
15
20
25
30
(dB)
0 500 1000 1500 2000 2500 3000 3500 4000
Frequency (Hz)
Throat
Normal
Reconstructed
Stop consonant /d/
−15
−10
−5
0
5
10
15
20
25
(dB)
0 500 1000 1500 2000 2500 3000 3500 4000
Frequency (Hz)
Throat
Normal
Reconstructed
Nasal consonant /m/
−15
−10
−5
0
5
10
15
20
(dB)
0 500 1000 1500 2000 2500 3000 3500 4000
Frequency (Hz)
Throat
Normal
Reconstructed
Fricative /s/
Figure 4: The LP spectra of the TM speech and the NM speech, and the estimated LP spectra, for the sound units /a/, /e/, /g/, /d/, /m/,and
/s/.
output and the LP residual derived from the TM speech) also
shows that it sounds more natural than the TM speech.
3.4. Bandwidth extension of telephone speech
The mapping technique can also be used to extend the band-
width of the narrowband (300–3400 Hz) telephone speech.
The data for this study comprises of speech simultaneously
recorded from a normal microphone at the transmitting end,
and a telephone at the receiving end. The mapping is per-
formed using the procedure described in Section 3.Here,
features from the bandlimited telephone speech form the
input for the mapping network. The features of the corre-
sponding NM speech form the target output for the network.
8 EURASIP Journal on Advances in Signal Processing
0
50
100
150
200
(dB)
0 2000 4000
Frequency (Hz)
0
50
100
150
200
(dB)
0 2000 4000
Frequency (Hz)
0
50
100
150
200
(dB)
0 2000 4000
Frequency (Hz)
Figure 5:TheLPspectraoftheTMspeechandtheNMspeech,andtheestimatedLPspectra,forasequenceofspeechframes.
0
1
2
3
4
5
6
7
8
9
Itakura distance
0 50 100 150 200 250 300 350
Frame index
Figure 6: Itakura distance between the NM and TM spectra
(dashed lines), and the NM and estimated spectra (solid lines) for a
speech utterance.
In the testing stage, wideband residual regeneration is done
using spectral folding approach [1]. This residual is used
to excite the synthesis filter constructed from the estimated
wideband LP coefficients derived from the mapping net-
work. The LP spectra of the telephone speech, the band-
width extended speech, and the wideband NM speech are
given for two differentspeechframesinFigure 7.Itisseen
that the spectra of the bandwidth extended speech are very
similar to the spectra of the wideband NM microphone
speech. In this task, the issue of reconstructing the wide-
band LP spectra alone is addressed. It has been observed
that due to the channel noise, the LP prediction error is
large for telephone speech. Hence, a s imple technique for
regeneration of wideband residual would not suffice. Fur -
ther work is necessary to manipulate the telephone resid-
ual signal for regeneration of clean, wideband residual signal.
This would further improve the quality of the bandwidth ex-
tended speech.
4. CONCLUSIONS
A method to improve the qualit y of the TM speech has been
proposed based on the speaker-dependent relationship be-
tween the spectral features of the TM speech and the NM
speech. The mapping of the spect ra has been modelled us-
ing a feedforward neur a l network. The underlying assump-
tion is that the wideband NM speech is closely related to the
narrowband TM speech. The stability of the all-pole syn-
thesis filter has been ensured while estimating the features.
The spectra of the reconstructed speech show that the higher
frequencies that were previously of low amplitude in the TM
speech are now emphasized. Thus the network was shown to
capture the functional relationship between the two spectra.
A. Shahina and B. Yegnanarayana 9
−30
−20
−10
0
10
20
30
40
(dB)
0 1000 2000 3000 4000 5000 6000 7000 8000
Frequency (Hz)
Tel eph on e
Bandwidth extended
Microphone
Segment 1
−40
−30
−20
−10
0
10
20
30
40
(dB)
0 1000 2000 3000 4000 5000 6000 7000 8000
Frequency (Hz)
Tel eph on e
Bandwidth extended
Microphone
Segment 2
Figure 7: The LP spectra of the telephone speech (dotted line), bandwidth extended speech (dashed line), and NM speech (solid line) for
four different segments of speech.
The a dvantage in this method is that distort ion due to spec-
tral discontinuities between adjacent frames is not perceived
in the reconstructed speech. In this method, only the spec-
tral features of the TM speech were modified, the excitation
source features were not modified. Our future work focusses
on replacing the source features of the TM speech with the
source features of the NM speech in order to further improve
its perceptual quality. This study shows that the proposed
mapping technique can also be effectively used for the task
of bandwidth extension of telephone speech. Her e again, we
need to address the issue of wideband regeneration of the LP
residual. This would require a fresh approach, as any simple
technique for high-frequency regeneration would not pro-
duce the desired result.
REFERENCES
[1] J. A. Fuemmeler, R. C. Hardie, and W. R. Gardner, “Tech-
niques for the regeneration of wideband speech from narrow-
band speech,” EURASIP Journal on Applied Signal Processing,
vol. 2001, no. 4, pp. 266–274, 2001.
[2] R. Hu, V. Krishnan, and D. V. Anderson, “Speech band-
width extension by improved codebook mapping towards in-
creased phonetic classification,” in Proceedings of the 9th Eu-
ropean Conference on Speech Communication and Technology
(INTERSPEECH-ICSLP ’05), pp. 1501–1504, Lisbon, Portu-
gal, September 2005.
[3] M. L. Seltzer, A. Acero, and J. Droppo, “Robust bandwidth ex-
tension of noise-corrupted narrowband speech,” in Proceed-
ings of the 9th European Conference on Speech Communication
and Technology (INTERSPEECH-ICSLP ’05), pp. 1509–1512,
Lisbon, Portugal, September 2005.
[4]J.MakhoulandM.Berouti,“High-frequencyregeneration
in speech coding systems,” in Proceedings of IEEE Interna-
tional Conference on Acoustics, Speech, and Signal Processing
(ICASSP ’79), vol. 4, pp. 428–431, Washington, DC, USA,
April 1979.
[5] B. Geiser, P. Jax, and P. Vary, “Artificial bandwidth extension
of speech supported by watermark-transmitted side informa-
tion,” in Proceedings of the 9th European Conference on Speech
Communication and Technology (INTERSPEECH-ICSLP ’05),
pp. 1497–1500, Lisbon, Portugal, September 2005.
[6] J. Epps and W. H. Holmes, “A new technique for wideband
enhancement of coded narrowband speech,” in Proceedings of
IEEE Workshop on Speech Coding, pp. 174–176, Porvoo, Fin-
land, June 1999.
[7] K Y. Park and H. S. Kim, “Narrowband to wideband conver-
sion of speech using GMM based transformation,” in Proceed-
ings of IEEE International Conference on Acoustics, Speech, and
Signal Processing (ICASSP ’00), vol. 3, pp. 1843–1846, Istanbul,
Turkey, June 2000.
[8] G. Chen and V. Parsa, “HMM-based frequency bandwidth ex-
tension for speech enhancement using line spectral frequen-
cies,” in Proceedings of IEEE International Conference on Acous-
tics, Speech, and Signal Processing (ICASSP ’04), vol. 1, pp. 709–
712, Montreal, Quebec, Canada, May 2004.
[9] B. Iser and G. Schmidt, “Bandwidth extension of telephony
speech,” EURASIP Newsletter, vol. 16, no. 2, pp. 2–24, 2005.
[10] A. Uncini, F. Gobbi, and F. Piazza, “Frequency recovery of
narrow-band speech using adaptive spline neural networks,”
in Proceedings of IEEE International Conference on Acoustics,
Speech, and Signal Processing (ICASSP ’99), vol. 2, pp. 997–
1000, Phoenix, Ariz, USA, March 1999.
[11] M. Graciarena, H. Franco, K. Sonmez, and H. Bratt, “Combin-
ing standard and throat microphones for robust speech recog-
nition,” IEEE Signal Processing Letters, vol. 10, no. 3, pp. 72–74,
2003.
[12] Z. Zhang, Z. Liu, M. Sinclair, e t al., “Multi-sensor y micro-
phones for robust speech detection, enhancement and recog-
nition,” in Proceedings of IEEE International Conference on
Acoustics, Speech, and Signal Processing (ICASSP ’04), vol. 3,
pp. 781–784, Montreal, Quebec, Canada, May 2004.
10 EURASIP Journal on Advances in Signal Processing
[13] J. R. Deller, J. G. Proakis, and J. H. L. Hansen, Discrete-Time
Processing of Speech Signals,Macmillan,NewYork,NY,USA,
1993.
[14] B. Yegnanarayana, “On timing in time-frequency analysis of
speech signals,” Sadhana, vol. 21, part 1, pp. 5–20, 1996.
[15] A. Shahina and B. Yegnanarayana, “Recognition of consonant-
vowel units in throat microphone speech,” in Proceedings of
International Conference on Natural Language Processing,pp.
85–92, Kanpur, India, December 2005.
[16] P. Ladefoged, ACourseinPhonetics, Harcourt College Publish-
ers, Orlando, Fla, USA, 2001.
[17] A. Shahina and B. Yegnanarayana, “Mapping neural networks
for bandwidth extension of narrowband speech,” in Pro cced-
ings of the 9th International Conference on Spoken Language
Processing (INTERSPEECH-ICSLP ’06), Pittsburgh, Pa, USA,
September 2006.
[18] B. Yegnanarayana, Artificial Neural Networks, Prentice-Hall,
New Delhi, India, 1999.
[19] H. Misra, S. Ikbal, and B. Yegnanarayana, “Speaker-specific
mapping for text-independent speaker recognition,” Speech
Communication, vol. 39, no. 3-4, pp. 301–310, 2003.
[20] S. Haykin, Neural Networks: A Comprehensive Foundation,
Prentice-Hall, Englewood Cliffs, NJ, USA, 1999.
A. Shahina was born in India in 1973. She
graduated in 1994 from Government. Col-
lege of Engineering-Salem, Madras Univer-
sity, India, in electronics and communica-
tion engineering. She received the M.Tech
degree in biomedical engineering from In-
dian Institute of Technology, (IIT) Madras
Chennai, India, in 1998. She was a Member
of the faculty at SSN College of Engineering,
Madras University, till 2001. Since 2002, she
is working as a Project Officer in the Computer Science and Engi-
neering Department at IIT-Madras, and is pursuing her Ph.D. de-
gree. Her research interests are in speech processing and pattern
recognition.
B. Yegnanarayana is a Professor and Mi-
crosoft Chair at IIIT Hyderabad. Prior to
joining IIIT, he was a Professor in the De-
partment of Computer Science and Engi-
neering at IIT Madras, India, from 1980 to
2006. He was a Visiting Associate Profes-
sor of computer science at Carnegie-Mellon
University in USA from 1977 to 1980. He
was a Member of the faculty at the Indian
Institute of Science (IISc), Bangalore, from
1966 to 1978. He got B.E., M.E., and Ph.D. (all in electrical commu-
nication engineering) degrees from IISc, Bangalore, in 1964, 1966,
and 1974, respectively. His research interests are in signal process-
ing, speech, image processing, and neural networks. He has pub-
lished over 300 papers in these areas in IEEE and other interna-
tional journals, and in the proceedings of national and interna-
tional conferences. He is also the author of the book “Artificial Neu-
ral Networks,” published by Prentice-Hall of India in 1999. He has
supervised 21 Ph.D. and 31 M.S. theses. He is a Fellow of the Indian
National Academy of Engineering, a Fellow of the Indian National
Science Academy, and a Fellow of the Indian Academy of Sciences.
He was the recipient of the 3rd IETE Professor S. V. C. Aiya Memo-
rial Award in 1996. He received the Professor S. N. Mitra Memorial
Award for the year 2006 from the Indian National Academy of En-
gineering for his significant and unique contributions in speech
processing applications, and for pioneering work in teaching and
research in signal processing and neural networks.