Báo cáo hóa học: " Research Article Analysis of Human Electrocardiogram for Biometric Recognition" pptx
Bạn đang xem bản rút gọn của tài liệu. Xem và tải ngay bản đầy đủ của tài liệu tại đây (1.84 MB, 11 trang )
Hindawi Publishing Corporation
EURASIP Journal on Advances in Signal Processing
Volume 2008, Article ID 148658, 11 pages
doi:10.1155/2008/148658
Research Article
Analysis of Human Electrocardiogram for
Biometric Recognition
Yongjin Wang, Foteini Agrafioti, Dimitrios Hatzinakos, and Konstantinos N. Plataniotis
The Edward S. Rogers Sr., Department of Electrical and Computer Eng ineering, University of Toronto,
10 King’s College Road, Toronto, ON, Canada M5S 3G4
Correspondence should be addressed to Yongjin Wang,
Received 3 May 2007; Accepted 30 August 2007
Recommended by Arun Ross
Security concerns increase as the technology for falsification advances. There are strong evidences that a difficult to falsify biometric
trait, the human heartbeat, can be used for identity recognition. Existing solutions for biometric recognition from electrocardio-
gram (ECG) signals are based on temporal and amplitude distances between detected fiducial points. Such methods rely heavily on
the accuracy of fiducial detection, which is still an open problem due to the difficulty in exact localization of wave boundaries. This
paper presents a systematic analysis for human identification from ECG data. A fiducial-detection-based framework that incorpo-
rates analytic and appearance attributes is first introduced. The appearance-based approach needs detection of one fiducial point
only. Further, to completely relax the detection of fiducial points, a new approach based on autocorrelation (AC) in conjunction
with discrete cosine transform (DCT) is proposed. Experimentation demonstrates that the AC/DCT method produces comparable
recognition accuracy with the fiducial-detection-based approach.
Copyright © 2008 Yongjin Wang et al. This is an open access article distributed under the Creative Commons Attribution License,
which permits unrestricted use, distribution, and reproduction in any medium, provided the original work is properly cited.
1. INTRODUCTION
Biometric recognition provides airtight security by identify-
ing an individual based on the physiological and/or behav-
ioral characteristics [1]. A number of biometrics modalities
have been investigated in the past, examples of which include
physiologicaltraitssuchasface,fingerprint,iris,andbehav-
ioral characteristics like gait and keystroke. However, these
biometrics modalities either can not provide reliable perfor-
mance in terms of recognition accuracy (e.g., gait, keystroke)
or are not robust enough against falsification. For instance,
face is sensitive to artificial disguise, fingerprint can be recre-
ated using latex, and iris can be falsified by using contact
lenses with copied iris features printed on.
Analysis of electrocardiogram (ECG) as a tool for clini-
cal diagnosis has been an active research area in the past two
decades. Recently, a few proposals [2–7] suggested the possi-
bility of using ECG as a new biometrics modality for human
identity recognition. The validity of using ECG for biomet-
ric recognition is supported by the fact that the physiologi-
cal and geometrical differences of the heart in different indi-
viduals display certain uniqueness in their ECG signals [8].
Human individuals present different patterns in their ECG
regarding wave shape, amplitude, PT interval, due to the
difference in the physical conditions of the heart [9]. Also,
the permanence characteristic of ECG pulses of a person was
studiedin[10], by noting that the similarities of healthy sub-
ject’s pulses at different time intervals, from 0 to 118 days,
can be observed when they are plotted on top of each other.
These results suggest the distinctiveness and stability of ECG
as a biometrics modality. Further, ECG signal is a life indi-
cator, and can be used as a tool for liveness detection. Com-
paring with other biometric traits, the ECG of a human is
more universal, and difficult to be falsified by using fraudu-
lent methods. An ECG-based biometric recognition system
can find wide applications in physical access control, medi-
cal records management, as well as government and forensic
applications.
To b u i l d an e fficient human identification system, the ex-
traction of features that can truly represent the distinctive
characteristics of a person is a challenging problem. Previ-
ously proposed methods for ECG-based identity recognition
use attributes that are temporal and amplitude distances be-
tween detected fiducial points [2–7]. Firstly, focusing on only
2 EURASIP Journal on Advances in Signal Processing
L
P
S
T
Q
S
P
R
T
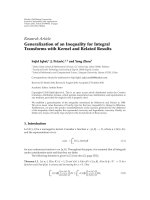
Figure 1: Basic shape of an ECG heartbeat signal.
a few fiducial points, the representation of discriminant char-
acteristics of ECG signal might be inadequate. Secondly, their
methods rely heavily on the accurate localization of wave
boundaries, which is generally very difficult. In this paper, we
present a systematic analysis for ECG-based biometric recog-
nition. An analytic-based method that combines temporal
and amplitude features is first presented. The analytic fea-
tures capture local information in a heartbeat signal. As such,
the performance of this method depends on the accuracy of
fiducial points detection and discriminant power of the fea-
tures. To address these problems, an appearance-based fea-
ture extraction method is suggested. The appearance-based
method captures the holistic patterns in a heartbeat signal,
and only the detection of the peak is necessary. This is gener-
ally easier since R corresponds to the highest and sharpest
peak in a heartbeat. To better utilize the complementary
characteristics of different types of features and improve the
recognition accuracy, we propose a hierarchical scheme for
the integration of analytic and appearance attributes. Fur-
ther, a novel method that does not require any waveform
detection is proposed. The proposed approach depends on
estimating and comparing the significant coefficients of the
discrete cosine transform (DCT) of the autocorrelated heart-
beat signals. The feasibility of the introduced solutions is
demonstrated using ECG data from two public databases,
PTB [11]andMIT-BIH[12]. Experimentation shows that
the proposed methods produce promising results.
The remainder of this paper is organized as follows.
Section 2 gives a brief description of fundamentals of ECG.
Section 3 provides a review of related works. The proposed
methods are discussed in Section 4.InSection 5,wepresent
the experimental results along withdetailed discussion. Con-
clusion and future works are presented in Section 6.
2. ECG BASICS
An electrocardiogram (ECG) signal describes the electrical
activity of the heart. The electrical activity is related to the
impulses that travel through the heart. It provides informa-
tion about the heart rate, rhythm, and morphology. Nor-
mally, ECG is recorded by attaching a set of electrodes on
the body surface such as chest, neck, arms, and legs.
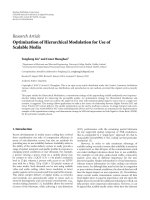
A typical ECG wave of a normal heartbeat consists of
a P wave, a QRS complex, and a T wave. Figure 1 depicts
the basic shape of a healthy ECG heartbeat signal. The P
wave reflects the sequential depolarization of the right and
left atria. It usually has positive polarity, and its duration
is less than 120 milliseconds. The spectral characteristic of
anormalP wave is usually considered to be low frequency,
below 10–15 Hz. The QRS complex corresponds to depolar-
ization of the right and left ventricles. It lasts for about 70–
110 milliseconds in a normal heartbeat, and has the largest
amplitude of the ECG waveforms. Due to its steep slopes, the
frequency content of the QRS complex is considerably higher
than that of the other ECG waves, and is mostly concentrated
in the interval of 10–40 Hz. The T wave reflects ventricular
repolarization and extends about 300 milliseconds after the
QRS complex. The position of the T wave is strongly depen-
dent on heart rate, becoming narrower and closer to the QRS
complex at rapid rates [13].
3. RELATED WORKS
Although extensive studies have been conducted for ECG
based clinical applications, the research for ECG-based bio-
metric recognition is still in its infant stage. In this section,
we provide a review of the related works.
Biel et al. [2] are among the earliest effort that demon-
strates the possibility of utilizing ECG for human identifi-
cation purposes. A set of temporal and amplitude features
are extracted from a SIEMENS ECG equipment directly. A
feature selection algorithm based on simple analysis of cor-
relation matrix is employed to reduce the dimensionality of
features. Further selection of feature set is based on experi-
ments. A multivariate analysis-based method is used for clas-
sification. The system was tested on a database of 20 per-
sons, and 100% identification rate was achieved by using em-
pirically selected features. A major drawback of Biel et al.’s
method is the lack of automatic recognition due to the em-
ployment of specific equipment for feature extraction. This
limits the scope of applications.
Irvine et al. [3] introduced a system to utilize heart rate
variability (HRV) as a biometric for human identification.
Israel et al. [4] subsequently proposed a more extensive set
of descriptors to characterize ECG trace. An input ECG sig-
nal is first preprocessed by a bandpass filter. The peaks are
established by finding the local maximum in a region sur-
rounding each of the P, R, T complexes, and minimum ra-
dius curvature is used to find the onset and end of P and
T waves. A total number of 15 features, which are time du-
ration between detected fiducial points, are extracted from
each heartbeat. A Wilks’ Lambda method is applied for fea-
ture selection and linear discriminant analysis for classifica-
tion. This system was tested on a database of 29 subjects with
100% human identification rate and around 81% heartbeat
recognition rate can be achieved. In a later work, Israel et al.
[5] presented a multimodality system that integrate face and
ECG signal for biometric identification. Israel et al.’s method
provides automatic recognition, but the identification accu-
racy with respect to heartbeat is low due to the insufficient
representation of the feature extraction methods.
Shen et al. [6] introduced a two-step scheme for iden-
tity verification from one-lead ECG. A template matching
method is first used to compute the correlation coefficient for
Yo n g ji n Wa n g e t a l . 3
comparison of two QRS complexes. A decision-based neural
network (DBNN) approach is then applied to complete the
verification from the possible candidates selected with tem-
plate matching. The inputs to the DBNN are seven temporal
and amplitude features extracted from QRST wave. The ex-
perimental results from 20 subjects showed that the correct
verification rate was 95% for template matching, 80% for the
DBNN, and 100% for combining the two methods. Shen [7]
extended the proposed methods in a larger database that con-
tains 168 normal healthy subjects. Template matching and
mean square error (MSE) methods were compared for pre-
screening, and distance classification and DBNN compared
for second-level classification. The features employed for the
second-level classification are seventeen temporal and ampli-
tude features. The best identification rate for 168 subjects is
95.3% using template matching and distance classification.
In summary, existing works utilize feature vectors that
are measured from different parts of the ECG signal for clas-
sification. These features are either time duration, or am-
plitude differences between fiducial points. However, accu-
rate fiducial detection is a difficult task since current fidu-
cial detection machines are built solely for the medical field,
where only the approximate locations of fiducial points are
required for diagnostic purposes. Even if these detectors are
accurate in identifying exact fiducial locations validated by
cardiologists, there is no universally acknowledged rule for
defining exactly where the wave boundaries lie [14]. In this
paper, we first generalize existing works by applying similar
analytic features, that is, temporal and amplitude distance
attributes. Our experimentation shows that by using ana-
lytic features alone, reliable performance cannot be obtained.
To improve the identification accuracy, an appearance-based
approach which only requires detection of the R peak is
introduced, and a hierarchical classification scheme is pro-
posed to integrate the two streams of features. Finally, we
present a method that does not need any fiducial detection.
This method is based on classification of coefficients from
the discrete cosine transform (DCT) of the autocorrelation
(AC) sequence of windowed ECG data segments. As such,
it is insensitive to heart rate variations, simple and compu-
tationally efficient. Computer simulations demonstrate that
it is possible to achieve high recognition accuracy without
pulse synchronization.
4. METHODOLOGY
Biometrics-based human identification is essentially a pat-
tern recognition problem which involves preprocessing, fea-
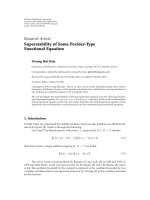
ture extraction, and classification. Figure 2 depicts the gen-
eral block diagram of the proposed methods. In this pa-
per, we introduce two frameworks, namely, feature extrac-
tion with/without fiducial detection, for ECG-based biomet-
ric recognition.
4.1. Preprocessing
The collected ECG data usually contain noise, which in-
clude low-frequency components that cause baseline wander,
and high-frequency components such as power-line interfer-
ECG
Preprocessing
Feature
extraction
Classification
ID
Figure 2: Block diagram of proposed systems.
ences. Generally, the presence of noise will corrupt the signal,
and make the feature extraction and classification less accu-
rate. To minimize the negative effects of the noise, a denois-
ing procedure is important. In this paper, we use a Butter-
worth bandpass filter to perform noise reduction. The cutoff
frequencies of the bandpass filter are selected as 1 Hz–40 Hz
based on empirical results. The first and last heartbeats of
the denoised ECG records are eliminated to get full heartbeat
signals. A thresholding method is then applied to remove the
outliers that are not appropriate for training and classifica-
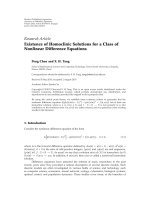
tion. Figure 3 gives a graphical illustration of the applied pre-
processing approach.
4.2. Feature extraction based on fiducial detection
After preprocessing, the R peaks of an ECG trace are localized
by using a QRS detector, ECGPUWAVE [15, 16]. The heart-
beats of an ECG record are aligned by the R peak position
and truncated by a window of 800 milliseconds centered at
R. This window size is estimated by heuristic and empirical
results such that the P and T waves can also be included and
therefore most of the information embedded in heartbeats is
retained [17].
4.2.1. Analytic feature extraction
For the purpose of comparative study, we follow similar fea-
tureextractionprocedureasdescribedin[4, 5]. The fidu-
cial points are depicted in Figure 1.Aswehavedetectedthe
R peak, the Q, S, P,andT positions are localized by find-
ing local maxima and minima separately. To find the L
, P
,
S
,andT
points, we use a method as shown in Figure 4(a).
The X and Z points are fixed and we search downhill from X
to find the point that maximizes the sum of distances a + b.
Figure 4(b) gives an example of fiducial points localization.
The extracted attributes are temporal and amplitude dis-
tances between these fiducial points. The 15 temporal fea-
tures are exactly the same as described in [4, 5], and they are
normalized by P
T
distance to provide less variability with
respect to heart rate. Figure 5 depicts these attributes graph-
ically, while Table1 lists all the extracted analytic features.
4.2.2. Appearance feature extraction
Principal component analysis (PCA) and linear discrimi-
nant analysis (LDA) are transform domain methods for data
reduction and feature extraction. PCA is an unsupervised
learning technique which provides an optimal, in the least
mean square error sense, representation of the input in a
lower-dimensional space. Given a training set Z
={Z
i
}
C
i
=1
,
containing C classes with each class Z
i
={z
ij
}
C
i
j=1
consist-
ing of a number of heartbeats z
ij
,atotalofN =
C
i
=1
C
i
4 EURASIP Journal on Advances in Signal Processing
Table 1: List of extracted analytic features.
Extracted features
Te m p o r al
1. RQ 4 RL
7. RS
10. S
T
13. PT
2. RS 5. RP
8. RT
11. ST 14. LQ
3. RP 6. RT 9. L
P
12. PQ 15. ST
Amplitude
16. PL
17. PQ 18. RQ
19. RS 20. TS 21. TT
−600
−400
−200
0
200
400
600
800
1000
1200
00.511.52
×10
4
(a)
−400
−200
0
200
400
600
800
1000
1200
00.511.52
×10
4
(b)
(c) (d)
Figure 3: Preprocessing ((a) original signal; (b) noise reduced signal; (c) original R-peak aligned signal; (d) R-peak aligned signal after
outlier removal).
Z
X
a
b
max(a + b)
(a) (b)
Figure 4: Fiducial points determination.
heartbeats, the PCA is applied to the training set Z to find
the M eigenvectors of the covariance matrix
S
cov
=
1
N
C
i=1
C
i
j=1
(z
ij
− z)(z
ij
− z)
T
,(1)
where
z = 1/N
C
i
=1
C
i
j=1
z
ij
is the average of the ensemble.
The eigen heartbeats are the first M(
≤ N) eigenvectors corre-
sponding to the largest eigenvalues, denoted as Ψ. The orig-
inal heartbeat is transformed to the M-dimension subspace
by a linear mapping
y
ij
= Ψ
T
z
ij
− z
,(2)
where the basis vectors Ψ are orthonormal. The subsequent
classification of heartbeat patterns can be performed in the
transformed space [18].
LDA is another representative approach for dimension
reduction and feature extraction. In contrast to PCA, LDA
utilizes supervised learning to find a set of M feature basis
vectors
{ψ
m
}
M
m
=1
in such a way that the ratio of between-class
and within-class scatters of the training sample set is maxi-
mized. The maximization is equivalent to solve the following
eigenvalue problem
Ψ
= arg max
ψ
|Ψ
T
S
b
Ψ|
|Ψ
T
S
w
Ψ|
, Ψ ={ψ
1
, , ψ
M
},(3)
Yo n g ji n Wa n g e t a l . 5
18 17 16 20 21 19
R
P
T
L
P
S
T
Q
S
910
1112
14 15
12
57
36
48
13
Figure 5: Graphical demonstration of analytic features.
where S
b
and S
w
are between-class and within-class scatter
matrices, and can be computed as follows:
S
b
=
1
N
C
i=1
C
i
z
i
− z
z
i
− z
T
,
S
w
=
1
N
C
i=1
C
i
j=1
z
ij
− z
i
z
ij
− z
i
T
,
(4)
where
z
i
= 1/C
i
C
i
j=1
z
ij
is the mean of class Z
i
. When S
w
is nonsingular, the basis vectors Ψ sought in (3) correspond
to the first M most significant eigenvectors of (S
−1
w
S
b
), where
the “significant” means that the eigenvalues corresponding
to these eigenvectors are the first M lagest ones. For an in-
put heartbeat z, its LDA-based feature representation can be
obtained simply by a linear projection, y
= Ψ
T
z [18].
4.3. Feature extraction without fiducial detection
The proposed method for feature extraction without fidu-
cial detection is based on a combination of autocorrelation
and discrete cosine transform. We refer to this method as the
AC/DCT method [19]. The AC/DCT method involves four
stages: (1) windowing, where the preprocessed ECG trace is
segmented into nonoverlapping windows, with the only re-
striction that the window has to be longer than the average
heartbeat length so that multiple pulses are included; (2) es-
timation of the normalized autocorrelation of each window;
(3) discrete cosine transform over L lags of the autocorre-
lated signal; and (4) classification based on significant coeffi-
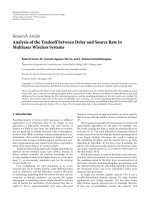
cients of DCT. A graphical demonstration of different stages
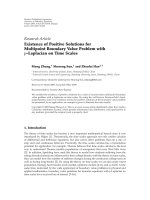
is presented in Figure 6.
The ECG is a nonperiodic but highly repetitive signal.
The motivation behind the employment of autocorrelation-
based features is to detect the nonrandom patterns. Autocor-
relation embeds information about the most representative
characteristics of the signal. In addition, AC is used to blend
into a sequence of sums of products samples that would oth-
erwise need to be subjected to fiducial detection. In other
words, it provides an automatic shift invariant accumulation
of similarity features over multiple heartbeat cycles. The au-
tocorrelation coefficients
R
xx
[m] can be computed as follows:
R
xx
[m] =
N−|m|−1
i=0
x[i]x[i + m]
R
xx
[0]
,(5)
where x[i] is the windowed ECG for i
= 0, 1, ,(N −|m|−
1), x[i +m] is the time-shifted version of the windowed ECG
with a time lag of m
= 0, 1, , L − 1), L N. The divi-
sion with the maximum value,
R
xx
[0], cancels out the bias-
ing factor and this way either biased or unbiased autocorrela-
tion estimation can be performed. The main contributors to
the autocorrelated signal are the P wave, the QRS complex,
and the T wave. However, even among the pulses of the same
subject, large variations in amplitude present and this makes
normalization a necessity. It should be noted that a window
is allowed to blindly cut out the ECG record, even in the mid-
dle of a pulse. This alone releases the need for exact heartbeat
localization.
Our expectations for the autocorrelation, to embed sim-
ilarity features among records of the same subject, are con-
firmed by the results of Figure 7, which shows the
R
xx
[m]ob-
tained from different ECG windows of the same subject from
two different records in the PTB database taken at a different
time.
Autocorrelation offers information that is very impor-
tant in distinguishing subjects. However, the dimensionality
of autocorrelation features is considerably high (e.g., L
=
100, 200,300). The discrete cosine transform is then applied
to the autocorrelation coefficients for dimensionality reduc-
tion. The frequency coefficients are estimated as follows:
Y[u]
= G[u]
N−1
i=0
y[i]
π cos(2i +1)u
2N
,(6)
where N is the length of the signal y[i]fori
= 0, 1, ,(N −
|
m|−1). For the AC/DCT method y[i] is the autocorrelated
ECG obtained from (5). G[u]isgivenfrom
G(k)
=
⎧
⎪
⎪
⎪
⎪
⎨
⎪
⎪
⎪
⎪
⎩
1
N
, k
= 0,
2
N
,1
≤ k ≤ N − 1.
(7)
The energy compaction property of DCT allows repre-
sentation in lower dimensions. This way, near zero compo-
nents of the frequency representation can be discarded and
the number of important coefficients is eventually reduced.
Assuming we take an L-point DCT of the autocorrelated
signal, only K
L nonzero DCT coefficients will contain
significant information for identification. Ideally, from a fre-
quency domain perspective, the K most significant coeffi-
cients will correspond to the frequencies between the bounds
of the bandpass filter that was used in preprocessing. This is
6 EURASIP Journal on Advances in Signal Processing
−500
0
500
1000
1500
Vo lt a g e ( m V )
0 1000 2000 3000 4000 5000
Time (ms)
(a) 5 seconds of ECG from subject A
−500
0
500
1000
Vo lt a g e ( m V )
0 1000 2000 3000 4000 5000
Time (ms)
(b) 5 seconds of ECG from subject B
−0.5
0
0.5
1
Normalized power
0 2000 4000 6000 8000 10000
Time (ms)
(c) AC of A
−0.5
0
0.5
1
Normalized power
0 2000 4000 6000 8000 10000
Time (ms)
(d) AC of B
−0.5
0
0.5
1
Normalized power
0 50 100 150 200 250 300
Time (ms)
(e) 300 AC Coefficients of A
−0.5
0
0.5
1
Normalized power
0 50 100 150 200 250 300
Time (ms)
(f) 300 AC Coefficients of B
−1
0
1
2
Normalized power
0 5 10 15 20 25 30 35 40
DCT coefficients
(g) Zoomed DCT plot of A
−1
0
1
2
3
Normalized power
0 5 10 15 20 25 30 35 40
DCT coefficients
(h) Zoomed DCT plot of B
Figure 6: (a-b) 5 seconds window of ECG from two subjects of the PTB dataset, subject A and B. (c-d) The normalized autocorrelation
sequence of A and B. (e-f) Zoom in to 300 AC coefficients from the maximum form different windows of subject A and B. (g-h) DCT of the
300 AC coefficients from all ECG windows of subject A and B, including the windows on top. Notice that the same subject has similar AC
and DCT shape.
because after the AC operation, the bandwidth of the signal
remained the same.
5. EXPERIMENTAL RESULTS
To evaluate the performance of the proposed methods, we
conducted our experiments on two sets of public databases:
PTB [11]andMIT-BIH[12]. The PTB database is offered
from the National Metrology Institute of Germany and it
contains 549 records from 294 subjects. Each record of the
PTB database consists of the conventional 12-leads and 3
Frank leads ECG. The signals were sampled at 1000 Hz
with a resolution of 0.5 μV. The duration of the record-
ings vary for each subject. The PTB database contains a
large collection of healthy and diseased ECG signals that
were collected at the Department of Cardiology of Uni-
versity Clinic Benjamin Franklin in Berlin. A subset of 13
healthy subjects of different age and sex was selected from
the database to test our methods. The criteria for data selec-
tion are healthy ECG waveforms and at least two recordings
for each subject. In our experiments, we use one record from
each subject to form the gallery set, and another record for
the testing set. The two records were collected a few years
apart.
The MIT-BIH Normal Sinus Rhythm Database contains
18 ECG recordings from different subjects. The recordings of
the MIT database were collected at the Arrhythmia Labora-
tory of Boston’s Beth Israel Hospital. The subjects included
in the database did not exhibit significant arrhythmias. The
MIT- BIH Normal Sinus Rhythm Database was sampled at
128 Hz. A subset of 13 subjects was selected to test our meth-
ods. The selection of data was based on the length of the
recordings. The waveforms of the remaining recordings have
many artifacts that reduce the valid heartbeat information,
and therefore were not used in our experiments. Since the
database only offers one record for each subject, we parti-
tioned each record into two halves and use the first half as
the gallery set and the second half as the testing set.
Yo n g ji n Wa n g e t a l . 7
−0.4
−0.2
0
0.2
0.4
0.6
0.8
1
Normalized power
0 50 100 150 200 250 300
Time (ms)
Figure 7: AC sequences of two different records taken at different
times from the same subject of the PTB dataset. Sequences from the
same record are plotted in the same shade.
5.1. Feature extraction based on fiducial detection
In this section, we present experimental results by using fea-
tures extracted with fiducial points detection. The evaluation
is based on subject and heartbeat recognition rate. Subject
recognition accuracy is determined by majority voting, while
heartbeat recognition rate corresponds to the percentage of
correctly identified individual heartbeat signals.
5.1.1. Analytic features
To provide direct comparison with existing works [4, 5], ex-
periments were first performed on the 15 temporal features
only, using a Wilks’ Lambda-based stepwise method for fea-
ture selection, and linear discriminant analysis (LDA) for
classification. Wilks’ Lambda measures the differences be-
tween the mean of different classes on combinations of de-
pendent variables, and thus can be used as a test of the signif-
icance of the features. In Section 4.2.2, we have discussed the
LDA method for feature extraction. When LDA is used as a
classifier, it assumes a discriminant function for each class as
a linear function of the data. The coefficients of these func-
tions can be found by solving the eigenvalue problem as in
(3). An input data is classified into the class that gives the
greatest discriminant function value. When LDA is used for
classification, it is applied on the extracted features, while for
feature extraction, it is applied on the original signal.
In this paper, the Wilks’ Lambda-based feature selection
and LDA-based classification are implemented in SPSS (a
trademark of SPSS Inc. USA). In our experiments, the 15
temporal features produce subject recognition rate of 84.61%
and 100%, and heartbeat recognition rate of 74.45% and
74.95% for PTB and MIT-BIH datasets, respectively.
Figure 8 shows the contingency matrices when only tem-
poral features are used. It can be observed that the heartbeats
of an individual are confused with many other subjects. Only
the heartbeats from 2 subjects in PTB and 1 subject in MIT-
BIH are 100% correctly identified. This demonstrates that
the extracted temporal features cannot efficiently distinguish
different subjects. In our second experiment, we add ampli-
tude attributes to the feature set. This approach achieves sig-
nificant improvement with subject recognition rate of 100%
for both datasets, heartbeat recognition rate of 92.40% for
PTB, and 94.88% for MIT-BIH. Figure 9 shows the all-class
scatter plot in the two experiments. It is clear that different
classes are much better separated by including amplitude fea-
tures.
5.1.2. Appearance features
In this paper, we compare the performance of PCA and LDA
using the nearest neighbor (NN) classifier. The similarity
measure is based on Euclidean distance. An important issue
in appearance-based approaches is how to find the optimal
parameters for classification. For a C class problem, LDA can
reduce the dimensionality to C
− 1 due to the fact that the
rank of the between-class matrix cannot go beyond C
− 1.
However, these C
− 1 parameters might not be the optimal
ones for classification. Exhaustive search is usually applied
to find the optimal LDA-domain features. In PCA parame-
ter determination, we use a criterion by taking the first M
eigenvectors that satisfy
M
i
=1
λ
i
/
N
i
=1
λ
i
≥ 99%, where λ
i
is
the eigenvalue and N is the dimensionality of feature space.
Ta ble 2 shows the experimental results of applying PCA
and LDA on PTB and MIT-BIH datasets. Both PCA and LDA
achieve better identification accuracy than analytic features.
This reveals that the appearance-based analysis is a good
tool for human identification from ECG. Although LDA is
class specific and normally performs better than PCA in face
recognition problems [18], since PCA performs better in our
particular problem, we use PCA for the analysis hereafter.
5.1.3. Feature integration
Analytic and appearance-based features are two complemen-
tary representations of the characteristics of the ECG data.
Analytic features capture local information, while appear-
ance features represent holistic patterns. An efficient inte-
gration of these two streams of features will enhance the
recognition performance. A simple integration scheme is to
concatenate the two streams of extracted features into one
vector and perform classification. The extracted analytic fea-
tures include both temporal and amplitude attributes. For
this reason, it is not suitable to use a distance metric for clas-
sification since some features will overpower the results. We
therefore use LDA as the classifier, and Wilks’ Lambda for
feature selection. This method achieves heartbeat recogni-
tion rate of 96.78% for PTB and 97.15% for MIT-BIH. The
subject recognition rate is 100% for both datasets. In the
MIT-BIH dataset, the simple concatenation method actually
degrades the performance than PCA only. This is due to the
suboptimal characteristic of the feature selection method, by
which optimal feature set cannot be obtained.
To better utilize the complementary characteristics of an-
alytic and appearance attributes, we propose a hierarchical
8 EURASIP Journal on Advances in Signal Processing
Table 2: Experimental results of PCA and LDA.
PTB MIT-BIH
Subject Heartbeat Subject Heartbeat
PCA 100% 95.55% 100% 98.48%
LDA 100% 93.01% 100% 98.48%
Known inputs
Detected output
123456 7 8910111213
1
2
3
4
5
6
7
8
9
10
11
12
13
96
84
100
94
23
107
114
110
21
61
79
91
107
000200 0304101
01
0
19 3 0 4 2 17 0 0 0
020 02 2 0 0 9 0 0 0 0
1 4 0 3 0 0 0 2 21 15 0 2
0000 00 001000
00551 0 100000
0006415 004008
0011820 0 43000
110000 0 0 01500
000020 0 00 004
21000000 0220 00
000001 0 0000 0
10000200 001320
PTB: subject recognition rate: 11/13
= 84.61%, heartbeat recognition rate: 74.45%
(a)
Known inputs
Detected output
123456 7 8910111213
1
2
3
4
5
6
7
8
9
10
11
12
13
30
23
35
33
28
38
22
30
26
35
35
38
22
05000 0 000000
0 0000 0 020200
14 20 0 2 2 0 0 9 0 0 1 1
000 01 0 020301
0000 01 100005
00001 1 000001
102340 000059
1010000 00000
0403000 0 0102
0001000 01 001
0307000 010 20
000021 1 0000 0
101013012 10006
MIT-BIH: subject recognition rate: 13/13
= 100%, heartbeat recognition rate: 74.95%
(b)
Figure 8: Contingency matrices by using temporal features only.
scheme for feature integration. A central consideration in
our development of classification scheme is trying to change
a large-class-number problem into a small-class-number
problem. In pattern recognition, when the number of classes
is large, the boundaries between different classes tend to be
complex and hard to separate. It will be easier if we can re-
duce the possible number of classes and perform classifica-
tion in a smaller scope [17]. Using a hierarchical architecture,
we can first classify the input into a few potential classes, and
a second-level classification can be performed within these
candidates.
Figure 10 shows the diagram of the proposed hierarchi-
cal scheme. At the first step, only analytic features are used
for classification. The output of this first-level classification
provides the candidate classes that the entry might belong
to. If all the heartbeats are classified as one subject, the deci-
sion module outputs this result directly. If the heartbeats are
classified as a few different subjects, a new PCA-based classi-
fication module, which is dedicated to classify these confused
subjects, is then applied. We select to perform classification
using analytic features first due to the simplicity in feature
selection. A feature selection in each of the possible combi-
nations of the classes is computationally complex. By using
PCA, we can easily set the parameter selection as one crite-
rion and important information can be retained. This is well
supported by our experimental results. The proposed hierar-
chical scheme achieves subject recognition rate of 100% for
both datasets, and heartbeat recognition accuracy of 98.90%
for PTB and 99.43% for MIT-BIH.
A diagrammatic comparison of various feature sets and
classification schemes is shown in Figure 11.Theproposed
hierarchical scheme produces promising results in heartbeat
recognition. This “divide and conquer” mechanism maps
global classification into local classification and thus reduces
the complexity and difficulty. Such hierarchical architecture
is general and can be applied to other pattern recognition
problems as well.
5.2. Feature extraction without fiducial detection
In this section, the performance of the AC/DCT method
is reported. The similarity measure is based on normalized
Yo n g ji n Wa n g e t a l . 9
−8
−6
−4
−2
0
2
4
6
8
10
Function 2
−20 −10 0 10 20
Function 1
Canonical discriminant functions
(a)
−20
−10
0
10
20
Function 2
−20 −10 0 10 20
Function 1
Canonical discriminant functions
(b)
−6
−4
−2
0
2
4
6
8
Function 2
−10 0 10 20
Function 1
Canonical discriminant functions
(c)
−20
−10
0
10
20
Function 2
−20 −10 0 10 20
Function 1
Canonical discriminant functions
(d)
Figure 9: All-class scatter plot ((a)-(b) PTB; (c)-(d) MIT-BIH; (a)-(c) temporal features only; (b)-(d) all analytic features).
Table 3: Experimental results from classification of the PTB dataset using different AC lags.
LK
Subject Window
recognition rate recognition rate
60 5 11/13 176/217
90 8 11/13 173/217
120 10 11/13 175/217
150 12 12/13 189/217
180 15 12/13 181/217
210 17 12/13 186/217
240 20 13/13 205/217
270 22 11/13 174/217
300 24 12/13 195/217
Euclidean distance, and the nearest neighbor (NN) is used
as the classifier. The normalized Euclidean distance between
two feature vectors x
1
and x
2
is defined as
D
x
1
, x
2
=
1
V
x
1
− x
2
T
x
1
− x
2
,(8)
where V is the dimensionality of the feature vectors, which
is the number of DCT coefficients in the proposed method.
This factor is there to assure fair comparisons for different
dimensions that x might have.
By applying a window of 5 milliseconds length with no
overlapping, different number of windows are extracted from
every subject in the databases. The test sets for classification
were formed by a total of 217 and 91 windows from the PTB
and MIT-BIH datasets, respectively. Several different window
lengths that have been tested show approximately the same
10 EURASIP Journal on Advances in Signal Processing
Table 4: Experimental results from classification of the MIT-BIH dataset using different AC lags.
LK
Subject Window
recognition rate recognition rate
60 38 13/13 89/91
90 57 12/13 69/91
120 75 11/13 64/91
150 94 13/13 66/91
180 113 12/13 61/91
210 132 11/13 56/91
240 150 8/13 44/91
270 169 8/13 43/91
300 188 8/13 43/91
ECG
ID
Preprocessing
Analytic
features
LDA
classifier
NN
classifier
PCA
Decision
module
Figure 10: Block diagram of hierarchical scheme.
70
75
80
85
90
95
100
Heartbeat recognition rate (%)
Te m p o r a l
Analytic
PCA
Concatenation
Hierarchical
PTB
MIT-BIH
Figure 11: Comparison of experimental results.
classification performance, as long as multiple pulses are in-
cluded. The normalized autocorrelation has been estimated
using (5), over different AC lags. The DCT feature vector of
the autocorrelated ECG signal is evaluated and compared to
the corresponding DCT feature vectors of all subjects in the
database to determine the best match. Figure 12 shows three
DCT coefficients for all subjects in the PTB dataset. It can be
observed that different classes are well distinguished.
Ta ble s 3 and 4 present the results of the PTB and MIT-
BIH datasets, respectively, with L denotes the time lag for
AC computation, and K represents number of DCT coeffi-
cients for classification. The number of DCT coefficients is
selected to correspond to the upper bound of the applied
bandpass filter, that is, 40 Hz. The highest performance is
0
0.2
0.4
0.6
0.8
1
1.2
1.4
Coefficient 14
0.4
0.3
0.2
0.1
0
Coefficient 7
0
1
2
3
4
5
Coefficient 1
Figure 12: 3D plot of DCT coefficients from 13 subjects of the PTB
dataset.
achieved when an autocorrelation lag of 240 for the PTB and
60 for the MIT-BIH datasets are used. These windows corre-
spond approximately to the QRS and T wave of each datasets.
The difference in the lags that offer highest classification rate
between the two datasets is due to the different sampling fre-
quencies.
The results presented in Tables 3 and 4 show that it is pos-
sible to have perfect subject identification and very high win-
dow recognition rate. The AC/DCT method offers 94.47%
and 97.8% window recognition rate for the PTB and MIT-
BIH datasets, respectively.
The results of our experiments demonstrate that an ECG-
based identification method without fiducial detection is
possible. The proposed method provides an efficient, robust
and computationally efficient technique for human identifi-
cation.
6. CONCLUSION
In this paper, a systematic analysis of ECG-based biometric
recognition was presented. An analytic-based feature extrac-
tion approach which involves a combination of temporal and
amplitude features was first introduced. This method uses
Yo n g ji n Wa n g e t a l . 11
local information for classification, therefore is very sensitive
to the accuracy of fiducial detection. An appearance-based
method, which involves the detection of only one fiducial
point, was subsequently proposed to capture holistic patterns
of the ECG heartbeat signal. To better utilize the complemen-
tary characteristics of analytic and appearance attributes, a
hierarchical data integration scheme was proposed. Experi-
mentation shows that the proposed methods outperform ex-
isting works.
To completely relax fiducial detection, a novel method,
termed AC/DCT, was proposed. The AC/DCT method cap-
tures the repetitive but nonperiodic characteristic of ECG
signal by computing the autocorrelation coefficients. Dis-
crete cosine transform is performed on the autocorrelated
signal to reduce the dimensionality while preserving the sig-
nificant information. The AC/DCT method is performed on
windowed ECG segments, and therefore does not need pulse
synchronization. Experimental results show that it is possi-
ble to perform ECG biometric recognition without fiducial
detection. The proposed AC/DCT method offers significant
computational advantages, and is general enough to apply to
other types of signals, such as acoustic signals, since it does
not depend on ECG specific characteristics.
In this paper, the effectiveness of the proposed methods
was tested on normal healthy subjects. Nonfunctional factors
such as stress and exercise may have impact on the expres-
sion of ECG trace. However, other than the changes in the
rhythm, the morphology of the ECG is generally unaltered
[20]. In the proposed fiducial detection-based method, the
temporal features were normalized and demonstrated to be
invariant to stress in [4]. For the AC/DCT method, a win-
dow selection from the autocorrelation that corresponds to
the QRS complex is suggested. Since the QRS complex is less
variant to stress, the recognition accuracy will not be effected.
In the future, the impact of functional factors, such as aging,
cardiac functions, will be studied. Further efforts will be de-
voted to development and extension of the proposed frame-
works with versatile ECG morphologies in nonhealthy hu-
man subjects.
ACKNOWLEDGMENTS
This work has been supported by the Ontario Centres of Ex-
cellence (OCE) and Canadian National Medical Technologies
Inc. (CANAMET).
REFERENCES
[1] A. K. Jain, A. Ross, and S. Prabhakar, “An introduction to bio-
metric recognition,” IEEE Transactions on Circuits and Systems
for Video Technology, vol. 14, no. 1, pp. 4–20, 2004.
[2] L. Biel, O. Pettersson, L. Philipson, and P. Wide, “ECG analysis:
a new approach in human identification,” IEEE Transactions
on Instrumentation and Measurement, vol. 50, no. 3, pp. 808–
812, 2001.
[3]J.M.Irvine,B.K.Wiederhold,L.W.Gavshon,etal.,“Heart
rate variability: a new biometric for human identification,” in
Proceedings of the International Conference on Artificial Intelli-
gence (IC-AI ’01), pp. 1106–1111, Las Vegas, Nev, USA, June
2001.
[4] S.A.Israel,J.M.Irvine,A.Cheng,M.D.Wiederhold,andB.
K. Wiederhold, “ECG to identify individuals,” Pattern Recog-
nition, vol. 38, no. 1, pp. 133–142, 2005.
[5] S.A.Israel,W.T.Scruggs,W.J.Worek,andJ.M.Irvine,“Fus-
ing face and ECG for personal identification,” in Proceedings of
the 32nd Applied Imagery Pattern Recognition Workshop (AIPR
’03), pp. 226–231, Washington, DC, USA, October 2003.
[6] T. W. Shen, W. J. Tompkins, and Y. H. Hu, “One-lead ECG
for identity verification,” in Proceedings of the 2nd Joint Engi-
neering in Medicine and Biology, 24th Annual Conference and
the Annual Fall Meeting of the Biomedical Engineering Society
(EMBS/BMES ’02), vol. 1, pp. 62–63, Houston, Tex, USA, Oc-
tober 2002.
[7] T. W. Shen, “Biometric identity verification based on electro-
cardiogram (ECG),” Ph.D. dissertation, University of Wiscon-
sin, Madison, Wis, USA, 2005.
[8]R.Hoekema,G.J.H.Uijen,andA.vanOosterom,“Geo-
metrical aspects of the interindividual variability of multilead
ECG recordings,” IEEE Transactions on Biomedical Engineer-
ing, vol. 48, no. 5, pp. 551–559, 2001.
[9] B.P.SimonandC.Eswaran,“AnECGclassifierdesignedus-
ing modified decision based neural networks,” Computers and
Biomedical Research, vol. 30, no. 4, pp. 257–272, 1997.
[10] G. Wuebbeler, et al., “Human verification by heart beat sig-
nals,” Working Group 8.42, Physikalisch-Technische Bun-
desanstalt (PTB), Berlin, Germany, 2004, lin
.ptb.de/8/84/842/BIOMETRIE/842biometriee.html.
[11] M. Oeff, H. Koch, R. Bousseljot, and D. Kreiseler,
“The PTB Diagnostic ECG Database,” National Metrol-
ogy Institute of Germany, />physiobank/database/ptbdb/.
[12] The MIT-BIH Normal Sinus Rhythm Database,
/>[13] L. S
¨
ornmo and P. Laguna, Bioelectrical Signal Processing in Car-
diac and Neurological Applications, Elsevier, Amsterdam, The
Netherlands, 2005.
[14] J. P. Mart
´
ınez, R. Almeida, S. Olmos, A. P. Rocha, and P. La-
guna, “A wavelet-based ECG delineator: evaluation on stan-
dard databases,” IEEE Transactions on Biomedical Engineering,
vol. 51, no. 4, pp. 570–581, 2004.
[15] A. L. Goldberger, L. A. N. Amaral, L. Glass, et al., “Phys-
ioBank, PhysioToolkit, and PhysioNet: components of a new
research resource for complex physiologic signals,” Circula-
tion, vol. 101, no. 23, pp. e215–e220, 2000.
[16] P. Laguna, R. Jan, E. Bogatell, and D. V. Anglada, “QRS detec-
tion and waveform boundary recognition using ecgpuwave,”
2002.
[17] Y. Wang, K. N. Plataniotis, and D. Hatzinakos, “Integrating
analytic and appearance attributes for human identification
from ECG signal,” in Proceedings of Biometrics Symposiums
(BSYM ’06), Baltimore, Md, USA, September 2006.
[18] J. Lu, Discriminant learning for face recognition, Ph.D. thesis,
University of Toronto, Toronto, Ontario, Canada, 2004.
[19] K. N. Plataniotis, D. Hatzinakos, and J. K. M. Lee, “ECG bio-
metric recognition without fiducial detection,” in Proceedings
of Biometric s Symposiums (BSYM ’06),Baltimore,Md,USA,
September 2006.
[20] K. Grauer, A Practical Guide to ECG Interpretation, Elsevier
Health Sciences, Oxford, UK, 1998.