Báo cáo hóa học: " Research Article Global Interior Robot Localisation by a Colour Content Image Retrieval System" doc
Bạn đang xem bản rút gọn của tài liệu. Xem và tải ngay bản đầy đủ của tài liệu tại đây (4.07 MB, 15 trang )
Hindawi Publishing Corporation
EURASIP Journal on Advances in Signal Processing
Volume 2008, Article ID 870492, 15 pages
doi:10.1155/2008/870492
Research Article
Global Interior Robot Localisation by a Colour
Content Image Retrieval System
A. Chaari,
1, 2
S. Lelandais,
1
C. Montagne,
1
and M. Ben Ahmed
2
1
IBISC Laboratory, CNRS FRE 2873, University of Evry 40, Rue du Pelvoux, 91020 Evry Cedex, France
2
RIADI Laboratory, National School of Computer Sc i ence, University of Manouba, 2010 La Manouba, Tunisia
Correspondence should be addressed to A. Chaari,
Received 2 October 2006; Revised 10 April 2007; Accepted 3 August 2007
Recommended by Jose C. M. Bermudez
We propose a new global localisation approach to determine a coarse position of a mobile robot in structured indoor space using
colour-based image retrieval techniques. We use an original method of colour quantisation based on the baker’s transformation
to extract a two-dimensional colour pallet combining as well space and vicinity-related information as colourimetric aspect of the
original image. We conceive several retrieving approaches bringing to a specific similarity measure D integrating the space organ-
isation of colours in the pallet. The baker’s transformation provides a quantisation of the image into a space where colours that
are nearby in the original space are also nearby in the output space, thereby providing dimensionality reduction and invariance to
minor changes in the image. Whereas the distance D provides for partial invariance to translation, sight point small changes, and
scale factor. In addition to this study, we developed a hierarchical search module based on the logic classification of images follow-
ing rooms. This hierarchical module reduces the searching indoor space and ensures an improvement of our system performances.
Results are then compared with those brought by colour histograms provided with several similarity measures. In this paper, we
focus on colour-based features to describe indoor images. A finalised system must obviously integrate other type of signature like
shape and texture.
Copyright © 2008 A. Chaari et al. This is an open access article distributed under the Creative Commons Attribution License,
which permits unrestricted use, distribution, and reproduction in any medium, provided the original work is properly cited.
1. INTRODUCTION
The autonomous robot navigation in a structured interior
or unstructured external environment requires the integra-
tion of much functionality, which goes from the navigation
control to the mission supervision, while passing by the per-
ceived environment modeling and the planning of trajecto-
ries and strategies of motion [1]. Among these various func-
tionalities, the robot localisation, that is, the capacity to es-
timate constantly its position is very significant. Indeed, the
knowledge of the robot position is essential to the correction
of trajectory and the execution of planned tasks.
Sensors constitute the fundamental elements of a locali-
sation system. According to the type of localisation needed,
we can use either proprioceptive sensors or exteroceptive
sensors. Proprioceptive sensors measure displacements of the
robot between two moments. The integration of their mea-
sures allows estimating the current position of the robot
compared to its starting one. On the other hand, the exte-
roceptive sensors measure the absolute position of the robot
by observing benchmarks whose positions are known in an
environment frame-attached reference.
The localisation problem is fundamental in mobile
robotics and always pokes a crescent number of contribu-
tions. DeSouza and Kak propose in [2] an outline of the var-
ious approaches, as well in interior structured as in external
unstructured environments. These techniques can be gath-
ered in two principal categories: relative localisation methods
and absolute localisation methods:
(i) relative or incremental localisation where the robot
position is computed by incrementing its preceding
position and the measured variation with proprio-
ceptive sensors (the two principal methods of rela-
tive localisation are odometry and the inertial local-
isation, these techniques use unstructured data and
produce an accumulating error to estimate the robot
position);
(ii) absolute localisation requires the knowledge of the en-
vironment to determine exactly the robot position or
2 EURASIP Journal on Advances in Signal Processing
Robot
Global localization
Coarse position (room , o rientation )
Fine localization
Exact position (coordinates, distances )
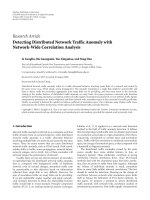
Figure 1: Proposed global localisation task which aims to give a
coarse position of the robot. These global localisation’s outputs
could be used to keep only a part of the indoor space as inputs to a
fine and exact localisation system for navigation purpose.
to periodically readjust incremental estimate (naviga-
tion) produced with relative localisation techniques.
Exteroceptive sensors are used and various techniques
can be distinguished to compute the robot position.
The most known approaches are the magnetic com-
passes localisation, the active reference marks localisa-
tion, the passive reference marks localisation, and the
model-based localisation techniques [3].
We propose in this paper a new approach for the robot local-
isation problem which consists in using an image database
model and consequently content-based image retrieval tech-
niques to provide a qualitative and a coarse estimate of the
robot position. The central idea is to provide to the system a
set of images and features potentially visible and detectable
by computer vision techniques. The system’s aim, thus, con-
sists in searching attributes and features to identify the closest
images from this set which indicate a coarse position and ori-
entation of the robot. We introduce thus the term of global
localisation which aims to indicate a coarse position of the
robot like its room or orientation and which is different from
fine or absolute localisation problem. This global localisa-
tion generally intervenes before the fine localisation process
which aims to compute accurately the robot position (cf.
Figure 1). We intend by fine localisation any localisation sys-
tem developed for a purpose of robot navigation and which
gives an exact position of the robot. The next section gives an
overview of this fine localisation systems which could be as
well map-based systems as maples systems.
In this work, we developed a global localisation robotic
solution for disabled people within a private indoor environ-
ment. This global localisation could simplify the fine local-
isation by searching the robot position in a simple part of
the space instead of the entire environment. Moreover, this
global localisation is necessary after a long displacement of
the robot to know its position whether it is lost and when the
problem of fine localisation is difficult to solve.
We work through the ARPH project (Robotics Assistance
to Handicapped People) [4] defined with the French Asso-
ciation against Myopathies (AFM). The aim of the project
is to embark an arm manipulator (see Figure 2)onanau-
tonomous mobile basis. By using the arm, a handicapped
person is able to carry out various tasks of the current life.
The various control modes include or not the handicapped
Figure 2: Prototype of the handicapped person assistance’s robot.
person. Thus, the base must be able to be completely au-
tonomous. To ensure this capacity, various sensors equip the
base: proprioceptive odometric sensors for the relative locali-
sation, ultrasonic sensors for obstacles detection and a colour
camera as exteroceptive sensors.
For the global localisation, we use the colour camera fixed
in the base and we propose a content-based image retrieval
method. The principle is to build an image database of the
indoor space in which the robot evolves/moves. To find it-
self, the robot takes an image of its environment called re-
quest image. Then the system seeks the closest image from
the database to the request image from which it deduces the
room and the orientation of the robot.
Unlike most retrieval systems, request images taken by
the robot’s camera differ from images stored in the database.
Although, the image database describes the totality of the
indoor environment, the random navigation of the robot
(according to the implicit need of the handicapped per-
son) always gives different request images from those of the
database. It is a question of extracting from the database, the
closest image compared to the request image. This image will
be used to determine the room where the robot is and its
orientation in this room: two essential information needed
for the global localisation of the robot in an indoor envi-
ronment. In order to achieve this goal, colour information
is needed. Unfortunately, illumination is not controlled and
is not known to have invariant template against its changes.
In addition, many small objects are removable and make par-
tial occlusion of other objects. Thus it is necessary to rather
seek features which tolerate these changes, from which one
can find the image in question, than nonstable and com-
plete features, which proves too restrictive. What is required
is the compactness of features with the rapidity of computa-
tion since the image database is not very bulky.
The remainder of this paper is organised as follows. In
the next section, we present related works on indoor robot
localisation and content based image retrieval systems. Data
we used is presented in Section 3.InSection 4,wedevelop
the colour histograms techniques for image retrieval sys-
tems. The components and details of our retrieval system are
A. Chaari et al. 3
described in Sections 5 and 6, respectively. We present and
discuss our results in Sections 7 and 8 andwedrawconclu-
sions in Section 9.
2. RELATED WORK
2.1. Vision indoor robot localisation
The first vision systems developed for mobile robot localisa-
tion relied heavily on the geometry of space and other metri-
cal information for driving the vision processes and perform-
ing self-localisation. In particular, interior space was repre-
sented by complete CAD models containing different degrees
of detail. In some of the reported work [5], the CAD models
were replaced by simpler models, such as occupancy maps,
topological maps, or even sequences of images.
DeSouza and Kak [2] gather the existing approaches in
three categories according to the apriori knowledge provided
to the system:
(i) map-based localisation: these systems depend on user-
created geometric models or topological maps of the
environment;
(ii) map-building-based localisation: these are systems that
use sensors to construct their own geometric or topo-
logical models of the environment and then use these
models for localisation and navigation;
(iii) mapless localisation: these systems do not use any ex-
plicit representation of the environment. Rather, they
are based on recognised objects found in the envi-
ronment and the tracking of those objects by gener-
ating motions based on visual observations. Figure 3
resumes these categories and give maisn approaches
within each one.
Most vision techniques for autonomous mobile robotics
are map-based approaches, especially those based on abso-
lute localisation which matches perceived data with an ini-
tial model to determine the robot position and those based
on incremental localisation when the initial position of the
robot is known. Incremental localisation methods use gen-
erally geometrical representation [6]ortopologicalrepre-
sentation [7] of space. However, in large-scale and complex
spaces, incremental localisation methods are not sufficiently
accurate to determine the robot’s position due to the accu-
mulating error of the robot position’s estimate. On the other
hand, for absolute localisation methods, the step which es-
tablishes matches between robot’s observation and features
often stored in a geometrical-based model (expectation) is
the most difficult among all steps in localisation systems and
pose several problems. Moreover, if we consider a large-scale
and complex space, matches between observation and expec-
tation is increasingly difficult to solve. One can do localisa-
tion by landmark tracking when both the approximate loca-
tion of the robot and the identity of the landmarks seen in the
camera image are known and can be tracked. The landmarks
used may either be artificial ones, such as stretched tapes and
circles with a unique bar-code as reported by Tsumura in [8],
or natural ones, such as doors, windows, and so forth. In this
last case, this technique is related to object recognition meth-
ods.
Map-building-based systems allow robot to explore an
unknown environment and build a map of that environment
with simultaneous localisation and mapping (SLAM) meth-
ods. SLAM methods generate either topological [9]orgeo-
metrical representation of a space [10]. A challenging prob-
lem in map-building-based systems is the robot’s ability to
ascertain its location in a partially explored map or to deter-
mine that it has entered new territory. On the other hand,
in mapless systems no maps are ever created. We usually
call these systems as mapless navigation systems because of
the needed robot motion purpose and the unknown abso-
lute positions of elements of the environment. Indeed, rele-
vant information about the elements in the environment are
stored and associated with defined commands that will lead
the robot navigation. Unlike this purpose, our global mapless
localisation system aims rather to localise coarsely the robot
and thus simplify the search space. It resembles appearance-
based matching methods [11], but in our case we use image
retrieval techniques to give a coarse estimate of the robot po-
sition. Thus, its outputs are one room label and one main
orientation in this room. These characteristics make partic-
ular our approach (definition and results points of view).
2.2. Image retrieval systems
Content-based image retrieval (CBIR) systems have been es-
sentially developed because the digitalised images databases
are increasingly bulky. These images are, in general, com-
pressed before being filed in databases. Once these data are
stored, the problem is the capacity to retrieve them simply.
An efficient reuse of these databases passes by the joint de-
velopment of indexing and retrieving methods. A coarse rep-
resentation of such a data management can be described as
follows:
{image}−→features −→ indexing. (1)
The first systems suggested in the literature are based on the
use of key words attached to images. The retrieving results
of a particular type of image are inevitably a function of the
lexical fields used. The indexing phase is, in this case, tedious
and the coded data of the image remains limited. Thus, the
content-based image retrieving is quickly developed giving
rise to many systems allowing an image query method in-
stead of the textual searching.
A content-based image retrieval system comprises gener-
ally four tasks. The principal ones are obviously the indexing
and the retrieving tasks. The indexing task consists in com-
puting a signature summarizing contents of an image which
will be then used in the retrieving stage. The attributes usu-
ally used as signature are colour, texture, and shape. On the
other hand, the retrieving task is generally based on a similar-
ity measure between the signature of the request image and
those in the corresponding database. We used only these two
tasks for our automatic robot localisation problem. The two
other tasks are navigation and analysis. Navigation is mainly
related to the manner of database’s consultation. This func-
tionality is often static with a search for one or more answers
4 EURASIP Journal on Advances in Signal Processing
Indoor localisation
Map-based localization
Map-building-based
localization
Mapless localization
Absolute
localization
Incremental
localization
Landmark
tracking
Optical
flow
Appearance-based
matching
Using
Object
recognition
Using
Geometrical
representation
of space
To pol ogi c al
representation
of space
Figure 3: Robot localisation categories.
to a given request. A new type of research more interactively
results in a more incremental approach and especially more
adaptive to the users needs. From the retrieved images re-
sulting from the first stage, the user can refine his research
according to an object or a selected zone. This analysis is pro-
viding quantitative results and not of visual nature (e.g., the
number of images with a blue colour bottom). This function-
ality is thus summarised to extract statistics from images.
In addition, image retrieval systems are generally based
on a query by example (QBE): further to a request image
taken by a robot in our case, the search engine retrieves
the closest images of the database on the basis of a simi-
larity distance. Then the ideal retrieving tool is that which
quickly and simply gives access to the relevant images com-
pared to a request image taken instantaneously by the mobile
robot. The question is how to retrieve, automatically from
the database, images visually similar to the request image.
The similarity is evaluated by using a specific criterion based
on colour, shape, texture, or a combination of these features.
Many techniques were proposed with colour-based image re-
trieval [12–14], and it is impossible to define the best method
without taking account of the environment. We can never-
theless release a general methodology through the following
stages [15]:
(i) elicitation of a significant reference base allowing stor-
ing images and files of index associated with each im-
age;
(ii) quantisation of each image by keeping only the rele-
vant colours in order to optimise the efficiency in time
and in results;
(iii) defining images signatures according to the desired re-
quests (signature consists of a combination of generic
attributes and specific attributes related to the applica-
tion);
(iv) choice of a metric for the similarity measure;
(v) implementation of an interface allowing requests by
image examples for the concerned applicability.
Many academic and/or industrial content-based image re-
trieval systems were developed: Mosaic [16], Qbic [17], Sur-
fimage [18], Netra [19], VisualSEEK [20], and so forth. They
allow an automatic image retrieving per visual similarity.
The standard architecture of all these marketed systems com-
prises an offline phase to generate image’s features and an on-
line phase for image retrieving task (as showed by Figure 4).
Some systems are conceived for general public applica-
tions (e.g., the search of images on Internet). Image databases
are then general and include heterogeneous type of images.
Other systems are conceived for specific applications. The
used image databases are in this case more concise and spe-
cific to the application. Images are characterised by homo-
geneous contents (faces, medical images, fingerprints, etc.).
In the specific databases, the developed features are dedi-
cated and optimal for the target considered (eccentricity of
the contour of a face, position of a tumour, etc.). On the
other hand, for the generic databases, the extracted features
are universal (colour, texture, shape, etc.) [21]. Although our
specific applicability (the global localisation of a robot in an
indoor environment), image databases are generic because of
the variety of objects present in a house and indoor spaces in
general (see Figure 5).
3. IMAGE DATABASES
Two complete and well-structured image databases are built
in two different indoor spaces (domestic environment) to
assess the global localisation of the robot. Both spaces are
large-scale and complex indoor environment owing to the
fact that each of them contains 8 different rooms including
the kitchen, the living room, and even the bathroom. Im-
ages of each database have been taken from all the rooms
of the corresponding indoor space. For each room, we find
a lot of images, corresponding to different available position
of the robot and different orientation with a rotation of 20
◦
or 30
◦
according to the room dimensions. The first database
contains 240 images and the second 586 images. The size of
A. Chaari et al. 5
Offline phase
Database indexing
Image
databases
Index
databases
Similarity
measure
Signature computationInterface
User
Online phase
Figure 4: Content-based image retrieving architecture.
images is 960 × 1280 pixels. Figure 5 shows examples of im-
ages from the first database (a, b) and from the second one
(c, d).
In the second database, we take also the luminosity into
account (cf., Figures 5(c), 5(d)). For the same position, we
have two or three images which have been taken at different
day time. We also took a lot of request images which are dif-
ferent from the database images. For the first database, we
have 20 request images and 35 for the second database.
4. COLOUR HISTOGRAMS
Colourimetric information is very significant in a domestic
environment. Indeed, such a space includes various elements
without colourimetric coherence between them. A discrimi-
nation of these elements can be more powerful by taking into
account their colours.
Colour histograms remain the most used techniques as
for adding colour information to retrieval systems. The ro-
bustness of this feature and its invariance to the position and
orientation of objects make its strong points. Nevertheless,
these performances are degraded quickly when the database
is large. But in our application, the image database is not very
bulky. Indeed, in an indoor environment, we do not exceed a
few hundreds of images to describe structurally the environ-
ment of the robot. The use of the histograms for colour im-
ages indexing is based primarily on the selection’s techniques
of the adapted colour space, the quantisation of the selected
space, and the comparison methods by similarity measures.
We have tested the RGB and the LUV colour spaces. To the
RGB colour space which gave best results, we developed sev-
eral uniform quantisations in order to test different pallet
sizes.
Given a colour image I,ofsizeM by N pixels, the colour
distribution of a colour bin c which ranges over all bins of
the colour space is given by
h
I
c
=
1
MN
M−1
i=0
N
−1
j=0
δ
I(i, j) − c
. (2)
In the above equation, δ() is the unitary impulse function.
We notice that the h
c
values are normalised in order to sum
to one. The value of each bin is thus the probability that
the colour c appears in a pixel of the image. Different sim-
ilarity measures were implemented and tested to our image
databases. Two category of measures are presented: the bin-
by-bin similarity measures which compare contents of cor-
responding histogram bins (Minkowski distance, histogram
intersection, and the χ
2
test) and the cross-bin measures
which compare noncorresponding bins (Mahalanobis dis-
tance and EMD Distance). Hereafter we present those sim-
ilarity measures between a request image (I) and all the
database images (H).
(1) Minkowski distance:
d(I, H)
=
c
h
I
c
− h
H
c
r
1/r
r ≥ 1(3)
(a) Manhattan distance L
1
: r = 1
(b) Euclidean distance L
2
: r = 2
(2) Histogram intersection:
Inters (I, H)
=
c
min
h
I
c
, h
H
c
c
h
H
c
. (4)
This function deducts the number of pixels of the
model which have a direct correspondent in the re-
quest image. Values close to 1 indicate a good resem-
blance [12].
(3) The χ
2
test. A colour histogram can be considered as
the realisation of a random variable giving colours
in an image. Thus, the histogram comparison can be
brought back to a test of assumptions, on which it is
necessary to determine if two achievements (i.e., two
histograms) can come from the same distribution. The
χ
2
test is based on the assumption that the present dis-
tribution is Gaussian [22]. The χ
2
test is given by
χ
2
=
c
h
I
c
− h
H
c
2
h
I
c
+ h
H
c
2
. (5)
6 EURASIP Journal on Advances in Signal Processing
(a) (b)
(c) (d)
Figure 5: Examples of indoor images.
(4) Mahalanobis distance or generalised quadratic distance
D
QG
was used by Niblack et al. [23] to take into
account the intercorrelation between colour compo-
nents. A weighting matrix W which includes the re-
semblance between colours was proposed. The gener-
alised quadratic distance resulting from the Euclidean
distance is defined by the following formula:
d
QG
(I,H) =
(H − I)W(H − I)
T
. (6)
The components w
ij
of the weighting matrix W can be
interpreted like similarity indices between the i
e
and
the j
e
element of the pallet. Thus W is generally repre-
sented by the reverse of the intercorrelation matrix be-
tween colour bins. Other proposals of weightings ma-
trices attached to the representation of colour spaces
were introduced by Striker and Orengo to define the
colourimetric distances between colours [24].
(5) EMD distance. Earth mover distance proposed by Rub-
ner et al. [25] consists in the extraction of the minimal
quantity of energy necessary to transform a signature
into another. Having the distances d
ij
between colours
components of the two histograms H and I of m and
n dimensions, respectively, it is a question of finding a
whole flow F
= [ f
ij
] which minimises the cost of the
following quantity:
m
i=1
n
j=1
d
ij
f
ij
. (7)
To control the implied energy exchanges, the direction
of transfer must be single ( f
ij
≥ 0) and a maximum
quantity of transferable and admissible energy of each
colour component should be defined. From the whole
of optimal transfer F, EMD distance is then defined as
the following resulting work:
d
EMD
(H,I) =
m
i
=1
n
j
=1
d
ij
f
ij
m
i=1
n
j=1
f
ij
. (8)
The formalism suggested by Rubner meets all condi-
tions to determine the optimal distance between two
histograms but the complexity introduced by the algo-
rithm of optimisation makes it complex in time com-
puting [26].
5. A NEW COLOUR FEATURE DEFINITION
5.1. Baker’s transformation
The baker’s transform (BT for short) is based on the defini-
tion of mixing dynamical systems [27, 28]. The main interest
of these transformations is that they mix in a very homoge-
neous way all the elements of the involved space.
Arnold and Avez [27] give a lot of examples of such mix-
ing transformations, which are defined on the unit square
[0, 1]
× [0, 1]. We have used one of them, the BT. We just
mention here that all the examples given by Arnold and Avez
are defined on continuous sets. On the other hand, digital
images are finite sets of points (pixels). Unfortunately, it ap-
pears that a transformation of a finite set is never a mixing
one. But for some peculiar mixing transformations like BT,
even restricted to finite sets, pixels are statistically well mixed
by a suitable number of iterations.
A. Chaari et al. 7
Figure 6: 256 × 256 original image.
Figure 7: First step of BT initial iteration.
Figure 8: Second step of BT initial iteration.
An iteration of the BT is based on two steps:
(i) first, an “affine” transformation is used which gives an
image twice larger and half higher (cf. Figure 7)from
an original image (cf. Figure 6);
(ii) then, the resulting image is cut vertically in the middle
and the right half is put on the left half (cf. Figure 8).
After a suitable number of iterations, we obtain a well-mixed
image (cf. Figure 9). From this mixed image, we extract a def-
inite size window (16
× 16 in the example) which gives after
some iterations a reduced scale version of the original image
(cf. Figure 10).TheBTrequiresthattheimagesizeis2
N
× 2
N
pixels and we can show that the BT is periodic with period
equal to 4N iterations. The image is well mixed with N iter-
ations. If we divide the mixed image and take a 2
p
× 2
p
re-
sulting window (P<N), we can obtain a good version of the
original image at a reduced scale after applying 3p iterations
of the BT to the mixed 2
p
× 2
p
window.
Figure 9: Well-mixed image.
Figure 10: 16 × 16 pallet deduced from the mixed window.
5.2. The colour feature
As shown in Figure 10, a small image of size 16
× 16 gives a
good colour, shape, and texture representation of the original
image and we can consider it as a representative colour pal-
let. In [29], we presented a first use of this method to quan-
tify colour images. The idea is to use one of these windows
as a colour pallet to reduce all the colour levels of the orig-
inal image. With a 2
N
× 2
N
image, it is possible to propose
pallets containing 2
2p
colours (P<N). So the number of dif-
ferent pallets available from one image is given by the num-
ber K
= 2
2(N−p)
. Given a pallet, the common principle is,
for each pixel, to compute the Euclidean distance between
its colour and all colours present in the pallet. Then the new
colour assigned to the pixel is that which minimises the dis-
tance. The problem is how to choose the representative win-
dow to build the good pallet? We analyse four different solu-
tions and we show that the best of them uses selection of “the
median pallet.” The evaluation of results is done by a sim-
ilarity distance between the original image and the reduced
one. This distance, baptised “delta,” is computed on each of
the three colour channels (red, green, and blue) for all im-
age pixels; in (9), I
1
and I
2
represent, respectively, the colour
levels of a pixel in the initial image and in the reduced image:
delta =
2
N
i=1
2
N
j=1
I
1
(i, j) − I
2
(i, j)
2
N
× 2
N
. (9)
From a practical point of view, BT is a space transforma-
tion. For a given dimension of image, the position of the
output pixels in the mixed image is always the same one.
8 EURASIP Journal on Advances in Signal Processing
Table 1: “delta” distance between request image and reduced ones.
Figure delta R delta V delta B <delta>
8(a) 4.01 4.12 5.19 4.44
8(b) 73.19 30.49 23.86 42.52
Table 2: Results for database n
◦
1–20 request images.
Colour number 48 108 192 300 588 %
First answer
Right 59 8 9 9 40
Medium 63 4 4 2 19
False 98 8 7 9 41
Three answers
Right 10 11 13 13 13 20
Medium 24 21 17 18 21 33.7
False 26 28 30 29 26 46.3
Consequently, a look up table (LUT), which indicates for
each pixel of an image its coordinates in the mixed image,
allows to obtain the pallet more quickly. In another way, BT
simply consists to extract in a homogeneous way pixels from
the image. Thus, it is possible, for rectangular images, to ob-
tain a same feature by applying a subsampling technique.
6. RETRIEVAL APPROACHES
6.1. Colour reduction retrieval approach
If it is possible to extract a sample of pixels, which the colours
are representative of the original image and which are stable
for images having the same sight, then this feature is called
colour invariant. This colour feature is used as an indirect
signature [30]. The strategy to retrieve the closest image from
the database, to the request image, is shown in Figure 11.
First we build a pallet database by computing for each im-
age of the original database its colour invariant. Then, the re-
quest image is projected in the colour space defined by each
pallet from this pallet database. We compute the colour dif-
ference between the request image and the projected ones (cf.
Ta ble 1), and we select the pallet (i.e., the image) which leads
to the minimum of this distance.
6.1.1. Results of the colour reduc tion retrieval approach
From each image database, we have built 5 pallet databases,
to assess different size of pallet: 48, 108, 192, 300, and 588,
which, respectively, correspond to these two dimensional
pallets of: 6
× 8, 9 × 12, 12 × 16, 15 × 20, and 21 × 28. In
order to speed up the retrieval process, we subsampled the
request image (60
× 80 pixels). Tables 2 and 3 display a syn-
thesis of obtained results. The retrieved images are organised
in three classes.
(i) Right: the image proposed by the retrieval system is
taken in the same room and with the same orientation
than the request image.
Table 3: Results for database n
◦
2–35 request images.
Colour number 48 108 192 300 588 %
First answer
Right 10 16 17 21 19 47.5
Medium 13 7 12 6 7 25.7
False 12 12 6 8 9 26.8
Three answers
Right 23 35 37 37 35 31.8
Medium 43 32 36 37 38 35.4
False 39 38 32 31 32 32.8
(ii) Medium: the image proposed by the retrieval system is
taken in the same room than the request image.
(iii) False: the image proposed by the retrieval system is
taken in other room than the request image.
We analysed two cases: the quality of the first answer and the
quality of the three first answers. We can see that we obtain
40% or more of good answers when we take only one an-
swer into account. If we want a coarse answer to the ques-
tion “In which room is the robot”?, we sum the “Right” and
the “Medium” answers. Then the rate of correct answer is
about 60% for the database n
◦
1 and over 70% for the second
database. When we take the first three answers into account,
we obtain degraded results especially for the first database
which contains no more than one image for each sight.
Moreover, the relationship between accuracy and colour
number is not monotonic. Above a certain threshold, perfor-
mance gains from increased colour number cease to be ob-
served and become too small to justify the increased compu-
tational cost. In the second database, we obtain results over
75% with 192 and 300 colours in the pallet. Finally, we retain
this last size (300 colours) to work with for the next experi-
ments.
Figures 12(a) and 13(a) show request images from the
first and the second databases, respectively. Figures 12(b),
12(c),and12(d) present the first three answers obtained
(Figures 12(b) gives the right response, Figures 12(c) and
12(d) are false). Figures 13(b) and 13(c) present two exam-
ples of the first answer obtained with two different pallets.
We can see that the result is right with a pallet of 192 colours
(see Figure 13(b)), but it is false with a pallet of 48 colours
(see Figure 13(c)).
In spite of its interest which validates the concept of
colour invariant, our method is handicapped by a very signif-
icant computing time (over than 15 minutes). The projection
of the request image according to all pallets of the database
takes a more and more time that the bulky database. We can
however consider the pallet as a feature and compare pallets
between them in the retrieving phase instead of comparing
request image with reduced ones.
6.2. The interpallet distance
After a first use of this colour pallet as an indirect descrip-
tor, we associate to this feature an Euclidean distance that we
call interpallet distance L
2
(P
req
− P
base
)[31]. The strategy to
A. Chaari et al. 9
Request image
(a)
(c)
(b)
(d)
Two i ma ge s from
the first database
Their two “300
colours” pallets
Figure 11: Request image reduced by pallets of the images (a) and (b) give the result images (c) and (d), respectively.
(a) (b) (c) (d)
Figure 12: Three answers with a pallet of 300 colours from the request image (a).
search the closest image to the request image is described as
follows (cf. Figure 14).
(i) First we build a pallet database by the computation of
the colour invariant of each image from the original
database.
(ii) Then, we extract the pallet of the request image to
compute the colour difference between this one and all
pallets already built in the database. Euclidean distance
is computed between correspondent colour having the
same position in these pallets.
(iii) Finally, we select the pallet (i.e., the image) which leads
to the minimum of this distance.
The space organisation of colours of this two-dimensional
pallet is an additional information who can present invari-
ance property to some changes in image sample. Thus, we
emphasis this colour feature aspect and try to model it by
preserving the interpallet distance which gives interesting re-
sults. Indeed, as the below figure shows it, the pallet pre-
serves the spatial distribution and the principal vicinity re-
lations between colours present in the original image. This
should give us a relative invariance as well for sight point
small changes as for scale factor (i.e., distance separating the
camera to objects).
6.3. Space distribution of colours
In order to coarsely describe colours distribution form of the
image and to build an invariant feature as well for sight point
small changes as for scale factor, we extract the three first
colour statistical moments of the pallet. These moments are
largely used in pattern recognition systems and give a robust
and complete description of analysed patterns. Stricker and
Orengo [24] establishes a balanced sum of the average, the
variance, and skewness (the third-order moment) computed
for each colour channel, to provide a single number used in
the indexing process. These moments are defined by
μ
i
=
1
N
N
j=1
p
ij
,
σ
i
=
1
N
N
j=1
p
ij
− μ
i
2
,
s
i
=
1
N
N
j=1
p
ij
− μ
i
3
1/3
,
(10)
where p
ij
is the value of the pixel j in the colour channel I,
N is the number of pixel in the image.
10 EURASIP Journal on Advances in Signal Processing
(a) (b) (c)
Figure 13: First answer with a pallet of 192 colours (b) and 48 colours (c) from the request image (a).
Robot
Request image
Pallet
Closest image
Room & orientation
Euclidean distance
Room pallet database
Image pallet database
Off line phase
Figure 14: Interpallet distance.
The distance between two images is then defined like a
weighted sum between these quantities for each channel:
d
mom
(I,H)
=
3
i=1
w
i1
μ
I
i
− μ
H
i
+ w
i2
σ
I
i
− σ
H
i
+ w
i3
s
I
i
− s
H
i
.
(11)
We have applied these moments on our two-dimensional
pallet. p
ij
are in this case pixels from the pallet and N is the
number of colour in the pallet. We notice that a space de-
scription of our two-dimensional pallet by colour moments
asshowedin[20], gives better results than a similar descrip-
tion of the entire original image. We deduce that such a de-
scription of a pallet, which is a represention on a reduced
scale of the original image, gives a more precise visual sum-
mary of it. In addition, the search time is much more faster
while operating on pallets (0,7 second against 3 to 4 sec-
onds for retrieving by image moments with an image size of
1260
× 960 pixels).
Nevertheless, the success rate remains rather weak com-
pared to our objectives (50% to find the right room). Thus,
we studied the discriminating capacity of each of the first
four moments (average, variance, skewness, and kurtosis) to
use the best of them as a weighting factor to the proposed in-
terpallet distance. After the computation, the first four mo-
ments variance, the greatest on is used to build a weighting
coefficient enough discriminating for strong variations and
neutral for weak variations (lower than a threshold α). Then
we discriminate through the coefficient λ images having a
variance of the first two moments lower than a threshold β.
Following some experiments on our two image databases, we
fixed α at 20 and β at 128:
w
1
= λ
Δ σ
σ
im
+ σ
req
(12)
with
Δσ
=
α if
σ
req
− σ
im
<α,
σ
req
− σ
im
otherwise,
(13)
λ
=
⎧
⎨
⎩
1if
σ
req
− σ
im
<β,
μ
req
− μ
im
<β,
∞ otherwise.
(14)
Thus
D
1
= w
1
·L
2
P
req
− P
im
. (15)
6.4. Vicinity template of colours
To describe the textural aspect of colours distribution, we de-
veloped the cooccurence matrix and some relating features
defined by Haralick et al. [32] and extended to colour infor-
mation by Tr
´
emeau [33] which are
(i) colour inertia:
I
=
N
i=0
N
j=0
D
2
ij
·P(i, j) (16)
with D
2
ij
= (R
i
− R
j
)
2
+(G
i
− G
j
)
2
+(B
i
− B
j
)
2
; R, G,
and B are the three colour channels of the RGB colour
space;
(ii) colour correlation:
C
=
N
i=0
N
j=0
D
i
·D
j
σ
i
·σ
j
P(i, j) (17)
with D
i
= ((R
i
− R
μ
i
)
2
+(G
i
− G
μ
i
)
2
+(B
i
− B
μ
i
)
2
)
1/2
,
D
j
= ((R
j
− R
μ
j
)
2
+(G
j
− G
μ
j
)
2
+(B
j
− B
μ
j
)
2
)
1/2
with
A. Chaari et al. 11
μ
i
, σ
i
(resp., μ
j
, σ
j
) who represent the colour average
and the colour standard deviation for all the transi-
tions for which the index colour first pixel is i (resp.,
the index colour second pixel is j).
Thus μ
i
= (R
μ
i
, G
μ
i
, B
μ
i
)with
R
μ
i
=
1
N
j
=0
P(i, j)
·
N
j=0
P(i, j)·R
j
,
σ
i
=
1
N
j
=0
P(i, j)
·
N
j=0
P(i, j)·D
2
j
(18)
(iii) homogeneity:
H
=
N
i=0
N
j=0
P(i, j)
2
(19)
(iv) entropy:
E
=
N
i=0
N
j=0
P(i, j) · log P(i, j). (20)
Moreover, we extract the maximum value of the cooccurence
matrix and its two colour components that we note (c
1
, c
2
).
Owing to the fact that a fine quantisation of a colour
space gives a large signature, the construction of cooccurence
matrices related to pallets (low-size images) brings smooth
and not enough discriminating distributions. To mitigate
this problem, we kept only the main colours vicinity and we
developed a new cooccurence matrix related to a coarse uni-
form quantisation of the RGB colour space in 64 bins. We
considered, in addition, an isotropic vicinity (8 connexities)
of each pixel.
For the retrieval phase, we developed the Euclidean dis-
tance L
2
(M
req
− M
im
) between cooccurence matrices M
req
and M
im
, respectively, of request image pallet and database
image pallet. This distance is weighted with the factor w
2
computed on the base of the entropy variation which has the
greatest dynamics and so the discriminating capacity among
the other cooccurrence matrix features. This gives the D
2
dis-
tance hereafter:
w
2
= λ
ΔE
E
im
+ E
req
(21)
with
ΔE
=
γ if
E
req
− E
im
<γ,
E
req
− E
im
otherwise.
(22)
Thus
D
2
= w
2
L
2
M
req
− M
im
. (23)
We analysed the colour components of the maximum value
of the cooccurence matrix. We estimated the value λ accord-
ing to the three-dimensional connexity of the request image
colour components and those of database images. By assimi-
lating uniform colour bins to cubes (cf. Figure 15), the three-
dimentional connexity is evaluated as follows:
Blue
B
(0, 0, 255)
(255, 0, 255)
Magenta
G
Red
(255, 0, 0)(0,0,0)
Black
1
3
2
4
5
Yellow
(0, 255, 0)
(255, 255, 0)
Green
(1,1,1)
White
Cyan
(0, 255, 255)
(255, 255, 255)
R
Figure 15: RGB colour cube.
Connex1: cubes adjacent by a surface, for example, cubes
(1, 2), (1, 3);
Connex2: cubes adjacent by an edge, for example, cubes
(2, 3), (3, 5);
Connex3: cubes adjacent by a point, for example, cubes
(2, 4).
We retained the best connexity of the request image pair
of colour (c
1
, c
2
)
req
with each database image pair of colour
(c
1
, c
2
)
im
through the following algorithm:
if (c
1
, c
2
)
req
= (c
1
, c
2
)
im
, then λ = 1,
if (c
1
, c
2
)
req
Connex1 (c
1
, c
2
)
im
, then λ = 2,
if (c
1
, c
2
)
req
Connex2 (c
1
, c
2
)
im
, then λ = 3,
if (c
1
, c
2
)
req
Connex3 (c
1
, c
2
)
im
, then λ = 4,
else λ
= 8.
6.5. The final distance D
The D
2
distance built by cooccurence matrices of the pallets
gives lower results than the D
1
distance (only 55% of right
room). But by finely analysing answers of each request, we
note that there are some cases where the D
1
distance led to
a false result whereas the distance D
2
leads to a right result
(and vice versa).
The final distance D we propose takes the normalised
distances between pallets and between cooccurence matri-
ces into account, each one balanced by a resulting term from
colour moments and cooccurence matrices attributes, re-
spectively. The balanced sum distance D is given by
D
= w
1
L
2
P
req
− P
im
+ w
2
L
2
M
req
− M
im
. (24)
6.6. Hierarchical approach
We proposed as preliminary stage, before applying the pro-
posed distance D, a hierarchical search using classification of
images according to rooms. We characterise each room by
12 EURASIP Journal on Advances in Signal Processing
Robot
Request image
Pallet
4 closest rooms Corresponding pallets
D distance
Closest image
Euclidean distance
Room & orientation
Room pallet database
Image pallet database
Off line phase
Figure 16: Hierarchical search.
a discriminating colour pallet. Each room pallet is built by
sampling colour pallets of images belonging to this room and
by adding colours whose minimal distance to those retained
is higher than a threshold fixed at 10.
During the retrieval phase, we compute the difference be-
tween the request and room pallets by using the Euclidean
distance and then classify these distances by ascending order.
We eliminate firstly rooms presenting no similar colours to
those of the request image (cf. Figure 16). Finally, we apply
the distance D to retrieved images where the robot is high
probably lost.
To increase the speed of the system it is necessary to elim-
inate the maximum of rooms. However, we should not affect
the system effectiveness by eliminating the room correspond-
ing to the request image where the robot is lost. After some
experiments on our two image databases, we kept in search
process the first four rooms given by the hierarchical process.
It should be noted that our aim is to simplify the large-scale
indoor space to a simple part (some rooms) where a fine lo-
calisation system should be more efficient. This being made,
we eliminate, from the localisation process, rooms on which
certain images distort results. By keeping the first four rooms
from eight rooms in the indoor environment, we divide by
two the space where one seeks to locate the robot.
Usual localisation contributions assess their system in
simple indoor environments with a maximum of two rooms
to draw results and conclusions of a robot’s exact localisa-
tion. We evaluate our method in two indoor environments
(a) (b)
Figure 17: (a) Request image from the second database; (b) Re-
sponse image within D distance.
much more large and complex. We do not propose a solu-
tion of exact localisation, but rather a solution to simplify
the complexity of the space. If we want to make robot’s fine
localisation with a map-based method, for example, our al-
gorithm can simplify from the search half of the map without
compromising any result. Indeed, for our both assessment
databases, we can undoubtedly simplify 4 of the 8 rooms
of the indoor space without eliminating the required room.
These results make of this hierarchical process an effective
preliminary stage not only for our localisation method but
for all indoor localisation systems. Moreover, all the process
does not take more than two seconds to have half of the in-
door space simplified.
7. EXPERIMENTAL RESULTS
We performed various experiments with 20 test images for
the first database and 35 for the second one. Test images are
different from those of the data sets. We note that a system
which guesses the right room and orientation of the robot
would be right one out of hundred times, giving an error rate
of 99%.
We note better results with our distance D than the inter-
pallet distance owing to the fact that we consider as well the
space organisation and colour vicinity as the colourimetric
aspect of the pallet. For the request image (cf. Figure 17(a)),
we have false results by using the interpallet, D
1
and D
2
dis-
tance separately. The distance D combining these two last
measures gives the right result. We have in this case the re-
sult image of Figure 17(b) indicating the right room and the
right orientation.
Ta ble 4 shows results of our retrieval strategies based on a
two-dimensional colour pallet extract from the Baker’s trans-
formation, showing the advantages of our approach.
The first global retrieving approach based on the colour
reduction principle, while giving acceptable results (about
70%) proved limited by a prohibitory computing time. We
developed, thereafter, a method by our colour pallet descrip-
tion with an interpallet distance. Results were a little de-
graded while reducing the computing time appreciably. Seek-
ing to optimise the quality of description as well as the com-
puting time, we took into account the space organisation of
the pallet to define a specific new similarity measure. Thus we
could improve the results with a search time of about three
seconds.
A. Chaari et al. 13
Table 4: Results of our methods.
Database 1 Database 2 Databases1 & 2
Time (s) Results % Time (s) Results % %
Colour reduction retrieval approach
Right
0.7
9 45%
65%
1.1
21 60%
77.2% 71.5%
Medium 4 20% 6 17.2%
False 7 35% 8 22.8% 28.5%
Interpallet distance
Right
0.7
10 50%
60%
1.1
15 42.8%
60% 60%
Medium 2 10% 6 17.2%
False 8 40% 14 40% 40%
Spatial and colour distance D
Right
2
12 60%
65%
3
18 51.5%
71.5% 69%
Medium 1 5% 7 20%
False 7 35% 10 28.5% 31%
Hierarchical approach with the distance D
Right
4
12 60%
70%
5
20 57%
88.5% 82%
Medium 2 10% 11 31.5%
False 6 30% 4 11.5% 18%
In order to improve even more the performances of room
identification, we developed a hierarchical retrieving method
eliminating in a preliminary stage a number of rooms from
the indoor environment to combine speed and effectiveness
of the localisation process. Results are clearly improved to ex-
ceed the 80%. The hierarchical procedure being consuming
in computational time, the computing time of the global so-
lution tends to increase to reach 4 seconds, a time considered
to be acceptable for the task of global localisation.
In order to validate this work, we compare these results
with a classical image retrieval technique which uses colour
histogram. We developed colour histograms on RGB and Luv
spaces. The RGB colour space which gives best results is per-
formed to three uniform quantisations into 64, 512, and 4096
colour bins. The various bin-by-bin (histogram intersection,
L
2
and χ
2
) and cross-bin (earth mover distance and Maha-
lanobis distance) similarity measures developed previously
were implemented and tested to our image databases.
As showed in Figure 18, the quantisation to 64 colours
proves very coarse for colour histograms. Quantisation to
512 bins improve considerably these results but the 4096
bins discretisation gives the best results except the Euclidean
distance which gives best results with 512 bin quantisation.
We display results of the 4096 colour histograms in Ta ble 5.
We note the worst results with the cross-bin similarity mea-
sures which tend to overestimate the mutual similarity of
colour distributions. Moreover, the computational complex-
ity of the EMD and Mahalanobis distance are the highest
among the evaluated measures. Indeed, computing the EMD
between 4096 colour histograms in our database takes over
than 30 minutes. The χ
2
test gives the best results among the
five developed distance. This statistical measure gives an er-
ror rate of 22% to find the right room. In addition, com-
puting time at around 4 seconds is acceptable for a global
localisation task.
50
60
70
80
90
(%)
64 512 4096
Quantisation
L2
Histogram intersection
Khi2
Mahalanobis
EMD
Figure 18: Histogram results.
Our method gives better results than those of the colour
histograms. We have especially best results than the effective
χ
2
test. For the second database which integrates different il-
lumination conditions, we have a rate of 88% to find the right
room giving a correct estimate of the robot position. Results
provided only with a colour-based description of indoor im-
ages are encouraging. A final system obviously must integrate
other type of signature like shape and texture with a more
structured model of the environment.
8. FURTHER RESEARCH
We can identify the following avenues for improving perfor-
mances.
(1) A first prospect for image retrieving is to develop a
local searching approach (to images). A combination
14 EURASIP Journal on Advances in Signal Processing
Table 5: Histogram results.
Base 1 & 2
Time (s) Results
Histogram Intersection
Right
4
31 56.4%
74.5%
Medium 10 18.1%
False 14 25.5%
Euclidean Distance L
2
Right
4
27 49.1%
67.2%
Medium 10 18.1%
False 18 32.8%
χ
2
test
Right
4
32 58.2%
78.2%
Medium 11 20%
False 12 21.8%
Mahalanobis Distance
Right
60
20 36.4%
63.6%
Medium 15 27.2%
False 20 36.4%
Earth Mover Distance: EMD
Right
2100
23 41.8%
65.4%
Medium 13 23.6%
False 19 34.6%
of the global solution (whole image processing) and
the local approach may improve our system’s perfor-
mances. The characteristics developed in this paper
were computed globally in the entire image. How-
ever, a system only based on global characteristics can-
not give the desired results. Indeed, an image con-
tains many objects having very different characteris-
tics (colours and textures), the feature vector extracted
from the whole image loses local information (related
to objects) and gives a coarse idea about images’ con-
tents. A possible solution consists on indexing some
known and nonremovable objects in the room’s house
[34]. A preliminary retrieving phase could determine
whether one of these objects is in the sight field of
the robot reducing the size of retrieving space. Such a
combination of the global solution with a preliminary
local approach has to improve even more the perfor-
mances of our system.
(2) More careful modelling of the colour distribution
for our similarity measure, for example, by using
Ta mur a s ignat ure f eat u re s [ 35] like directivity, con-
trast, and coarseness with a more fine colour pallet, or
afrequency-basedmodel[36] can introduce texture-
useful information to improve discrimination between
images.
(3) Another prospect for image retrieving problematic
would consist on the exploration and the search for
other features and invariants such as differential in-
variants for colour images and invariants for pre-
dictable change of illumination [37]. A comparison
between our results and those gotten by these ap-
proaches could induce ideas to improve results.
(4) We could consider a procedure of reinforcement of the
decision-making by asking the robot to take a second
image of its environment (after a small translation and
rotation) and by comparing the response obtained to
that resulting from the first request image. A confi-
dence factor attached to the answer could achieve this
procedure effectively. It will be necessary, in any event,
to seek a compromise between the quality of the results
and the response time.
9. CONCLUSION
We have presented a new approach by image retrieval tech-
niques which aims to localise an indoor robot. This approach
uses a pallet extracted by using baker’s transformation. This
pallet gives a good representation of initial colours and pre-
serves the spatial organisation of the original image. We also
build an appropriate distance which integrates the space and
the colour aspects of this pallet in order to find the closest im-
age. We obtain results which are better than results obtained
from a colour histogram method. Thus we have developed
one retrieval technique which is fast and effective.
REFERENCES
[1] J J. Gonzalez-Barbosa and S. Lacroix, “Localisation d’un
robot mobile dans un environnement naturel par indexation
d’images panoramiques,” in LAAS/Robotique et Intelligence Ar-
tificielle Seminars, Toulouse, France, Decemebr 2001.
[2] G. N. DeSouza and A. C. Kak, “Vision for mobile robot nav-
igation: a survey,” IEEE Transactions on Pattern Analysis and
Machine Intelligence, vol. 24, no. 2, pp. 237–267, 2002.
[3] O. Ait-Aider, Localisation r
´
ef
´
erenc
´
ee mod
`
ele d’un robot mo-
bile d’int
´
erieur, Ph.D. thesis, Universit
´
e d’Evry, Val d’Essonne,
France, 2002.
[4] P. Hoppenot, E. Colle, O. Ait-Aider, and Y. Rybarczyk, “ARPH:
assistant robot for handicapped people—a pluridisciplinary
project,” in Proceedings of the 10th IEEE International Work-
shop on Robot and Human Communication, pp. 624–629, Bor-
deaux, Paris, France, September 2001.
[5] R. Chatila and J P. Laumond, “Position referencing and con-
sistent world modeling for mobile robots,” in Proceedings of
IEEE International Conference on Robotics and Automation,pp.
138–145, St. Louis, Mo, USA, March 1985.
[6] A. Kosaka and A. C. Kak, “Fast vision-guided mobile robot
navigation using model-based reasoning and prediction of un-
certainties,” Computer Vision, Graphics, and Image Processing:
Image Understanding, vol. 56, no. 3, pp. 271–329, 1992.
[7] M. Meng and A. C. Kak, “Mobile robot navigation using
neural networks and nonmetrical environment models,” IEEE
Control Systems Magazine, vol. 13, no. 5, pp. 30–39, 1993.
[8] T. Tsumura, “Survey of automated guided vehicle in a Japanese
factory,” in Proceedings of IEEE International Conference on
Robotics and Automation, vol. 3, pp. 1329–1334, San Francisco,
Calif, USA, April 1986.
[9] H. Choset and K. Nagatani, “Topological simultaneous local-
ization and mapping (SLAM): toward exact localization with-
out explicit localization,” IEEE Transactions on Robotics and
Automation, vol. 17, no. 2, pp. 125–137, 2001.
A. Chaari et al. 15
[10] H. P. Moravec and A. Elfes, “High resolution maps from wide
angle sonar,” in Proceedings of IEEE International Conference
on Robotics and Automation, vol. 2, pp. 116–121, St. Louis, Mo,
USA, March 1985.
[11] S. D. Jones, C. Andresen, and J. L. Crowley, “Appearance
based processes for visual navigation,” in Proceedings of the
IEEE/RSJ International Conference on Intelligent Robots and
Systems (IROS ’97), vol. 2, pp. 551–557, Grenoble, France,
September 1997.
[12] M. Swain and D. Ballard, “Color indexing,” International Jour-
nal of Computer Vision, vol. 7, no. 1, pp. 11–32, 1991.
[13] Y. Rui, T. S. Huang, and S F. Chang, “Image retrieval: current
techniques, promising directions, and open issues,” Journal
of Visual Communication and Image Representation, vol. 10,
no. 1, pp. 39–62, 1999.
[14] J. R. Smith and S F. Chang, “Local color and texture extrac-
tion and spatial query,” in Proceedings of the IEEE International
Conference on Image Processing (ICIP ’96), vol. 3, pp. 1011–
1014, Lausanne, Switzerland, September 1996.
[15] C. Fernandez-Maloigne, “Quantification et segmentation
pour l’indexation de bases d’images couleur,” in Traitement et
Analyse d’Images: M
´
ethodes et Applications (TAIMA ’01),pp.
61–66, Hammamet, Tunisia, October 2001.
[16] S T. Goh and K L. Tan, “MOSAIC: a fast multi-feature image
retrieval system,” Data & Knowledge Engineering,vol.33,no.3,
pp. 219–239, 2000.
[17] M. Flickner, H. Sawhney, W. Niblack, et al., “Query by image
and video content: the QBIC system,” Computer, vol. 28, no. 9,
pp. 23–32, 1995.
[18] C. Nastar, “Indexation et recherche d’images: enjeux,
m
´
ethodes et perspectives,” Congr
`
es IDT, 1999.
[19] W Y. Ma and B. S. Manjunath, “NeTra: a toolbox for navigat-
ing large image databases,” Multimedia Systems, vol. 7, no. 3,
pp. 184–198, 1999.
[20] J. R. Smith and S F. Chang, “VisualSEEk: a fully automated
content-based image query system,” in Proceedings of the 4th
ACM International Multimedia Conference, pp. 87–98, Boston,
Mass, USA, November 1996.
[21] N. Boujemaa, S. Boughorbel, and V. Constantin, “Descrip-
tion de la r
´
epartition spatiale de la couleur pour l’indexation
d’images,” in 13eme Congr
`
es Francophone ARIF-AFIA (RFIA
’02), vol. 2, pp. 405–414, Angers, France, January 2002.
[22] P. Gros, G. Mclean, R. Delon, R. Mohr, C. Schmid, and
G. Mistler, “Utilisation de la couleur pour l’appariement et
l’indexation d’images,” Research Report 3269, topic 3, Insti-
tut National de Recherche en Informatique et en Automatique
(INRIA), Le Chesnay, France, 1997.
[23] W. Niblack, R. Barber, E. Equitz, et al., “QBIC project: query-
ing images by content, using color, texture, and shape,” in Stor-
age and Retrieval for Image and Video Databases, vol. 1908 of
Proceedings of SPIE, pp. 173–187, San Jose, Calif, USA, Febru-
ary 1993.
[24] M. A. Stricker and M. Orengo, “Similarity of color images,”
in Storage and Retrieval for Image and Video Databases III,
vol. 2420 of Proceedings of SPIE, pp. 381–392, San Jose, Calif,
USA, February 1995.
[25] Y. Rubner, C. Tomasi, and L. J. Guibas, “A metric for distribu-
tions with applications to image databases,” in Proceedings of
the 6th IEEE International Conference on Computer Vision,pp.
59–66, Bombay, India, January 1998.
[26] A. Tr
´
emeau, C. Fernandez-Maloigne, and P. Bonton, Image
Num
´
erique Couleur: De L’acquisistion au Traitement, Dunod,
Paris, France, 2004.
[27] V. I. Arnold and A. Avez, Probl
`
eme Ergodiques de la M
´
ecanique
Classique, Monographies Internationales de Math
´
ematiques
Modernes, Gauthier-Villars, Paris, France, 1967.
[28] P. Billingsley, Ergodic Theory and Information, John Wiley &
Sons, New York, NY, USA, 1965.
[29] C. Montagne, S. Lelandais, A. Smolarz, and P. Cornu, “Adap-
tive color quantization using the “Baker’s Transform”,” in Pro-
ceedings of the 2nd European Conference on Color in Graph-
ics, Imaging, and Vision and Sixth International Symposium on
Multispectral Color Science (CGIV ’04), pp. 353–358, Aachen,
Germany, April 2004.
[30] C. Montagne, S. Lelandais, A. Chaari, and M. B. Ahmed,
“Invariant couleur bas
´
e sur la transform
´
ee du boulanger—
application
`
a la localisation globale d’un robot d’int
´
erieur,”
in International Conference Sciences of Electronics, Technol-
og y of Information and Telecommunication (SETIT ’05),Susa,
Tunisia, March 2005.
[31] S. Lelandais, A. Chaari, A. Smolarz, C. Montagne, and B.
Jacquin, “A new color invariant for image retrieval using the
baker’s transformation,” in Beijing International Conference
on Imaging: Technology and Applications for the 21st Century
(BICI ’05), pp. 328–329, Beijing, China, May 2005.
[32] R. M. Haralick, K. Shanmugan, and I. Dinsytein, “Textural fea-
tures for image classification,” IEEE Transactions on Systems,
Man, and Cybernetics, vol. 3, no. 6, pp. 610–621, 1973.
[33] A. Tr
´
emeau and B. G
´
erin, “Utilisation de la matrice de cooc-
currence couleur pour l’analyse de texture,” in Automatic Con-
ference. Data-Processing Genius. Image (AGI ’96), pp. 303–306,
June 1996.
[34] K. Mikolajczyk and C. Schmid, “Scale & affine invariant inter-
est point detectors,” International Journal of Computer Vision,
vol. 60, no. 1, pp. 63–86, 2004.
[35] H. Tamura, S. Mori, and T. Yamawaki, “Textural features cor-
responding to visual perception,” IEEE Transactions on Sys-
tems, Man and Cybernetics, vol. 8, no. 6, pp. 460–473, 1978.
[36] K. S. Thyagarajan, T. Nguyen, and C. Persons, “A maximum
likelihood approach to texture classification using wavelet
transform,” in Proceedings of IEEE International Conference on
Image Processing (ICIP ’94), vol. 94, pp. 640–644, Austin, Tex,
USA, November 1994.
[37] V. Gouet and P. Montesinos, “Normalisation des images
en couleur face aux changements d’illumination,” in 13
`
eme
Congr
`
es Francophone AFRIF-AFIA de Reconnaissance des
Formes et Intelligence Artificielle (RFIA ’02), pp. 415–424,
Angers, France, January 2002.