Báo cáo hóa học: " Research Article Analysis of Gene Coexpression by B-Spline Based CoD Estimation" pot
Bạn đang xem bản rút gọn của tài liệu. Xem và tải ngay bản đầy đủ của tài liệu tại đây (684.29 KB, 10 trang )
Hindawi Publishing Corporation
EURASIP Journal on Bioinformatics and Systems Biology
Volume 2007, Article ID 49478, 10 pages
doi:10.1155/2007/49478
Research Article
Analysis of Gene Coexpression by B-Spline Based
CoD Estimation
Huai Li, Yu Sun, and Ming Zhan
Bioinformatics Unit, Branch of Research Resources, National Institute on Aging, National Institutes of Health,
Baltimore, MD 21224, USA
Received 31 July 2006; Revised 3 January 2007; Accepted 6 January 2007
Recommended by Edward R. Dougherty
The gene coexpression study has emerged as a novel holistic approach for microarray data analysis. Different indices have been
used in exploring coexpression relationship, but each is associated with certain pitfalls. The Pearson’s correlation coefficient, for
example, is not capable of uncovering nonlinear pattern and directionality of coexpression. Mutual information can detect non-
linearity but fails to show directionality. The coefficient of determination (CoD) is unique in exploring different patterns of gene
coexpression, but so far only applied to discrete data and the conversion of continuous microarray data to the discrete format could
lead to information loss. Here, we proposed an effective algorithm, CoexPro, for gene coexpression analysis. The new algorithm
is based on B-spline approximation of coexpression between a pair of genes, followed by CoD estimation. The algorithm was
justified by simulation studies and by functional semantic similarity analysis. The proposed algorithm is capable of uncovering
both linear and a specific class of nonlinear relationships from continuous microarray data. It can also provide suggestions for
possible directionality of coexpression to the researchers. The new algorithm presents a novel model for gene coexpression and
will be a valuable tool for a variety of gene expression and network studies. The application of the algorithm was demonstrated
by an analysis on ligand-receptor coexpression in cancerous and noncancerous cells. The software implementing the algorithm is
available upon request to the authors.
Copyright © 2007 Huai Li et al. This is an open access article distributed under the Creative Commons Attribution License, which
permits unrestricted use, distribution, and reproduction in any medium, provided the original work is properly cited.
1. INTRODUCTION
The utilization of high-throughput data generated by mi-
croarray gives rise to a picture of transcriptome, the com-
plete set of genes being expressed in a given cell or organ-
ism under a particular set of conditions. With recent inter-
ests in biological networks, the gene coexpression study has
emerged as a novel holistic approach for microarray data
analysis [1–4]. The coexpression study by microarray data al-
lows exploration of transcriptional responses that involve co-
ordinated expression of genes encoding proteins which work
in concert in the cell. Most of coexpression studies have been
based on the Pearson’s correlation coefficient [1, 2, 5]. The
linear model-based correlation coefficientprovidesagood
first approximation of coexpression, but is also associated
with certain pitfalls. When the relationship between log-
expression levels of two genes is nonlinear, the degree of co-
expression would be underestimated [6]. Since the correla-
tion coefficient is a symmetrical measurement, it cannot pro-
vide evidence of directional relationship in which one gene
is upstream of another [7]. Similarly, mutual information is
also not suitable for modeling directional relationship, al-
though applied in various coexpression studies [8, 9]. The
coefficient of determination (CoD), on the other hand, is
capable of uncovering nonlinear relationship in microarray
data and suggesting the directionality, thus has been used in
prediction analysis of gene expression, determination of con-
nectivity in regulatory pathways, and network inference [10–
14]. However, the application of CoD in microarray analysis
so far can only be applied to discrete data, and continuous
microarray data must be converted by quantization to the
discrete format prior application. The conversion by quan-
tization could lead to the loss of important biological infor-
mation, especially for a dataset with a small sample size and
low data quality. Moreover, quantization is a coarse-grained
approximation of gene expression pattern and the resulting
data may represent “qualitative” relationship and lead to bi-
ologically erroneous conclusions [15].
B-spline is a flexible mathematical formulation for curve
fitting due to a number of desirable properties [16]. Under
2 EURASIP Journal on Bioinformatics and Systems Biology
the smoothness constraint, B-spline gives the “optimal”
curve fitting in terms of minimum mean-square error [16,
17]. Recently, B-spline has been widely used in microarray
data analysis, including inference of genetic networks, esti-
mation of mutual information, and modeling of time-series
gene expression data [7, 17–23]. In a Bayesian network model
for genetic network construct ion from microarray data [7],
B-spline has been used as a basis f unction for nonparametric
regression to capture nonlinear relationships between genes.
In numerical estimation of mutual information from contin-
uous microarray data [23], a generalized indicator function
based on B-spline has been proposed to get more accurate
estimation of probabilities. By treating the gene expression
level as a continuous function of time, B-spline approaches
have been used to cluster genes based on mixture models
[17, 19, 22], and to identify differential-expressed genes over
the time [18, 21]. All the studies have shown the great useful-
ness of the B-spline approach for microarray data analysis.
In this study, we proposed a new algorithm, CoexPro,
which is based on B-spline approximation followed by CoD
estimation, for gene coexpression analysis. Given a pair
of genes g
x
and g
y
with expression values {(x
i
, y
i
), i =
1, , N}, we first employed B-spline to construct the func-
tion relationship
y = F(x) of the expression level y of gene
g
y
given the expression level x of gene g
x
in the (x, y) plane.
We then computed CoD to determine how well the expres-
sion of gene g
y
is predicted by the expression of gene g
x
based on the B-spline model. The proposed modeling is able
to address specific nonlinear relationship in gene coexpres-
sion, in addition to linear correlation, it can suggest possible
directionality of interac tions, and can be calculated directly
from microarray data. We demonstrated the effectiveness of
the new algorithm in disclosing different patterns of coex-
pression using both simulated and real gene-expression data.
We validated the identified gene coexpression by examining
the biological and physiological significances. We finally used
the proposed method to analyze expression profiles of lig-
ands and receptors in leukemia, lung cancer, prostate can-
cer, and their normal tissue counterparts. The algorithm cor-
rectly identified coexpressed ligand-receptor pairs specific to
cancerous tissues and provided new clues for the understand-
ing of cancer development.
2. METHODS
2.1. Model for gene coexpression of mixed patterns
Given a two-dimensional scatter plot of expression for a
pair of genes g
x
and g
y
with expression values {(x
i
, y
i
), i =
1, , N}, it allows us to explore if there are hidden coexpres-
sion patterns between the two genes through modeling the
plotted pattern. Here, we propose to use B-spline to model
the functional relationship
y = F(x) of the expression level y
of gene g
y
given the expression level x of gene g
x
in the (x, y)
plane. Mathematically, it is most convenient to express the
curve in the form of x
= f (t)andy = g(t), where t is some
parameter, instead of using implicit equation just involving x
and y. This is called a parametric representation of the curve
that has been commonly used in B-spline curve fitting [16].
Once we have the model, we compute CoD to determine
how well the expression of gene g
y
is predicted by the expres-
sion of gene g
x
. The CoD allows measurement of both linear
and specific nonlinear patterns and suggests possible direc-
tionality of coexpression. Continuous data from microarray
can be directly used in the calculation without transforma-
tion into the discrete format, hence avoiding potential loss or
misrepresentation of biological information.
2.1.1. Two-dimensional B-spline approximation
The two-dimensional (2D) B-spline is a set of piecewise poly-
nomial functions [16]. Using the notion of parametric rep-
resentation, the 2D B-spline curve can be defined as follows:
x
y
=
f (t)
g(t)
=
n+1
j=1
B
j,k
(t)
x
j
y
j
, t
min
≤ t<t
max
. (1)
In (1),
x
j
y
j
, j = 1, , n +1
are n + 1 control points as-
signed from data samples. t is a parameter and is in the range
of maximum and minimum values of the element in a knot
vector. A knot vector, t
1
, t
2
, , t
k+(n+1)
, is specified for giving
a number of control points n + 1 and B-spline order k.Itis
necessary that t
j
≤ t
j+1
,forallj. For an open curv e, open-
uniform knot vector should be used, which is defined as
t
j
= t
1
= 0, j ≤ k,
t
j
= j − k, k<j<n+2,
t
j
= t
k+(n+1)
= n − k +2, j ≥ n +2.
(2)
For example, if k
= 3, n +1 = 10, the open-uniform knot
vector is equal to [
0001234567888
]. In this
case, t
min
= 0, t
max
= 8, and 0 ≤ t<8.
The B
j,k
(t) basis functions are of order k. k must be at
least 2, and can be no more than n +1.TheB
j,k
(t)depend
only on the value of k and the values in the knot vector. The
B
j,k
(t) are defined recursively as:
B
j,1
(t) =
⎧
⎨
⎩
1, t
j
≤ t<t
j+1
,
0, otherwise,
B
j,k
(t) =
t − t
j
t
j+k−1
− t
j
B
j,k−1
(t)+
t
j+k
− t
t
j+k
− t
j+1
B
j+1,k−1
(t).
(3)
Given a pair of genes g
x
and g
y
with expression values
{(x
i
, y
i
), i = 1, , N}, n + 1 control points {(x
j
, y
j
), j =
1, , n +1} selected from {(x
i
, y
i
), i = 1, , N}, a knot vec-
tor, t
1
, t
2
, , t
k+(n+1)
, and the order of k, the plotted pattern
can be modeled by (1). In (1), f (t)andg(t) are the x and y
components of a point on the curve, t is a parameter in the
parametric representation of the curve.
2.1.2. CoD estimation
If one uses the MSE metric, then CoD is the ratio of the
explained variation to the total variation and denotes the
strength of association between predictor genes and the tar-
get gene. Mathematically, for any feature set X,CoDrelative
Huai Li et al. 3
to the target variable Y is defined as CoD
X→Y
= (ε
0
− ε
X
)/ε
0
,
where ε
0
is the prediction error in the absence of predictor
and ε
X
is the error for the optimal predictors. For the purpose
of exploring coexpression pattern, we only consider a pair of
genes g
x
and g
y
,whereg
y
is the target gene that is predicted
by the predictor gene g
x
. The errors are estimated based on
available samples (resubstitution method) for simplicity.
Given a pair of genes g
x
and g
y
with expression values x
i
and y
i
, i = 1, , N,whereN is the number of samples, we
construct the predictor
y = F(x) for predicting the target ex-
pression value y. If the error is the mean-square error (MSE),
then CoD of gene g
y
predicted by gene g
x
can be computed
according to the definition
CoD
g
x
→g
y
=
ε
0
− ε
X
ε
0
=
N
i
=1
y
i
− y
2
−
N
i
=1
y
i
− F
x
i
2
N
i=1
y
i
− y
2
.
(4)
When the relationship is linear or approximately linear, CoD
and the correlation coefficient are equivalent measurements
since CoD is equal to R
2
if F(x
i
) = mx
i
+ b. As the relation-
ship departs from linearit y, however, CoD can capture some
specific nonlinear information whereas the correlation coef-
ficient fails. In terms of prediction of direction, both the cor-
relation coefficient and mutual information are symmetri-
cal measurements that cannot provide evidence of which way
causation flows. CoD, however, can suggest the direction of
gene relationship. In other words, CoD
g
x
→g
y
is not necessar-
ily equal to CoD
g
y
→g
x
. This feature makes CoD to be uniquely
useful, especially in network inference.
The key point for computing CoD from (4) is to find the
predictor
y = F(x) from continuous data samples (x
i
, y
i
).
Motivated by the spirit of B-spline, we formulate an algo-
rithm to estimate the CoD from continuous data of gene ex-
pression. T he proposed algorithm is summarized as follows.
Input
(i) A pair of genes g
x
and g
y
with expression values x
i
and
y
i
, i = 1, , N. N is the number of samples.
(ii) M intervals of control points. By given N and M, the
number of control points (n + 1) is determined as n
=
N/M,where· is the floor function.
(iii) Spline order k.
Output
(i) CoD of gene g
y
predicted by gene g
x
.
Algorithm
(i) Fit two-dimensional B-spline curve
x
y
=
f (t)
g(t)
in the
(x, y) plane based on (n + 1) control points
x
j
y
j
, j =
1, , n +1
, a knot vector, t
1
, t
2
, , t
k+(n+1)
, and the
order of k.
(1) Find indices of
x
i
y
i
, i = 1, , N
, where (x
1
≤
x
2
≤ ··· ≤ x
N
) are ordered as monotonic
increasing from (x
1
, x
2
, , x
N
), y
i
is the value
corresponding to the same index as x
i
.
(2) Assign (n + 1) control points as:
x
j
y
j
=
x
1+( j−1)×M
y
1+( j−1)×M
, j = 1, , n
and
x
n+1
y
n+1
=
x
N
y
N
.
(3) Compute the B
j,k
(t) basis functions recursively
from (3).
(4) Formulate
x
y
=
f (t)
g(t)
=
n+1
j=1
B
j,k
(t)
x
j
y
j
based on (1).
(ii) Calculate CoD of gene g
y
predicted by gene g
x
.
(1) Compute mean expression value of g
y
as y =
N
i=1
y
i
/N.
(2) For i
= 1, , N,findy
i
= F(x
i
) by eliminating
t between x
= f (t)andy = g(t). First find t
i
=
arg{min
t
| f (t) − x
i
|}.Thencomputey
i
= g(t
i
).
(3) Calculate CoD from (4) based on the ordered
sequence
x
i
y
i
, i = 1, , N
.Referto(4),
CoD value is the same as calculated based on
x
i
y
i
, i = 1, , N
. Including the special cases,
we have (1) ε
0
> 0, if ε
0
≥ ε
X
,computeCoD
from (4); else set CoD to 0. (2) ε
0
= 0, if ε
X
= 0,
set CoD to 1; else set CoD to 0.
2.1.3. Statistical significance
For a given CoD value estimated on the basis of B-spline
approximation (referred to as CoD-B in the following), the
probability (P
shuffle
) of obtaining a larger CoD-B at random
between gene g
x
and g
y
is calculated by randomly shuffling
one of the expression profiles through Monte Carlo simula-
tion. In the simulation, a random dataset is created by shuf-
fling the expression profiles of the predictor gene g
x
and the
target gene g
y
, and CoD-B is estimated based on the random
dataset. This process is repeated 10,000 times under the con-
dition that the parameters k and M are kept constant, and
the resulting histog ram of CoD-B shows that it can be ap-
proximated by the half-normal distribution. We then deter-
mine P
shuffle
according to the derived probability distribution
of CoD-B from the simulation.
2.2. Scheme for coexpression identification
Based on the new algorithm developed, we propose a scheme
for identifying coexpression of mixed patterns by using CoD-
B as the measuring score. We first calculate CoD-B from gene
expression data for each pair of genes under experimental
conditions A and B. For example, condition A represents
the cancer state and condition B represents the normal state.
Then under the cutoff values of CoD-B (e.g., 0.50) and P
shuffle
(e.g., 0.05), we select the set of gene pairs that are significantly
coexpressed under condition A and the set of gene pairs that
are not significantly coexpressed under condition B as fol-
lows:
setA :
= (Coexpressed pairs, satisfy CoD-B ≥ 0.50 AND
P
shuffle
< 0.05),
setB :
= (Coexpressed pairs, satisfy CoD-B < 0.50 AND
P
shuffle
< 0.05).
4 EURASIP Journal on Bioinformatics and Systems Biology
The set of significantly coexpressed gene pairs to differentiate
condition A from condition B is chosen as the intersect of
setA and setB: setC
= setA ∩ setB.
2.3. Software and experimental validation
We have implemented a Java-based interactive computa-
tional tool for the CoexPro algorithm that we have devel-
oped. All computations were conducted using the software.
The effects of the number of control points and the or-
der k of the B-spline function for CoD estimation were as-
sessed from the simulated datasets which contain four differ-
ent coexpression patterns: (1) linear pattern, (2) nonlinear
pattern I (piecewise pattern), (3) nonlinear pattern II (sig-
moid pattern), and (4) random pattern for control. Each
dataset contained 31 data points. The coexpression profiles
of the four simulated patterns are shown in Supplementary
Figures S1A, S1C, S1E, and S1G (supplementary figures are
available at doi:10.1155/2007/49478). For each pattern, the
averaged CoD (
CoD) and Z-Score (Z) values were calculated
under different B-spline orders (k) and control points in-
tervals (M). For computing
CoD and Z-Score, the original
dataset was shuffled 10,000 times.
CoD was obtained by aver-
aging CoD values of the shuffled data. Z-Score was calculated
as Z
= (CoD − CoD)/σ, where CoD was estimated from the
original dataset and σ was the standard de viation.
The CoexPro algorithm was first validated for its abil-
ity of capturing different coexpression patterns by compar-
ing the results from CoD-B, CoD estimated from quantized
data (referred to as CoD-Q in the following), and the cor-
relation coefficient (R). The validation was conducted on
the four simulated datasets described above and four real
expression datasets representing four different coexpression
patterns (normal tissue array data; obtained from the GEO
database with the accession number GSE 1987). The coex-
pression profiles of the four real-data patterns are shown in
Supplementary Figures S1B, S1D, S1F, and S1H. For getting
quantized data, gene expression values were discretized into
three categories: over expressed, equivalently expressed, and
under expressed, depending whether the expression level was
significantly lower than, similar to, or greater than the respec-
tive control threshold [11, 14]. Since some genes had small
natural range of variation, z-tra nsformation was used to nor-
malize the expression of genes across experiments, so that the
relative expression levels of all genes had the same mean and
standard derivation. The control threshold was then set to be
one standard derivation for the quantization.
The proposed algorithm was next validated for its ability
of identifying biologically significant coexpression. The vali-
dation was conducted by functional semantic similarity anal-
ysis. The analysis was based on the gene ontology (GO), in
whicheachgeneisdescribedbyasetofGOtermsofmolecu-
lar functions, biological process, or cellular components that
the gene is associated to (). The
functional semantic similarity of a pair of genes g
x
and g
y
was measured by the number of GO terms that they shared
(GO
g
x
∩ GO
g
y
), where GO
g
x
denotes the set of GO terms for
gene g
x
and GO
g
y
denotes the set of GO terms for gene g
y
.
The semantic similarity was set to zero if one or both genes
had no GO terms. The semantic similarity was calculated
from six sets of coexpression gene pairs: (1) those nonlin-
ear coexpression pairs identified by CoD-B; (2) those linear
coexpression pairs identified by CoD-B; (3) those nonlinear
coexpression pairs identified by CoD-Q; (4) those linear co-
expression pairs identified by CoD-Q; (5) those coexpression
pairs identified by correlation coefficient (R); and (6) those
from randomly selected gene pairs. The real gene expression
data used in this analysis were Affymetrix microarray data
derived from the normal white blood cell (obtained from the
GEO database with the accession number GSE137). The re-
sulting distributions of similarity scores from the six gene
pair data sets were examined by the Kolmogorov-Smirnov
test for the statistical differences.
The proposed algorithm was finally validated by a case
study on ligand-receptor coexpression in cancerous and nor-
mal tissues. The ligand-receptor cognate pair data were ob-
tained from the database of ligand-receptor partners (DLRP)
[5]. The gene expression data used in this study included
Affymetrix microarray data derived from dissected tissues of
acute myeloid leukemia (AML), lung cancer, prostate can-
cer, and their normal tissue counterparts (downloaded from
the GEO database with accession numbers GSE 995, GSE
1987, GSE 1431, resp.). Each of these microarray datasets
contained about 30 patient cancer samples and 10 normal
tissue samples. The array data were normalized by the robust
multiarray analysis (RMA) method [24].
3. RESULTS AND DISCUSSION
3.1. B-spline function and optimization
We applied the B-spline function for approximation of the
plotted pattern of a pair of genes, prior to CoD estimation of
coexpression. The shape of a curve fitted by B-spline is spec-
ified by two major parameters: the number of control points
sampled from data and the B-spline order k. Under differ-
ent control points, the shape of a modeling curve would be
different. On the other hand, increasing the order k would
increase the smoothness of a modeling curve. We assessed
these parameters for their influence on the CoD estimation.
The assessment was conducted based on four coexpression
patterns derived by simulation: (1) linear pattern, (2) non-
linear pattern I (piecewise pattern), (3) nonlinear pattern II
(sigmoid pattern), and (4) random pattern (see Section 2 ).
The coexpression profiles of the four simulated patterns are
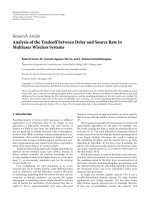
shown in Supplementary Figure S1. Figures 1(a) and 1(b)
show plots of averaged CoD (
CoD) and Z-Score, respectively,
under different B-spline orders (k)atfixedM
= 3. CoD was
computed based on 10,000 shuffled data sets and Z-Score
was calculated as Z
= (CoD − CoD)/σ, where CoD was esti-
mated from the original dataset and σ was the standard devi-
ation. A high Z-Score value indicated that the CoD estimated
from the real pattern was beyond random expectation. As
indicated, Z-Score showed no sig n of improvement when k
increased up to 4 or above in both linear and nonlinear co-
expression patterns. Figures 1(c) and 1(d) show plots of
CoD
and Z-Score, respectively, under different number M of con-
trol point intervals at fixed k
= 4. As indicated, at M = 1
Huai Li et al. 5
0.05
0.052
0.054
0.056
0.058
0.06
0.062
0.064
0.066
0.068
Averaged CoD
2345
Order k
Linear
Nonlinear-I
Nonlinear-II
Random
(a)
−2
0
2
4
6
8
10
12
Significance
2345
Order k
Linear
Nonlinear-I
Nonlinear-II
Random
(b)
0
0.1
0.2
0.3
0.4
0.5
0.6
0.7
0.8
0.9
Averaged CoD
12345678910
Interval of control points
Linear
Nonlinear-I
Nonlinear-II
Random
(c)
−5
0
5
10
15
20
25
30
35
Significance
12345678910
Interval of control points
Linear
Nonlinear-I
Nonlinear-II
Random
(d)
Figure 1: Estimation of averaged CoD and significance at different spline orders k and control point intervals M under linear, nonlinear I
(piecewise pattern), nonlinear II (sigmoid pattern), and random coexpression patterns. The data sets of the four patterns were generated by
simulation. The averaged CoD and significance were calculated from 10,000 shuffled realizations of the dataset. (a) and (b) show averaged
CoD and significance calculated under different spline orders k at fixed M
= 3. (c) and (d) show averaged CoD and significance calculated
under different number M of control point intervals at fixed k
= 4.
(i.e., all data points from samples were used as the control
points), a data over-fitting phenomenon was observed, where
CoD was high but Z-Score was low in all data patterns. The
increase of M led to the decrease of
CoD and increase of Z-
Score. Based on the results and taking into account of small
sample sizes in microarray data, we set M
= 3andk = 4em-
pirically for the identification of coexpression in this study.
3.2. Justification of algorithm
In order to justify our algorithm, we compared CoD-B, CoD-
Q, and the correlation coefficient (R)fortheirpowerofcap-
turing different coexpression patterns, particularly nonlin-
ear and directional relationships. Four different coexpression
patterns were analyzed: linear, nonlinear I (piecewise pat-
tern), nonlinear II (sigmoid pattern), and random patterns
(see Section 2; Supplementary Figure S1). Table 1 shows the
results. As expected, for the linear coexpression pattern,
CoD-B, CoD-Q, and R
2
values were al l significantly high
and CoD-B performed well in both simulated and real data
(p-value < 1.0E-6) (see Table 1). For the random pattern,
both CoD-B and R
2
were very low as expected. But CoD-Q
failed to uncover the random pattern, showing significantly
high values (0.68 in the simulated data set and 0.65 in the
6 EURASIP Journal on Bioinformatics and Systems Biology
Table 1: Comparison of CoD estimated by our algorithm (CoD-B), CoD estimated from quantized data (CoD-Q), and correlation coeffi-
cient (R
2
) under different coexpression patterns.
Coregulated pattern
Simulated data Real data
CoD-B CoD-Q R
2
CoD-B CoD-Q R
2
(P
shuffle
)(P
shuffle
)(P
shuffle
) (P
shuffle
)(P
shuffle
)(P
shuffle
)
Linear
0.98 0.98 0.99 0.65 0.68 0.68
(1.0E-6) (1.0E-6) (1.0E-6) (1.0E-6) (3.3E-2) (4.7E-3)
Nonlinear-I
0.94 0.80 1.8E-5 0.68 0.84 0.31
(1.0E-6) (1.0E-6) (9.5E-2) (4.6E-3) (1.2E-3) (2.1E-3)
Nonlinear-II
0.98 0.93 0.57 0.79 0.79 0.10
(1.0E-6) (1.0E-6) (1.0E-6) (8.2E-3) (6.8E-3) (1.9E-2)
Random
1.0E-5 0.68 0.0026 1.0E-05 0.65 0.051
(6.2E-1) (7.4E-1) (4.3E-1) (6.6E-1) (3.3E-1) (2.5E-1)
real-array data). For the nonlinear patterns, both CoD-B and
CoD-Q performed well with significantly high values, while
R
2
was low and unable to reveal the patterns. As shown in
Table 1, for the nonlinear pattern I, CoD-B was 0.94 with
p-value 1.0E-6, CoD-Q was 0.80 with p-value 1.0E-6, while
R
2
was 1.8E-5 with p-value 9.5E-2 in the simulated data. In
the real data, CoD-B was 0.68 with p-value 4.6E-3, CoD-Q
was 0.84 with p-value 1.2E-3, while R
2
was 0.31 with p-value
2.1E-3. A similar trend was also observed for the nonlinear
pattern II (see Ta b le 1).
It is important to explore nonlinear coexpression pattern
and directional relationship in gene expression for gene reg-
ulation or pathway studies. The two nonlinear patterns that
we examined in this study can represent different biological
events. The nonlinear pattern I (piecewise pattern; Supple-
mentary Figures S1C–S1D) may represent a negative feed-
back event: gene g
x
and gene g
y
initially have a positive cor-
relation until gene g
x
reaches a certain expression level then
the correlation b ecomes negative. The nonlinear pattern II
(sigmoid pattern; Supplementary Figures S1E–S1F) may rep-
resent two consecutive biological events: threshold and satu-
ration. Initially, gene g
x
’s expression level increases without
affecting gene g
y
’s expression activity. When the level of gene
g
x
reaches a certain threshold, gene g
y
’s expression starts to
increase with g
x
.Butaftergeneg
x
’s level reaches a second
threshold, its effect on gene g
y
becomes saturated and gene
g
y
’s level plateaued. The directional relationship, particularly
the interaction between transcription factors and their tar-
gets, on the other hand, is an important component in gene
regulatory network or pathways. Our algorithm provides ef-
fective means to analyze nonlinear coexpression pattern and
uncover directional relationship from microarray gene ex-
pression data.
In this study, we estimated the errors arising from CoD-B
and CoD-Q calculation by the resubstitution method based
on available samples for simplicity. Other methods, such as
bootstrapping, could also be applied for the error estimation,
especially when the sample size is small. In exploring coex-
pression pattern, our algorithm at the current version deals
with a pair of genes g
x
and g
y
,whereg
y
is the target gene that
is predicted by the predictor gene g
x
. In the future, we would
extend our algorithm to explore multivariate gene relations
as well.
3.3. Biological significance of coexpression
identified by CoD-B
We validated our algorithm for its ability of capturing biolog-
ically meaningful coexpression by functional semantic simi-
larity analysis of coexpressed genes identified. The semantic
similarity measures the number of the gene ontology (GO)
terms shared by the two coexpressed genes [2, 25]. Six sets of
coexpression gene pairs were subjected to the semantic sim-
ilarity analysis: (1) 9419 nonlinear coexpression pairs picked
up by CoD-B but not by the correlation coefficient (R) (cut-
off value is 0.70 for both CoD-B and R
2
); (2) 8225 linear co-
expression pairs picked up by both CoD-B and R
2
using the
same cutoff; (3) 39406 nonlinear coexpression pairs picked
up by CoD-Q but not by R
2
using the same cutoff; (4) 8408
linear coexpression pairs picked up by both CoD-Q and R
2
using the same cutoff; (5) 11596 coexpression pairs picked
up by R
2
using the same cutoff; and (6) 250000 randomly se-
lected gene pairs used for control. The gene expression data
from the normal white blood cell were used for the anal-
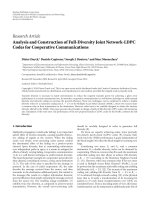
ysis. Figure 2 shows the distribution of semantic similarity
scores under these datasets. For the random gene pairs, the
cumulative probability of the gene pairs reached to 1 when
the functional similarity was as high as 8. This indicated that
all of the random gene pairs had the functional similarity 8
or below. In contrast, for the coexpressed genes identified by
CoD-B, the cumulated probability of 1 (i.e., 100% of gene
pairs) corresponded to the semantic similarity above 30, in-
dicative of much higher functional similarities between the
coexpressed genes identified. The distributions of similarity
scores derived from the two coexpressed gene datasets were
very similar to each other while both were significantly dif-
ferent from that of randomly generated gene pairs (P<10E-
10 by the Kolmogorov-Smirnov test). For the coexpressed
Huai Li et al. 7
0
0.1
0.2
0.3
0.4
0.5
0.6
0.7
0.8
0.9
1
Cumulative probability
0 5 10 15 20 25 30 35
Semantic similarity
Random pairs
Linear Coex-pairs by CoD-B
Nonlinear Coex-pairs by CoD-B
Linear Coex-pairs by CoD-Q
Nonlinear Coex-pairs by CoD-Q
Coex-pairs by R
Figure 2: The distributions of functional similarity scores in six
sets of gene pairs. The square line on the plot represents the dis-
tribution of randomly selected gene pairs, the circle line is that
of linearly coexpressed gene pairs picked up by CoD-B, the tri-
angle line represents that of nonlinearly coexpressed gene pairs
picked up by CoD-B, the star line is that of linearly coexpressed
gene pairs picked up by CoD-Q, the diamond line represents that
of nonlinearly coexpressed gene pairs picked up by CoD-Q, and
the downward-pointing triangle line represents that of coexpressed
gene pairs picked up by correlation coefficient (R). The x-axis in-
dicates functional semantic similarity scores (GO term overlap; see
Section 2). For the random gene pairs, the cumulative probability of
gene pairs reached to 1 when the functional similarity was up to 8.
That meant all the random gene pairs had the functional similarity
8 or below. In contrast, for coexpressed genes picked up by CoD-B,
the cumulated probability did not reache 1 (i.e., 100% of gene pairs)
until the functional similarity was over 30, indicative of high func-
tional similarities in the coexpressed genes. The accumulative dis-
tributions were significantly different from that of randomly gener-
ated gene pairs (P<10E-10 by the Kolmogorov-Smirnov test). For
the coexpressed genes identified by CoD-Q, the curves of cumu-
lated probability laid between the curves in the case of CoD-B and
in the random case. The cumulated probability of 1 corresponded
to the semantic similarity above 25. For the coexpressed genes iden-
tified by R, the curves of cumulated probability also laid between
the curves in the case of CoD-B and in the random case.
genes identified by CoD-Q, the curves of cumulated prob-
ability laid between the curves in the case of CoD-B and the
curve in the random case. The cumulated probability of 1
corresponded to the semantic similarity above 25. For the
coexpressed genes identified by R
2
, the curves of cumulated
probability also laid between the curves in the case of CoD-B
and in the random case. The results suggest that the new al-
gorithm is effective in identifying biologically significant co-
expression of both linear and nonlinear patterns.
3.4. Case study: coexpression of ligand-receptor pairs
We finally used our new algorithm to analyze coexpression
of ligands and their corresponding receptors in lung can-
cer, prostate cancer, leukemia, and their normal tissue coun-
terparts. Significantly coexpressed ligand and receptor pairs
were identified in the cancer and normal tissue groups a t the
thresholds of R
2
and CoD-B 0.50 and P
shuffle
0.05. The re-
sults are shown in Supplementary Tables S1 to S6. By apply-
ing the criteria of differential coexpression (see Section 2),
we identified ligand-receptor pairs which showed differen-
tial coexpression between cancerous and normal tissues, as
well as among different cancers. Table 2 lists the differen-
tially coexpressed genes between lung cancer and normal tis-
sues. The values of CoD-Q and R
2
are also listed in the ta-
ble for comparison. Supplementary Tables S7 and S8 list the
differentially coexpressed genes in AML and prostate can-
cer, respectively. 12 ligand-receptor pairs were differentially
coexpressed between lung cancer and normal tissues (the
CoD-B difference > 0.40) (see Table 2 ). The ligand BMP7
(bone morphogenetic protein 7), related to cancer develop-
ment [26, 27], was one of the differentially coexpressed genes.
For BMP7 and its receptor ACVR2B (activin receptor IIB),
the CoD-B was 0.76 (P
shuffle
< 2.8E-2) in the lung cancer
and 0.00 (P
shuffle
< 5.8E-1) in the nor mal tissue, the CoD-
Q was 0.75 (P
shuffle
< 2.9E-2) in the lung cancer and 0.00
(P
shuffle
< 5.7E-1) in the normal tissue, and the R
2
value
was 0.043 (P
shuffle
< 2.9E-2) in the lung cancer and 0.0012
(P
shuffle
< 1.0E-1) in the normal tissue (see Table 2). BMP7
and ACVR2B therefore showed nonlinear coexpression in the
lung cancer while not coexpressed in the normal tissue. The
nonlinear coexpression relationship was detected by both
CoD-B and CoD-Q but not by R
2
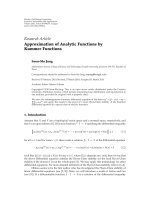
. The coexpression profile
(see Figure 3(a)) further showed that the two genes displayed
approximately the nonlinear pattern I of coexpression, and
BMP7 was over expressed in the lung cancer as compared
with the normal tissue. These results are suggestive of a cer-
tain level of negative feedback involved in the interac tion be-
tween BMP7 and ACVR2B. The findings facilitate our under-
standing of the role of BMP7 in cancer development.
The ligand CCL23 (chemokine ligand 23) and its recep-
tor CCR1 (chemokine receptor 1), on the other hand, ex-
hibited high linear coexpression in the normal lung tissue
while were not coexpressed in cancerous lung samples. As
shown in Tabl e 2, the CoD-B value of the gene pair was 0.85
in the normal tissue while 0.00 in the lung cancer, the CoD-
Q value of the gene pair was 0.87 in the normal tissue while
0.62 in the lung cancer, and the R
2
value was 0.92 in the nor-
mal tissue and 0.054 in the lung cancer. In this case, CoD-
BandR
2
differentiated the coexpression patterns of the two
genes under different conditions but CoD-Q failed. The co-
expression profile (see Figure 3(b)) further showed that the
two genes displayed approximately the linear pattern of co-
expression in the normal condition. Similarly, CCL23 and
CCR1 were also highly coexpressed in the normal prostate
samples (CoD-B
= 0.85) but not coexpressed in the cancer-
ous prostate samples (CoD-B
= 0.00) (see Supplementary
Table S8). However, CCL23 and CCR1 were not coexpressed
8 EURASIP Journal on Bioinformatics and Systems Biology
Table 2: List of ligand-receptor pairs which showed differential coexpression between the lung cancer and normal tissue based on CoD-B.
The values of CoD-Q and R
2
of ligand-receptor pairs are also listed in the table for comparison.
Ligand Receptor
CoD-B CoD-Q R
2
(P
shuffle
) (P
shuffle
) (P
shuffle
)
Cancer No rmal Cancer No rmal Cancer Normal
BMP7 ACVR2B
0.76 0.00 0.75 0.00 0.043 0.0012
(2.8E-2) (5.8E-1) (2.9E-2) (5.7E-1) (2.9E-2) (1.0E-1)
EFNA3 EPHA5
0.84 0.00 0.66 0.52 0.22 0.0072
(6.7E-6) (6.9E-1) (3.4E-1) (1.6E-1) (1.7E-2) (8.1E-1)
EGF EGFR
0.50 0.00 0.64 0.55 0.20 0.0034
(9.1E-4) (6.6E-1) (9.1E-1) (2.2E-1) (1.2E-2) (8.8E-1)
EPO EPOR
0.49 0.00 0.092 0.00 0.14 0.0022
(1.6E-5) (7.1E-1) (5.7E-2) (5.0E-1) (3.3E-2) (8.9E-1)
FGF8 FGFR2
0.55 0.00 0.70 0.71 0.30 0.19
(1.5E-7) (6.6E-1) (2.1E-1) (4.0E-1) (3.4E-3) (2.5E-1)
IL16 CD4
0.62 0.031 0.76 0.56 0.40 0.21
(2.7E-6) (6.8E-1) (4.2E-2) (2.7E-1) (4.9E-4) (2.1E-1)
CCL7 CCBP2
0.48 0.00 0.44 0.61 0.028 0.086
(4.7E-5) (6.7E-1) (7.4E-2) (5.0E-1) (3.5E-1) (4.2E-1)
CCL23 CCR1
0.00 0.85 0.62 0.87 0.054 0.92
(7.3E-1) (2.1E-9) (8.0E-1) (1.5E-2) (2.3E-1) (3.0E-4)
IL1RN IL1R1
0.23 0.83 0.61 0.81 0.00 0.90
(7.7E-2) (8.4E-7) (7.2E-1) (7.1E-2) (9.6E-1) (2.3E-4)
IL18 IL18R1
0.18 0.71 0.69 0.67 0.23 0.64
(9.7E-2) (4.5E-6) (8.1E-1) (1.9E-1) (9.0E-3) (9.3E-3)
IL13 IL13RA2
0.00 0.69 0.59 0.64 0.0071 0.69
(6.2E-1) (1.5E-4) (4.7E-1) (2.2E-1) (6.7E-1) (2.0E-2)
BMP5 BMPR2
0.00 0.61 0.58 0.61 0.12 0.60
(6.9E-1) (1.7E-4) (3.3E-1) (2.8E-1) (7.2E-2) (1.7E-2)
in either normal (CoD-B = 0.00) or AML samples (CoD-B =
0.00). The results suggest that CCL23 and CCR1 show differ-
ential coexpression not only between cancerous and normal
tissues, but also among different cancers. It has been reported
that chemokine members and their receptors contribute to
tumor proliferation, mobility, and invasiveness [28]. Some
chemokines help to enhance immunity against tumor im-
plantation, while others promote tumor proliferation [29].
Our results revealed the absence of a specific t ype of nonlin-
ear interaction, for example, as described in Section 2.3,be-
tween CCL23 and CCR1 in lung and prostate cancer samples
but not in AML samples, shedding light on the understand-
ing of the involvement of chemokine signaling in tumor de-
velopment.
We further identified different patterns of ligand-recep-
tor coexpression in cancer and normal tissues. In the lung
cancer, for example, 11 ligand-receptor pairs showed a linear
coexpression pattern, which were significant in both CoD-
BandR
2
, while 28 pairs showed a nonlinear pattern, which
were significant only in CoD-B (see Supplementary Table
S1). In the counterpart normal tissue, however, 35 ligand-
receptor pairs showed a linear coexpression pattern, while 6
pairs showed a nonlinear pattern (see Supplementary Table
S2). Such differences in the coexpression pattern were not
identified in previous coexpression studies based on the cor-
relation coefficient [5].
4. CONCLUSION
In summary, we proposed an effective algorithm based on
CoD estimation with B-spline approximation for modeling
and measuring gene coexpression pattern. The model can
address both linear and some specific nonlinear relation-
ships, suggest the directionality of interaction, and can be
calculated directly from microarray data without quantiza-
tion that could lead to information loss or misrepresenta-
tion. The newly proposed algorithm can be very useful in
analyzing a variety of gene expression in pathway or network
Huai Li et al. 9
0
20
40
60
80
100
120
140
160
ACVR2B
0 200 400 600 800 1000
BMP7
Lung cancer
Normal
(a)
0
100
200
300
400
500
600
700
800
900
CCR1
0 100 200 300 400 500 600 700 800
CCL23
Lung cancer
Normal
(b)
Figure 3: Coexpression profiles of two representative ligand-receptor pairs in lung cancer cells and normal cells. (a) BMP7 and ACVR2B in
lung cancer samples (P
shuffle
< 2.8E-2) and normal samples (P
shuffle
< 5.8E-1); (b) CCL23 and CCR1 in lung cancer samples (P
shuffle
< 7.3E-1)
and normal samples (P
shuffle
< 2.1E-9).
studies, especially in the case when there are specific nonlin-
ear relations between the gene expression profiles.
ACKNOWLEDGEMENT
This study was supported, at least in part, by the Intramural
Research Program, National Institute on Aging, NIH.
REFERENCES
[1] J. M. Stuart, E. Segal, D. Koller, and S. K. Kim, “A gene-
coexpression network for global discovery of conserved ge-
netic modules,” Science, vol. 302, no. 5643, pp. 249–255, 2003.
[2] H. K. Lee, A. K. Hsu, J. Sajdak, J. Qin, and P. Pavlidis, “Coex-
presion analysis of human genes across many microarray data
sets,” Genome Research, vol. 14, no. 6, pp. 1085–1094, 2004.
[3] V. van Noort, B. Snel, and M. A. Huynen, “The yeast coexpres-
sion network has a small-world, scale-free architecture and
can be explained by a simple model,” EMBO Reports, vol. 5,
no. 3, pp. 280–284, 2004.
[4] S. L. Carter, C. M. Brechbuhler, M. Griffin, and A. T. Bond,
“Gene co-expression network topology provides a framework
for molecular characterization of cellular state,” Bioinformat-
ics, vol. 20, no. 14, pp. 2242–2250, 2004.
[5] T. G. Graeber and D. Eisenberg, “Bioinformatic identification
of potential autocrine signaling loops in cancers from gene ex-
pression profiles,” Nature Genetics, vol. 29, no. 3, pp. 295–300,
2001.
[6] M. J. Herrg
˚
ard, M. W. Covert, and B. Ø. Palsson, “Reconcil-
ing gene expression data with known genome-scale regula-
tory network structures,” Genome Research, vol. 13, no. 11, pp.
2423–2434, 2003.
[7] S. Imoto, T. Goto, and S. Miyano, “Estimation of genetic
networks and functional structures between genes by us-
ing Bayesian networks and nonparametric regression,” Pacific
Symposium on Biocomputing, pp. 175–186, 2002.
[8] A. J. Butte and I. S. Kohane, “Mutual information relevance
networks: functional genomic clustering using pairw i se en-
tropy measurements,” Pacific Symposium on Biocomputing,pp.
418–429, 2000.
[9] X. Zhou, X. Wang, and E. R. Dougherty, “Construction
of genomic networks using mutual-information clustering
and reversible-jump Markov-chain-Monte-Carlo predictor
design,” Signal Processing, vol. 83, no. 4, pp. 745–761, 2003.
[10] S. Kim, H. Li, E. R. Dougherty, et al., “Can Markov chain mod-
els mimic biological regulation?” Journal of Biological Systems,
vol. 10, no. 4, pp. 337–357, 2002.
[11] R. F. Hashimoto, S. Kim, I. Shmulevich, W. Zhang, M. L.
Bittner, and E. R. Dougher ty, “Growing genetic regulatory
networks from seed genes,” Bioinformatics,vol.20,no.8,pp.
1241–1247, 2004.
[12] I. Shmulevich, E. R. Dougherty, S. Kim, and W. Zhang, “Prob-
abilistic Boolean networks: a rule-based uncertaint y model for
gene regulatory networks,” Bioinformatics,vol.18,no.2,pp.
261–274, 2002.
[13] E. R. Dougherty, S. Kim, and Y. Chen, “Coefficient of deter-
mination in nonlinear signal processing,” Signal Processing,
vol. 80, no. 10, pp. 2219–2235, 2000.
[14] H. Li and M. Zhan, “Systematic intervention of transcription
for identifying network response to disease and cellular phe-
notypes,” Bioinformati cs, vol. 22, no. 1, pp. 96–102, 2006.
[15] V. Hatzimanikatis and K. H. Lee, “Dynamical analysis of gene
networks requires both mRNA and protein expression infor-
mation,” Metabolic Engineering, vol. 1, no. 4, pp. 275–281,
1999.
[16] H. Prautzsch, W. Boehm, and M. Paluszny, B
´
ezier and B-Spline
Techniques, Springer, Berlin, Germany, 2002.
[17] P. Ma, C. I. Castillo-Davis, W. Zhong, and J. S. Liu, “A data-
driven clustering method for time course gene expression
data,” Nucleic Acids Research, vol. 34, no. 4, pp. 1261–1269,
2006.
10 EURASIP Journal on Bioinformatics and Systems Biology
[18] J. D. Storey, W. Xiao, J. T. Leek, R. G. Tompkins, and R. W.
Davis, “Significance analysis of time course microarray exper-
iments,” Proceedings of the National Academy of Sciences of the
United States of America, vol. 102, no. 36, pp. 12837–12842,
2005.
[19] Z.Bar-Joseph,G.K.Gerber,D.K.Gifford, T. S. Jaakkola, and
I. Simon, “Continuous representations of time-series gene ex-
pression data,” Journal of Computational Biology, vol. 10, no. 3-
4, pp. 341–356, 2003.
[20] K. Bhasi, A. Forrest, and M. Ramanathan, “SPLINDID: a semi-
parametric, model-based method for obtaining transcription
rates and gene regulation parameters from genomic and pro-
teomic expression profiles,” Bioinformatics, vol. 21, no. 20, pp.
3873–3879, 2005.
[21] W. He, “A spline function approach for detecting differentially
expressed genes in microarray data analysis,” Bioinformati cs,
vol. 20, no. 17, pp. 2954–2963, 2004.
[22] Y. Luan and H. Li, “Clustering of time-course gene expression
data using a mixed-effects model with B-splines,” Bioinformat-
ics, vol. 19, no. 4, pp. 474–482, 2003.
[23] C. O. Daub, R. Steuer, J. Selbig, and S. Kloska, “Estimating
mutual information using B-spline functions—an improved
similarity measure for analysing gene expression data,” BMC
Bioinformatics, vol. 5, no. 1, p. 118, 2004.
[24] R. A. Irizarry, B. M. Bolstad, F. Collin, L. M. Cope, B. Hobbs,
andT.P.Speed,“SummariesofAffymetrix GeneChip probe
level data,” Nucleic Acids Research, vol. 31, no. 4, p. e15, 2003.
[25] P.W.Lord,R.D.Stevens,A.Brass,andC.A.Goble,“Investi-
gating semantic similar ity measures across the gene ontology:
the relationship between sequence and annotation,” Bioinfor-
matics, vol. 19, no. 10, pp. 1275–1283, 2003.
[26]K.D.Brubaker,E.Corey,L.G.Brown,andR.L.Vessella,
“Bone morphogenetic protein signaling in prostate cancer cell
lines,” Journal of Cellular Biochemistry, vol. 91, no. 1, pp. 151–
160, 2004.
[27] S. Yang, C. Zhong, B. Frenkel, A. H. Reddi, and P. Roy-
Burman, “Diverse biological effect and Smad signaling of bone
morphogenetic protein 7 in prostate tumor cells,” Cancer Re-
search, vol. 65, no. 13, pp. 5769–5777, 2005.
[28] A. M
¨
uller, B. Homey, H. Soto, et al., “Involvement of
chemokine receptors in breast cancer metastasis,” Nature,
vol. 410, no. 6824, pp. 50–56, 2001.
[29] J. M. Wang, X. Deng, W. Gong, and S. Su, “Chemokines and
their role in tumor growth and metastasis,” Journal of Im-
munological Methods, vol. 220, no. 1-2, pp. 1–17, 1998.