Báo cáo hóa học: " Research Article New Structured Illumination Technique for the Inspection of High-Reflective Surfaces: Application for the Detection of Structural Defects" doc
Bạn đang xem bản rút gọn của tài liệu. Xem và tải ngay bản đầy đủ của tài liệu tại đây (2.37 MB, 14 trang )
Hindawi Publishing Corporation
EURASIP Journal on Image and Video Processing
Volume 2008, Article ID 237459, 14 pages
doi:10.1155/2008/237459
Research Article
New Structured Illumination Technique for the Inspection
of High-Reflective Surfaces: Application for the Detection of
Structural Defects without any Calibration Procedures
Yannick Caulier,
1
Klaus Spinnler,
1
Salah B ourennane,
2
and Thomas Wittenberg
1
1
Fraunhofer-Institut f
¨
ur Integrierte Schaltungen IIS, Am Wolfsmantel 33, 91058 Erlange n, Germany
2
GSM, Institut Fresnel, CNRS-UMR 6133,
´
Ecole Centrale Marse ille, Universit
´
e Aix-Marseille III, D.U. de Saint-J
´
er
ˆ
ome,
Marseille Cedex 20, France
Correspondence should be addressed to Yannick Caulier,
Received 31 January 2007; Accepted 29 November 2007
Recommended by Gerard Medioni
We present a novel solution for automatic surface inspection of metallic tubes by applying a structured illumination. The strength
of the proposed approach is that both structural and textural surface defects can be visually enhanced, detected, and well sepa-
rated from acceptable surfaces. We propose a machine vision approach and we demonstrate that this technique is applicable in
an industrial setting. We show that recording artefacts drastically increases the complexity of the inspection task. The algorithm
implemented in the industrial application and which permits the segmentation and classification of surface defects is briefly de-
scribed. The suggested method uses “perturbations from the stripe illumination” to detect, segment, and classify any defects. We
emphasize the robustness of the algorithm against recording artefacts. Furthermore, this method is applied in 24 h/7 day real-time
industrial surface inspection system.
Copyright © 2008 Yannick Caulier et al. This is an open access article distributed under the Creative Commons Attribution
License, which permits unrestricted use, distribution, and reproduction in any medium, provided the original work is properly
cited.
1. INTRODUCTION
One essential part of nondestructive surface inspection tech-
niques working in the visible light domain is the choice of the
appropriate illumination. Such an illumination allows to in-
crease the visibility of defective surfaces without amplifying
nondefective surface regions. In general, revealing more than
one type of defect necessitates at least two complementary
illumination technologies. As far as structural or textural de-
fectivesurfaceshavetobeinspected,adirected illumination
to enhance the visibility of structural defects or a diffuse il-
lumination to reveal textural defects [1] is required. Hence,
the primary goal of this work is to propose a new structured
illumination technology that reveals both the two types of
defective parts on specular surfaces.
In general, the application of structured illumination
techniques serves two major purposes: the first deals with the
retrieval of the depth information of a scene yielding an exact
three-dimensional reconstruction. The second deals with re-
covering the shape of an observed object. The most common
way is the projection of certain pattern of a structured light
in such a way that the knowledge of the projected pattern
combined with the observed deformation of the structure on
the object surface permits the retrieval of accurate depth in-
formation of the scene [2]. This method can be improved
by using more complex patterns, such as encoded light [3],
color-coded light [4], or Moire projection [5]. The principle of
all these methods is the combination of three-dimensional
information obtained by one or more of calibrated cameras
with information depicted in disturbances of the projected
light pattern. In contrast to these solutions, Winkelbach and
Wahl [6] proposed a reconstruction method of shapes in the
scene with only one stripe pattern and one camera by com-
puting the normal surface.
In opposite, a diffuse illumination technique is used when
object surfaces have to be inspected with respect to their tex-
ture. The aim of this illumination is to reveal different surface
types differing from their roughness and/or their color. The
former influences the image brightness of the depicted sur-
faces whereas the latter affects the type and the intensity of
the color. The choice of using grey (e.g., automatic inspection
of paper [7]ormetallicsurfaces[8]) or color (e.g., integrity
2 EURASIP Journal on Image and Video Processing
inspection of food articles [9] or wood surface inspection im-
ages depends on the application task.
In an industrial inspection and quality assurance work-
flows, the main task of a human inspector is to visually clas-
sify object surfaces as nondefective or as defective. Since such
visual inspection tasks are tedious and time consuming, ma-
chine vision systems are more and more applied for auto-
matic inspection. The two major constraints imposed by an
industrial inspection process are the high quality and the
high throughput of the objects to analyze.
The choice of an illumination technique is strongly mo-
tivated by the inspection task. An appropriate lighting is all
the more important as it represents the first element of a
machine vision workflow. The inspection systems of metallic
surfaces for industrial purpose involve manifold illumination
techniques. We found two different quantitative approaches
to reveal both textural and structural defects on metallic sur-
faces. In this context, quantitative means that the defective
surfaces are detected and not measured, as it is the case for
qualitative applications.
The first use retroreflective screens [10] as initially pro-
posed by Marguerre [11]torevealdeflectionsofreflective
surfaces. This technique has the advantage to reveal both
kinds of defective surfaces (textural and structural) but with
one inconvenient that both have similar appearances in the
images so that they cannot be discriminated afterwards.
The second necessitates at least two different illumina-
tion techniques. The Parsytec company [12]hasdevelopeda
dual sensor for recording object surface’s with a diffuse and a
direct light at the same time. Le
´
on and Beyerer [8] proposed
a technique where more than two images of the same object
recorded with different lighting techniques can be fused in
only one image. The major disadvantage of those approaches
is of course that they necessitate more than one illumination.
The direct consequence is that their integration in the indus-
trial process is more complex and that the data processing
chainismoreextensive.
In contrast to conventional computing techniques based
on a structured illumination, we propose a 2.5D approach
using structured light for the purpose of specular cylindri-
cal surfaces inspection. The deflection of the light rays is used
w ithout measuring the deformation of the projected rays in
the recording sensor, as this is achieved by deflectometric
methods [13].
We propose an algorithmic approach for the automatic
discrimination of defective surfaces with structural and tex-
tural defects and nondefective surfaces under the constrains
of recording artefacts. We demonstrate that it is possible to
obtain a high inspection quality, so that the requirements of
the automatic classification system of metallic surfaces are
fulfilled.
We further emphasize the robustness and the simplicity
of the proposed solution as no part of the recording setup
(cameras, light projector, object) has to be calibrated. Hence,
the aim of this work is
(i) to propose an adapted illumination technique for ma-
chine vision applications and so to demonstrate that
this lighting is specially adapted to the detection of
defects of micrometer depth on specular surfaces of
cylinders;
(ii) to show that based on this illumination both struc-
ture and texture information can be retrieved in one
camera recording without calibration of the recording
hardware;
(iii) to compare the proposed illumination with two other
lighting techniques;
(iv) to demonstrate that excellent classification results are
obtained using images of surface illuminated with the
proposed illumination technique;
(v) to describe and discuss the robustness of the proposed
method with respect to artefacts arising from noncon-
stant recording conditions such as the change of illu-
mination or variations of object positions.
This paper is organized as follows. We first introduce
the surface inspection and the corresponding classification
problem in Section 2. The recording situation of metallic
surfaces under structured stripe illumination is described in
Section 3. We compare the proposed illumination technique
with a diffuse and a retroreflector approaches in Section 4.
The proposed pattern recognition algorithm is described in
Section 6, and, in Section 7, based on a large and annotated
reference image dataset, we show the results, and discuss our
work in Section 8.
2. PROBLEM FORMULATION AND TASK DESCRIPTION
Our goal is to automatically discriminate between different
metallic object surfaces, for example, as “nondefective” and
“defective” while classifying digital images of these surfaces
acquired using structured light into predefined classes. Defect
types are on metallic surfaces manifold as they can be textural
defects, structural defects, or a combination of both. In the
considered industrial inspection, long cylindrical object sur-
facessuchastubesorroundrotsofdi
fferent diameters have
to be inspected. The automatic inspection should be done at
the end of the production line where the objects are moving
with a constant speed.
The requirements from the inspection task are twofold.
The first aim is to detect all the defective surfaces and in the
same time to have a low false alarm rate. As we consider two
kinds of defective surfaces, the structural 3D and the textural
2D, the inspection task considers different misclassifications
rates of 3D in 2D and vice versa.
Considering the first requirement, the most important
condition, as this is the case in most of the automatic in-
spection systems, is that 100% of the surface defects must be
detected. Defects considered within this work are surface ab-
normalities which can appear during the production. A false
positive, (false defect, i.e., a nondefective surface wrongly de-
tected as defect surface), may be tolerated within an accept-
able range, expressed in the percentage of the production
capacities. Typically, up to 10% of the nondefective surfaces
can be classified as defect surfaces. This value has been calcu-
lated according to the costs of the manual reinspection of all
false-classified objects.
For the second requirement, the inspection task im-
poses that structural defects must be detected and classified
Yannick Caulier et al. 3
Table 1: Influence of the surface type on the reflection angle α
and the reflection coefficient ρ. α
s,OK
and ρ
s,OK
are the reflection
angle and reflection coefficient for nondefective surfaces. (a) Non-
defective surface, ρ
s
= ρ
s,OK
and α
s
= α
s,OK
; (b) structural defect.
ρ
s
= ρ
s,OK
is the same as for nondefective surfaces but the surface
deformation induces a change of the reflection angle α
s
/
=α
s,OK
.(c)
Textural defect. α
s
= α
s,OK
is the same as for nondefective surfaces
but the surface is less reflective which influences the reflection coef-
ficient ρ
s
<ρ
s,OK
.
Surface types
Nondefective surface Structural defect Textural defect
(a) (b) (c)
α
s
= α
s,OK
ρ
s
= ρ
s,OK
α
s
= α
s,OK
ρ
s
= ρ
s,OK
α
s
= α
s,OK
ρ
s
<ρ
s,OK
correctly with a 100% accuracy, no misclassifications as tex-
tural defects are allowed. The reason is that, a distorted sur-
face geometry signifies a change in the functionality of the in-
spected object. For textural defects the situation is different,
because they are not a synonym of a functionality change of
the inspected object, but correspond to an unclean surface.
This is a cosmetic criterium and thus misclassifications as
structural defects are not so critical. False classification rates
of 2D in 3D defects up to 10% are allowed.
Those conditions define the inspection constraints of the
whole inspection system as well as of every element of the
processing chain.
The primary information source is the illumination. A
great attention should be given in its capability to reveal all
the necessary information from the recorded scene. Last ele-
ment of this chain is the classification result (Ω
κ
∈{Ω
A
, Ω
R,S
and Ω
R,T
}), where Ω
A
is the class of nondefective surfaces,
Ω
R,S
is the class of structural defects and Ω
R,T
the class of
textural defects. The image classification procedure is part of
the pattern recognition field. The readers can find more de-
tails on the description of this field in Niemann [14].
3. PROPOSED ILLUMINATION TECHNIQUE
This section describes the adapted structured illumination
technique which is based on the ray deflection on specular
surfaces. After a short description of the principle of ray de-
flection and starting from the exposed problem (see prece-
dent section), we describe step by step the major compo-
nents of the proposed illumination. We conclude this section
by giving some examples of recorded specular surfaces and
show that a good enhancement of the visibility of textural
and structural defects can be achieved.
3.1. Specular lighting principle
Object inspection using a specular lighting technique is ap-
plied for high reflective surfaces with a high value of re-
flectance coefficient ρ. ρ expresses the percentage of the re-
flected to the projected flux of light. This coefficient is null
for diffuse surfaces which reflect the light in any direction,
that is, as Lambertian sources. For a specular reflection the
angle α of the reflected component is equal to the angle of
the incident beam with respect to the surface normal. Com-
pared to defective regions, we consider slowly varying values
of α for all inspected surfaces without structural defects.
The disturbances of the projected light pattern are there-
fore directly linked with the illuminated object surface types.
We c all ( s) an elementary surface element of object surface
(S) to inspect. ρ
s
and α
s
are the reflectance coefficient and the
reflection angle of surface element (s). Ta ble 1 uses three ex-
amples illustrating ideal reflection conditions of a reflected
ray on a surface element (s).
3.2. Adapted specular lighting for the inspection task
As discussed in the introduction, the use of an adapted struc-
tured illumination within this work is motivated by the vi-
sual inspection process of the human inspector. He turns and
moves the high-reflective metallic surface of the object under
various and varying illuminations to detect all possible two-
and three-dimensional defects. Doing so, he or she is able to
recognize surface abnormalities by observing the reflection
of a structured illumination onto the surface to inspect.
To emulate this process for machine vision, a specially
designed technique for structured illumination has been de-
veloped and applied for cylindrical metallic objects. This
technique is used in an industrial process as described in
Section 2. The image generation process for the proposed
structured light depends on three components: the camera
sensor (C), the illumination (L), and the physical character-
istics (reflectivity and geometry) of the surface (S) to inspect.
In case of the inspection task of high-reflective metallic
cylindrical objects, the use of line-scan sensors was naturally
imposed as the surface of long, constant moving objects has
to be inspected. In fact, the scanning of the surface, contrary
to the pure perspective projection as for matrix-sensors, al-
lows to record the whole surface without a perspective dis-
tortion along the longitudinal axis of the objects. Hence, the
images recorded with one scanning sensor can directly be
stitched together. No preprocessing step for distortion re-
movalisnecessary.Eachobjectportionisprojectedontothe
recording sensor along the scanning plane Π
scan
. The relative
position of the recording sensor (C) and the moving direc-
tion
−→
V has a direct influence on the recording distortions.
These are negligible when the direction of the line-scan sen-
sor (C)andΠ
scan
are perpendicular to
−→
V and when the op-
tical axis of the sensor passes through the central axis of the
cylindrical object.
An important constraint comes from the high reflectiv-
ity of the surfaces to inspect. In fact, the sensor (C)and
the light source (L) must be positioned, so that at least one
emitted light ray, projected onto a nondefective surface (S),
is reflected onto a sensor element. To describe this scene it
is convenient to use several coordinate systems. Points on
the surface (S) are described in the world coordinate system
(x
w
, y
w
, z
w
) whereas points on the acquired images are given
4 EURASIP Journal on Image and Video Processing
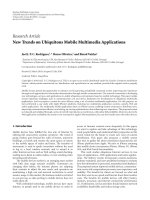
in image coordinate system (u, v). The positions of the ma-
jor setup components (C), (L), and (S) are schematically de-
picted in Figure 1.
The object to be inspected is moving along the x
w
axis,
the sensor (C) is placed so that the line-scan sensor (C)is
parallel to the axis y
w
and the optical axis pO passes through
the central axis of the object. α
scan
is the angle between planes
Π
scan
and Π
x
w
,y
w
.Wechooseanα
scan
near π/2toreduceatas
far as possible the recording distortions.
Let us now define more precisely the light source (L)
which reveals both three- and two-dimensional surface de-
fects. The imperatives are here a fast moving of the surface (S)
to inspect and a fast detection and discrimination of the two-
and three-dimensional defects on it. We define LP
projected
as
the projected light pattern onto the surface (S)andLP
reflected
as the reflected pattern by (S). LP
reflected
which is disturbed
by the object geometry and the two- and three-dimensional
defects is then projected onto the sensor (C).
Measurement methods of high-reflective surfaces use the
deformations of a projected fringe pattern, to retrieve the
shape of the surface or detect the defective surface parts.
As specular surfaces reflect the incoming light only in one
direction, the size and the geometry of the illumination de-
pend on the shape of the inspected surfaces. In case of free-
form specular surfaces with low varying surface vectors, a
planar illumination with a reasonable size can be used to in-
spect the whole object. Knauer et al. [13]usesuchasystem
with a flat illumination for the inspection of optical lenses.
When the variations of the surface to be inspected are more
pronounced, an adapted geometry of the illumination facil-
itates the recording of the complete surface. Hence, in case
of free-form shapes as car doors [15, 16] or the coverage of
headlights [17], a parabolic illumination allows to restrain
the dimensions of the lighting screen to reasonable values.
Different methods using adapted patterns and illumination
source shapes are described by P
´
erard [18].
The structure of the observed fringe patterns in the im-
ages is nonregular and depends on the shape of the illumi-
nated surface. Hence, a preliminary calibration step retriev-
ing the geometry of the recording setup is necessary. Ref-
erences [15, 16] compute the mapping between the cam-
era points and the corresponding point on the illumination
screen. Knauer et al. [13] use a precalibration procedure to
retrieve the position of the camera and the geometry of the
structured lighting in the world coordinate system.
Our approach is different. The common part with the ex-
isting techniques is that we also adapted the geometry of the
lighting to the cylindrical shape of the object under inspec-
tion. But, the primary reason was to influence the aspect of
the reflected light pattern LP
reflected
in the camera image. Due
to the constant shape of the inspected surfaces, if the geom-
etry of the reflected light pattern is known, the deformations
of the fringe pattern induced by a defective object part are
sufficient information to automatically detect this surface ab-
normality. Hence, contrariwise to the above-cited methods, a
precalibration step of the recording camera or the structured
illumination is not necessary.
Therefore, the structure of the observed pattern is an im-
portant aspect concerning the image processing algorithms.
p
P
N(u, v)
u
v
Π
image
Π
scan
(C)
(L)
O
(s)
(S)
α
scan
M(x, y, z)
r
1
−→
V
Wor ld
x
w
y
w
z
w
Figure 1: Position of the camera line-scan sensor (C), the illumina-
tion (L), and the high-reflective cylindrical surface (S). The object
is moving with a constant speed V along the x
w
axis, the scanning
plane Π
scan
has an angle α
scan
with the Π
x
w
,y
w
plane. The elementary
surface element (s) is characterized by a point M of world coordi-
nate (x, y, z). M is illuminated by a light ray r
1
which is reflected
on (s) and projected onto the camera sensor (C) so that the cor-
responding image point N of image coordinates (u, v) is obtained.
The sensor (C) is characterized by the optical center of projection
O and the optical axis p.Vectorp passes through the point O and is
directed to the point P at the central position of the sensor.
In fact, their complexity and so their processing time may
increase with the complexity of the projected light pattern in
the recording sensor. Thus, it is preferable to observe a reg-
ular pattern in the camera image and so to simplify the im-
age processing procedure. In our case, this reflected observed
pattern in the images consists of a vertical, that is, parallel to
the image axis v, periodical structure.
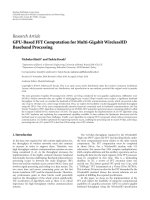
Figure 2 shows the arrangement of the N
r
projected light
rays forming the illumination (L) (which is adapted to the
geometry of (S)) and the recording line-scan camera (C). The
figure depicts (a) the front view and (b) the side view of the
recording setup which consists in the scanning camera (C),
the surface to inspect (S), and the illumination (L).
The depicted recording setup shows that with one line-
scan sensor (C) and an adapted illumination (L)alargepart
of the surface (S
inspect
) of the whole surface (S) can be in-
spected, (S
inspect
) ∈ (S). The cylindrical metallic object is
moving with a constant speed
−→
V perpendicular to the line-
scan sensor (C). The camera focuses near to the object sur-
face. The depth of field is chosen to be sufficient to cover the
whole curved surface (S
inspect
). The number N
r
of necessary
light rays depends on the lateral size (along the y
w
axis)ofthe
inspected surface S
inspect
and the minimal size of the defects
to be detected.
Figure 2(a) shows that the arrangement of the projected
light pattern LP
projected
is calculated according to the cylindri-
cal geometry of the object surface, so that the reflected light
pattern LP
reflected
on the surface S
inspect
is projected onto the
sensor (C) as a vertical and periodical pattern in the scanning
plane Π
scan
of the camera.
Yannick Caulier et al. 5
LP
reflected
=
(r
1
, , r
N
r
)
(C)
(S)
(S
inspect
)
x
w
y
w
z
w
(a)
(C)
(L)
(S)
(S
inspect
)
(r
central
)
(r
1
)
α
scan
−→
V
x
w
y
w
z
w
(b)
Figure 2: Principle of adapted structured illumination for the in-
spection of high-reflective surfaces of cylindrical objects, (a) front
view and (b) side view. The cylindrical object is scanned during its
movement with constant speed V by a line-scan sensor (C). (S
inspect
)
is the part of the surface of (S) that is inspected with one camera and
one illumination. N
r
light rays (r
1
, , r
N
r
) are necessary to cover the
whole surface (S
inspect
).
Figure 2(b) depicts the reflection of two rays reflected by
the object surface (S
inspect
) and projected onto the camera
sensor (C): the central light ray r
central
and one extreme ray
r
1
. We clearly see that the N
r
projected rays onto (S
inspect
)
are not coplanar because we have chosen a scanning angle
α
scan
<π/2.
After describing how the N
r
rays forming the illumina-
tion are to be projected onto the surface, we detail more pre-
cisely the different parts forming this adapted structured il-
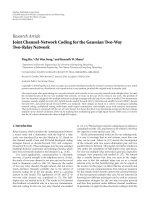
lumination (L). Figure 3 shows the Lambertian light (D), the
light aperture (A
L
), and the ray aperture (A
R
).
The adapted illumination for the structured light itself is
composed of three parts: a Lambertian light source (D), a
light aperture (A
L
), and a ray (A
R
)aperture.
Aim of the Lambertian light (D) surrounding the surface
to inspect (S) is to create a smooth diffuse illumination to re-
duce disturbing glares on the metallic surface due to its high
reflectivity.
A part of the light rays emitted by (D) is passing the N
r
slits of the ray aperture (A
R
). We assume that all the slits
have the same length L
s
and the same width w
s
.Acertain
length L
s
is necessary as we know that the emitted rays which
are then projected into the sensor (C) are not coplanar; see
Figure 2(b). This length depends on the scanning angle α
scan
and the diameter of the cylindrical object to inspect D
O
.The
width w
s
depends on the necessary lateral resolution along
the y
w
axis which is given by the projected pattern LP
reflected
into the camera sensor (C). As this pattern has a sinusoidal
structure of period d
P,mm
, the width w
s
= d
P,mm
/2.
The light aperture (A
L
) is placed behind (D)toretainall
light, except the light rays needed to form the fringe pattern.
The depicted illumination in Figure 3 is one possible
method to project a periodical stripe pattern onto the sen-
sor. Similar images could have been obtained with a screen
projecting a sinusoidal pattern. In that case, an intermedi-
ate reflecting element would have been necessary to adapt
the planar light structure to the geometry of the cylindrical
surfaces. The proposed solution has the advantage to be easy
to manufacture, to be cheap, and to have reasonable dimen-
sions.
As the whole surface (S) cannot be recorded with one
camera, (S
inspect
) <S, several cameras and corresponding
adapted structural illuminations must be used for covering
the complete circumference of a metallic cylinder. The num-
ber N
C
of needed cameras depends not only on the diameter
of the object D
O
, the width of the ray aperture’s slits w
S
but
also on the distance between the surface to inspect and the
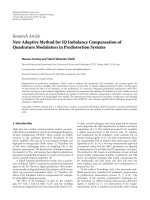
recording sensor. Figure 4 illustrates this statement by show-
ing the reflection of the extreme light ray r
1
and the cental
light ray r
central
onto the sensor (C).
This example shows that the lateral size of the inspected
surface using the adapted structure illumination depends
on the following parameters: D
O
, w
S
, and distance between
(S
inspect
)and(C). From the lateral size of the surface (S
inspect
),
the number N
C
of needed cameras to record the whole sur-
face (S) can be deduced.
3.3. Image examples of recorded nondefective
surfaces
The recording setup is operable if the image of the projected
light pattern LP
reflected
is characterized by a succession of ver-
tical parallel and periodical bright and dark vertical regions.
This vertical pattern has to have a constant period d
P,px
(in
pixel) in the u direction of the image. The ratio of d
P,px
with
the period d
P,mm
(in millimeter) of the pattern LP
reflected
gives
the image resolution in u direction of the image coordinate
system.
An image example of a cylindrical tube surface section
illuminated with the proposed structured lighting is shown
in Figure 5.
Here, N
r
= 21 rays are necessary to illuminate the com-
plete cross section of the surface (S
inspect
). In this image, one
single horizontal image line corresponds directly to the scan
line of the line-scan sensor at a certain point of time t.Thus,
the depicted image is obtained by concatenating a certain
number of single line scans, where the vertical resolution v
corresponds directly to the number of line scans over a cer-
tain period of time. All the N
r
bright stripes in the image f
arevertical(alongthev axis) and parallel to the moving di-
rection of the cylindrical object; see Figure 2.
The recording conditions are optimal for the further pro-
cessing and classification. By optimum, we mean that the
observed stripe pattern in the image must be depicted ver-
tically,withaconstant period and that all bright lines in the
image are depicted with the same pixel values. The image pro-
cessing algorithms should not be perturbed by any record-
ing noise present in the image. We distinguish two recording
6 EURASIP Journal on Image and Video Processing
(C)
(L)
(D)
(D)
(S
inspect
)
(A
L
)
(A
R
)
(A
R
)
w
s
N
r
slits
L
s
(a)
(b)
(c)
Figure 3: Detailed principle of the adapted structured illumination
for the inspection of high-reflective surfaces of cylindrical objects.
The adapted structured illumination is composed of a ray aperture
(A
R
), a Lambertian diffuse light (D), and a light aperture (A
L
). (a)
Side view of the whole illumination, (b) front and side views of the
ray aperture (A
R
), and (c) front and side views of the Lambertian
diffuse light (D).
(C)
D
O
(r
central
)
(S
inspect
)
(r
1
)
w
s
Figure 4: Projection of the extreme light ray r
1
and the cental light
ray r
central
onto the sensor (C) using the adapted structured illumi-
nation. As each slit of the ray aperture A
R
has the same width w
s
,the
reflected rays on the surface are more or less spread, depending on
the diameter of the object D
O
and the distance between the surface
to inspect and the recording sensor. Here is the example of the pro-
jected extreme light ray r
1
and cental light ray r
central
onto the sensor
(C).
noise categories. The first is the unavoidable but uncritical
camera noise due the electronic devices of the camera. The
second is due to the geometry of the object and the illumi-
nation as stated according to Figure 4. The second kind of
recording noise can clearly be seen with a close look at the
stripe image of Figure 5 where we observed a decrease of the
contrast for the left and right vertical stripes.
To summarize, for every illuminated elementary surface
(s) of the nondefective surface (S
inspect
), we have ideal re-
flection coefficients ρ
s
= ρ
s,OK
and ideal reflection angles
α
s
= α
s,OK
; see the left image of Tab le 1 . We fix the ideal re-
flection coefficient to be maximal, that is, ρ
s,OK
= 100%. This
u
v
N
r
= 21
(S
inspect
)
D
O
= 9.5mm
d
P,px
Figure 5: Typical image of a specular nondefective cylindrical sur-
face of diameter D
O
= 9.5 mm obtained with the adapted structured
illumination. d
P,px
is the period in pixel of the depicted stripe pat-
tern in the image.
corresponds to the maximal value in the images, the inten-
sity value of the vertical bright stripes therefore always equals
255, which is the maximal possible value as the depth of all
the considered images is of 8 bits.
As defined in Figure 5, for the recording of the surface we
need at least N
c
= 6 adapted illuminations and cameras to
record and inspect the complete surface (S) of the cylindrical
object.
3.4. Revealing textural and structural defects
The goal of the described recording setup is to emulate the
inspection process of a human visual inspector, to accentuate
both two- and three-dimensional defects on the object sur-
face at the same time. We saw in Figure 5 how nondefective
surfaces are depicted, let us now have a look on depicted tex-
tural and structural defects on cylindrical metallic surfaces
recorded under the proposed illumination; see Figure 6.
Considering these height image examples, we observed
that different types of defects (textural and structural) in-
duce a different kind of stripe disturbances. For textural de-
fects, mainly the intensity of the adapted stripe illumination
decreases. This can even lead to the effect that neighboring
dark and light regions are melted; see Figures 6(a1)–6(c1).
However, for structural defects, the parallel structure of the
stripes is deformed or vanished; see Figure 6(d2).
In our four textural defects examples, we see that the cor-
responding image disturbances are due to a decrease of the
reflected intensity. This means that the reflection coefficients
of all the elementary surfaces (S) characterizing those two-
dimensional defects are lower than the reflection coefficients
of nondefective surfaces ρ
s
<ρ
s,OK
. This is therefore a suffi-
cient condition to reveal this kind of defects in the images.
Concerning the four structural defects examples, the sit-
uation is slightly different. We observe naturally a deforma-
tion of the projected vertical stripes in the image which is
due to a change in the reflection angle, α
s
/
=α
s,OK
.However,
we also observed a decrease in the intensity of the projected
stripes. First, when the texture of the surface is damaged,
we have the same conditions as for textural defects, that is,
ρ
s
<ρ
s,OK
; see the inner part of the “3D wear” and “3D
abrasion” defects. Then, a shape deformation of the surface
can also lead to a decrease of bright stripes intensity, see the
Yannick Caulier et al. 7
(a1) (b1) (c1) (d1)
“2D grease” “2D scratch” “2D rough” “2D mark”
(a2) (b2) (c2) (d2)
“3D hit”
∼20 μ depth
“3D wear”
∼20 μ depth
“3D cavity”
∼20 μ depth
“3D abrasion”
∼10 μ depth
Figure 6: Image examples of different surface defects recorded with
the adapted structured illumination. (a1) the “2D grease” figure
shows a grease mark on the surface; (b1) the “2D scratch” depicts
a lightly scratched surface; (c1) “2D rough” is due to an abrasion
of object surface during surface finishing process; (d1) a typical
marking on the surface is depicted in image “2D mark.” Four image
examples of different depth defects. (a2) “3D hit” reveals a strong
damaged surface, (b2) “3D wear” is due to the mold of an external
particle on object surface, (c2) “3D cavity” is due to the pressing of
an external object on the surface, and (d2) “3D abrasion” shows a
strongly locally polished surface.
(a1) (b1) (c1) (d1)
“2D grease” “2D scratch” “2D rough” “2D mark”
(a2) (b2) (c2) (d2)
“3D hit”
∼20 μ depth
“3D wear”
∼20 μ depth
“3D cavity”
∼20 μ depth
“3D abrasion”
∼10 μ depth
Figure 7: Image examples of different surface defects recorded with
adiffuse illumination. Same textural “2D grease,” “2D scratch,” “2D
rough,” “2D rough” and structural “3D hit,” “3D wear,” “3D cavity”
“3D abrasion” images as shown in Figure 6.
disturbed stripes at the borders of the “3D hit” and “3D abra-
sion” defects. We observe that those bright stripes follow the
contours of the defects where the angle of the surface nor-
mal changes in the lateral y
w
direction (see Figure 2(a)). If
the angle of the surface normal changes in the longitudinal
(x
w
; z
w
) direction (see Figure 2(b))lesslightfluxisprojected
onto (C) so that the intensity of the bright stripes in the im-
age decreases.
Hence, a variation of the surface normal without a
change of the reflection coefficient, which is characteristic
to a structural defect, can lead to similar disturbances in the
stripe image than a textural defect would induce. See, for ex-
ample, the inner parts of the “3D abrasion” image and the
“2D rough” image of Figures 6(d2), 6(c1). The direct con-
sequence is that, if all the variations of the surface normal
of a structural defect only occur in the plane (x
w
; z
w
), then
this defective structural surface would not be distinguishable
from a textural defective part.
This particular case of structural defect structure has a
very low probability to occur as in case of the inspection task,
all structural defects to detect have an irregular and random
structure. This illumination technique is therefore totally ad-
equate for the visual enhancement and discrimination of tex-
tural and structural defective parts of cylindrical surfaces as
it will be demonstrated in the next sections.
4. COMPARISON OF THE PROPOSED METHOD WITH
TWO DIFFERENT ILLUMINATION PRINCIPLES
The described recording setup is one possible illumination
technique among several others, used in industrial image
processing and machine vision systems.
To demonstrate that the proposed adapted stripe illumi-
nation integrates two different illumination techniques (dif-
fuse and directed) for the detection of textural and struc-
tural defects, we performed further recordings of the high-
reflective surfaces described in Section 3. We use a diffuse and
a retroreflector illumination technique. We show that the for-
mer does not increase the visibility of all the structural de-
fects whereas the latter is too sensible to the nondefective sur-
face structures.
4.1. Use of a diffuse illumination technique
First recordings with the involved high-reflective surfaces
were made using a smooth diffuse illumination. The purpose
was to increase the visibility of textural changes of the surface
and to evaluate the enhancement possibilities for structural
defects.
A concrete idea of the surface texture enhancement pos-
sibilities using a diffuse technique is given in Figure 7 where
the same eight metallic surfaces as showed in Figure 6 with
the adapted structured illumination are depicted. Figures
7(a1)–7(d1) depict textural defects whereas Figures 7(a2)–
7(d2) depict structural defects.
Obviously, the surfaces exhibiting textural defects dem-
onstrate that a smooth illumination is fully appropriate for
revealing defective object textures whose reflectivity is less
than nondefective surfaces textures. Interestingly, the figures
depicting textural defects show that also depth structures
can be revealed with this kind of illumination technique.
The necessary condition is that the surface reflectivity of
the defect differs from the reflectivity of good surface. But
the major drawback of this illumination is that some struc-
tural defects, in particular those with a small depth (see
Figure 7(d2)), are quasi-invisible in the images.
8 EURASIP Journal on Image and Video Processing
(a1) (b1) (c1) (d1)
“2D grease” “2D scratch” “2D rough” “2D mark”
(a2) (b2) (c2) (d2)
“3D hit”
∼20 μ depth
“3D wear”
∼20 μ depth
“3D cavity”
∼20 μ depth
“3D abrasion”
∼10 μ depth
Figure 8: Image examples of different surface defects recorded
with a retroreflector. Same textural “2D grease,” “2D scratch,” “2D
rough,” “2D rough” and structural “3D hit,” “3D wear,” “3D cavity”
“3D abrasion” images as shown in Figure 7.
The eight images examples (Figure 7) illustrate the im-
portance of a smooth illumination when textural defects have
to be detected on high-reflective surfaces, and also demon-
strate the limits of a diffuse illumination when depth struc-
tures have to be revealed. In fact, when the texture of the
defect has a similar reflectivity as a nondefective surface, as
in Figures 7(c2) or 7(d2) the defect is quasi-revealed not re-
vealed in the images.
Therefore, this illumination approach is not suitable to
the inspection task as defined in Section 2.
4.2. Use of a retroreflector illumination
One of the first applications of the retroreflector technique
for the quality inspection of specular surfaces was proposed
by Marguerre [11]. He showed that this technique is partic-
ulary adapted for the enhancement of small surface defor-
mations and presents his method as a good possibility to
enhance three-dimensional surface structures or surface re-
gionswithdifferent specular properties.
We tested this approach to evaluate how far this method
is suited for the inspection of our high-reflective surfaces. We
record the same textural and structural defects as depicted in
Figures 6 and 7. The results are shown in Figure 8.
At first sight, the two major defect types which are the
textural and the structural are well enhanced. The images of
the former are similar to the results obtained with the diffuse
technique whereas the latter are also well enhanced, which
was not the case using the “smooth” illumination. So, this
approach seems to give satisfying results concerning the in-
crease of nondefective surfaces as for the proposed structured
lighting technique; see Figure 6.
In fact, the obtained images using this technique are sim-
ilar to the conclusions of Marguerre [11]. He says that plac-
ing a retroreflector in the optical setup is equivalent to high-
(a1) (b1) (a2) (b2)
Figure 9: Image examples of two different nondefective surfaces.
(a1) and (b1) depict the same nondefective surface recorded with
a structured and a retroreflector lighting, (a2) and (b2) depict an-
other nondefective surface recorded with a structured and a retrore-
flector lightings.
(a) (b1) (b2)
Figure 10: Image examples with typical recording artefacts due to
bad-positioned objects. (a) ideal depiction of a nondefective sur-
face, the stripe pattern in the image is not disturbed; (b1) change
of object position in the y-direction during surface recording, (b2)
bad-positioned object corresponding to a rotation around the y-
axis.
pass filtering the resulting images without retroreflector. To
be sure if this method is suitable for our inspection purpose,
we made further tests by recording nondefective surfaces; see
Figure 9.
We highlighted that the retroreflector technique is a
highly sensitive method. Even in the case of nondefective sur-
faces, high grey level variations can be observed in the im-
ages. Contrariwise, the images of the same surfaces obtained
using the proposed illumination do not show these pertur-
bations.
The textural defects seem to be well visually enhanced
with the retro technique, a discrimination with textural de-
fect is not possible. Figures 8(b2) and 8(c2) clearly demon-
strate that textural defects can be depicted with similar grey
values than textural surfaces.
5. DIRECT APPLICATION IN AN INDUSTRIAL
ENVIRONMENT
We proposed a new lighting technique for specular surfaces
inspection by visually enhancing the textural and structural
defects without revealing nondefective surfaces in the same
time. We compared our results with a diffuse and a retrore-
flector lighting technique and showed that for both tech-
niques the results are not as good as for the proposed adapted
stripe illumination.
Now we aim at demonstrating that such a lighting system
can be used in an industrial environment where the system’s
Yannick Caulier et al. 9
i = 15
j = 30
x
y
f
j
(x)
x
146
201
255 255 255
210
152
i −3 i − 2 i −1 ii+1 i +2 i +3
f
ij,max
= 255
x
y
j
−3
j
−2
j
−1
j
j +1
j +2
j +3
35.9
35.7
36.3
36.1
35.8
35.9
36.1
···
···
0.1
0.2
0.2
···
···
x
∗
ij,max
s
∗
ij,max
θ(s) = 5
s
∗
ij,max
= 0.2
= |35.7–35.9|
Figure 11: Determination of the shape s
∗
ij,max
and the intensity
f
ij,max
values at maximum position x
∗
ij,max
for a stripe image. The
determination of those three parameters is done for maxima at po-
sitions i
= 5and j = 30. The shape s
∗
ij,max
= 0.02 and the intensity
f
ij,max
values correspond to optimal recording conditions, that is,
when nearly no bright stripe disturbance occurs.
constraint is not only to achieve a high inspection’s quality
but also to reach a high productivity. It is therefore quasi-not
possible under those conditions to obtain a constant image
quality of the recorded surfaces. We show two typical exam-
ples of artefacts arising when the recording conditions are
not optimal.
We briefly introduce the involved algorithm for the auto-
matic segmentation and classification of structural and tex-
tural surface defects illuminated with this specular lighting.
We show that the proposed method is robust against record-
ing artefacts and that a good discrimination between non-
defective surfaces, textural defects, and structural defects is
possible.
5.1. The problem of specular lighting’s artefacts
The images shown in Section 3 clearly demonstrated the
strength of the proposed illumination for surface character-
ization. Up to here, we only consider the stripe disturbances
caused by critical surfaces, we did take into account possi-
ble image artefacts arising when specular surfaces are illumi-
nated with directional light.
When the recording conditions of object surface are opti-
mal, the quality of the stripe pattern is similar to the depicted
surface in Figure 10(a). If not, that is, when recording arte-
facts occur, the bright lines are disturbed, as it can be seen in
Figures 10(b1)-10(b2).
Each of those two artefacts identify one consequence
of nonoptimal positioned object surface. Stripe pattern of
Figure 10(b1) shows similar properties to the disturbances
caused by structural defects, when α
s
/
=α
s,OK
, whereas the
disturbances induced by textural defects, when ρ
s
/
=ρ
s,OK
,are
close to those observed in Figure 10(b2).
Causes for such types of disturbances are usually in-
evitable uncorrect or imperfect recording conditions. Typi-
cal disturbances are short lateral deviations in y-direction of
the inspection object with respect to a fixed geometry be-
tween object, sensor, and illumination, leading to a short-
term horizontal distortion in the depicted stripe pattern. See
Figure 10(b1) where the complete bundle of reflected rays
(R) is displaced in the image. Also, a bad-positioned or de-
justified object with respect to the image sensor can yield to
inhomogeneous illuminated surfaces and thus wrong condi-
tioned images. In Figure 10(b2), the plane defined by the re-
flected ray bundle (R) does not correspond to the projection
plane of the recording sensor.
5.2. Quantifying image quality
The ideal recording conditions as defined in Section 3.3 can-
not be fulfilled at 100% in an industrial context. The record-
ing artefacts characterized by a shape distortion and/or an
intensity decreasing of bright lines are quasi-unavoidable. To
evaluate the influence of such artefacts on the discrimina-
tion process of nondefective and defective surfaces, we must
quantify the quality of the depicted stripe pattern in an im-
age. Two criteria are here important: the shape and the inten-
sity of the bright lines.
The question is “how far can recording artefacts disturb
the projected stripe pattern, so that the surface inspection
processisstillacceptable?”.
To answer this question, we must quantify the shapes
and the intensities of the depicted bright lines in an image
f. Those values, both calculated from the picture elements of
the images, will help us to evaluate the degree of bright lines
disturbance.
Each image f of size N
x
× N
y
is characterized by N
l
ver-
tical bright lines depicted with a period d(P). The function
f (x, y) is the two-dimensional discrete representation of f
and is represented in a cartesian coordinate system whose x-
axis is horizontal with ascendant value from left to right and
y-axis is vertical with ascendant values from top to bottom.
Upper-left image point at pixel position (0, 0) of f (x, y)cor-
responds to the origin of the coordinate system.
At first, we estimate the N
y
×N
l
positions of all N
l
bright
lines. We call those positions the maxima x
∗
ij,max
of the im-
age f, i
= 1, , N
l
defines the bright line number and
j
= 1, , N
y
the position along image’s y-axis. All maxima
x
∗
ij,max
are estimated with a high accuracy in x-direction.
One major problem concerning the detection of the max-
ima is that most of the brightest points are mapped to a value
of 255. This clipping is unavoidable, as high-reflective sur-
faces are involved. Hence, for the detection of the maxima at
subpixel level x
∗
ij,max
, we implemented and compared two dif-
ferent methods: the center-of-mass and the Blais-and-Rioux
operators. The first uses the distribution of the grey level to
retrieve the positions of the maxima, whereas the second ap-
plies a local linear interpolation at the zero-crossing of the
first derivative. Both methods are detailed described in Fisher
and Naidu [19].
We have conducted several tests using synthetic image
with a simulated additive noise and different maxima cor-
responding to grey values comprised between 220 and 255.
Further tests involving real images have also been made.
10 EURASIP Journal on Image and Video Processing
Concerning the synthetic images, the evaluation criterion
was the detection error between the estimated and the known
maxima positions. For the real images, we used the classifica-
tion rates as evaluation criterion. Both series of tests showed
that the grey level distribution center-of-mass method out-
performs the zero-crossing Blais-and-Rioux approach.
Once the maxima x
∗
ij,max
are computed, we calculate the
corresponding shape s
∗
ij,max
∈ R and intensity values f
ij,max
∈
Z
. Figure 11 shows the computing principle for image func-
tion f (x, y)
∈ Z
64×64
of shape s
∗
ij,max
and intensity f
ij,max
values of maxima x
∗
ij,max
for i = 5andj = 30 ( f
y
(x) is the
one-dimensional discrete representation of a horizontal im-
age line of length N
x
).
The computation of the N
y
× N
l
shape values s
∗
ij,max
for
each x
∗
ij,max
can be stated as follows:
s
∗
ij,max
=
⎧
⎪
⎪
⎪
⎪
⎪
⎪
⎪
⎪
⎪
⎪
⎨
⎪
⎪
⎪
⎪
⎪
⎪
⎪
⎪
⎪
⎪
⎩
a
1
−a
2
if
a
1
−a
2
<θ(),
a
1
−a
2
=
2θ(s)+1,
a
1
= x
∗
i(j+θ(s)),max
,
a
2
= x
∗
i(j−θ(s)),max
,
0 otherwise,
(1)
θ(s)andθ(
) are threshold values depending on bright
stripe’s shape and period d(P). The shape value s
∗
ij,max
is
computed using two subpixel positions x
∗
i(j−θ(s))max
and
x
∗
i(j+θ(s)),max
of a bright stripe so that |x
∗
i(j+θ(s))max
−
x
∗
i(j−θ(s)),max
| <θ() <d(P). Shape value is minimal when no
bright stripe disturbances occur, s
∗
ij,max
= 0.2 for the example
given in Figure 11.
Bright line’s intensities f
ij,max
at maxima x
∗
ij,max
are the
corresponding value of image function f (x, y). Figure 11
represents the ideal case when f
ij,max
= 255.
The bright stripe disturbances of a complete image or an
image region are characterized with
S and
I, the mean values
of maxima’s shape s
∗
ij,max
and intensity f
∗
ij,max
of this image or
this image region. Both expressions are written as follows:
S =
1
N
l
×N
y
N
l
s=1
N
y
j=1
s
∗
ij,max
,
I =
1
N
l
×N
y
N
l
i=1
N
y
j=1
i
∗
ij,max
.
(2)
The average shape
S and average intensity
I values of
bright lines give us an estimation of their disturbance degree.
As an example, Ta bl e 2 lists the values of
S and
I of the three
stripe image examples depicted in Figures 10(a), 10(b1), and
10(b2).
5.3. Influence of artefacts on classification
performances
We know that recording artefacts are quasi-unavoidable for
the target industrial context. Therefore, the classification
Table 2: Values of average shape
S and intensity
I for the three im-
ages depicted in Figures 10(a), 10(b1), and 10(b2).
Figure 10(a) Figure 10(b1) Figure 10(b2)
S 0.14 1.18 0.16
I 254 252 200
Ω
A
“OK good”
(a)
Ω
A,R
“OK guide”
(b)
Ω
R,S
“3D smooth”
(c)
Ω
R,T
“2D wear”
(d)
Figure 12: Four stripe images of dimension 64 × 64 pixels. Those
images are part of set w
te
and were recorded by the visual inspec-
tion system. The two first images depict nondefective surfaces: (a)
image with good quality without any artefact, (b) disturbed stripes
corresponding to mechanical, that is, recording artefacts. The two
last images depict (c) a superficial structural defect
∼10 μm and (d)
a textural defect corresponding to a “wear” of the surface.
method used for discriminating defective from nondefec-
tive surfaces must not be perturbed by nonoptimal record-
ing conditions. How far artefacts can influence the inspection
performances and how far they may represent an additional
difficulty for the discrimination task will be discussed in this
section.
We consider a test image sample w
te
made of 188 im-
ages depicting typical surfaces recorded by the industrial sys-
tem. All reference images have been used for the qualifica-
tion of the system and were classified by a visual inspector in
four main image sets. We have 40 nondefective surfaces with-
out artefacts w
A
and 62 nondefective surfaces with recording
artefacts w
A,RA
, 51 nonefective surfaces with structural de-
fects w
R,S
, and 35 nondefective surfaces with textural defects
w
R,T
.
Figure 12 gives an example of some typical object sur-
faces. All images correspond to an object surface of 2 mm
width and 6 mm height and are part of the test set w
te
.Reso-
lution in x direction is three times greater than the resolution
in y direction, so that all images have square dimensions of
64
×64 pixels.
The depicted stripe images give an example of typical
object surfaces to inspect. For each of the four considered
defect sets
{w
A
, w
A,R
, w
R,S
, w
R,T
}, one example is shown. Fig-
ures 12(a) and 12(b) show nondefective surfaces. In the for-
mer, no disturbances occur and in the latter typical guid-
ing disturbances are depicted. A structural defect is shown in
Figure 12(c), the depth is about 10 μm and is due to a crush-
ing of the object. Size of “3D deep” defect is relatively big with
∼7 disturbed periods in x direction. Figure 12(d) depicts one
textural defect due to the grating of the tube surface with an
object.
We compute the average shape
S and intensity
I values
as defined by (2)forallimagesofsubsetsw
A
and for the
Yannick Caulier et al. 11
253233213193173153
Average intensity value
I
0
2
4
6
8
10
12
Number of images of set w
te
Distribution of average intensity value
I
w
A
w
A,R
w
R,S
w
R,T
(a)
1.510.50
Average shape value
S
0
2
4
6
8
10
12
14
16
18
20
Number of images of set w
te
Distribution of average shape value
S
w
A
w
A,R
w
R,S
w
R,T
(b)
Figure 13: Distribution of average shape
S and intensity
I values for all images of subsets w
A
and for the disturbed image regions of subsets
w
A,R
, w
R,S
,andw
R,T
,wherew
te
={w
A
, w
R,S
, w
R,S
}.
if (d
2
(
ρ
c; c) ≤ d
2
(
j
c; c)),
(
j
c ∈ Ω
κ
),
then (c
∈ Ω
κ
),
ρ
c ∈ R
N
tr
,
j
c ∈
R
N
tr
, c ∈ R
N
te
,
∀κ ∈{1, ,3},
∀ρ ∈{1, , j −1, j +1, , N
tr
},
∀j ∈{1, , N
tr
}.
Algorithm 1: i
disturbed image regions of subsets w
A,R
, w
R,S
,andw
R,T
.The
values of
S and
I are reported in Figure 13.
Those two Graphes clearly illustrates two items. First, the
average values
S and
I of defect surfaces, sets w
R,S
and w
R,T
,
and nondefective surface without artefacts, set w
A
,arenearly
disjoint. Second, the distribution of shape and intensity val-
ues
S and
I for the nondefective surface with recording arte-
facts set w
A,R
covers the whole range of values, a clear thresh-
old separating nondefective from defective surfaces here is
not obvious. The fact is that recording artefacts dramatically
complicate the classification task consisting in discriminating
nondefective and defective surfaces. Bright lines shape and
intensity seem to represent good but not sufficient character-
istics to solve this discrimination task.
We illustrate the classification difficulty by introducing a
shape γ
S
= 0, 18 and an intensity γ
I
= 246 threshold. We
consider an image as depicting a nondefective surface if its
average shape value
S is bellow γ
S
or if its average intensity
value
I is above γ
I
. In this case, we classify all 20 images of
set w
te,A
as non-defective surfaces and only 1 image of set
w
te,R,S
as a nondefective surface also. But in the same time
we would falsely classify nearly all images of set w
te,A,RA
as
defective surfaces. In the same way, we classify most of the
images of set w
te,A
as nondefective. The major problem in
this case is that images of set w
w,RA
have similar values of
I as
images of sets w
w,3D
and w
w,2D
.
This concrete example demonstrates that other charac-
teristic stripe features have to be defined, which brings us to
the proposed classification algorithm.
6. THE PROPOSED PATTERN RECOGNITION
ALGORITHM
If the proposed specular lighting technique shows good re-
sults in visually enhancing critical surfaces, its application
in an industrial environment induced nonoptimal recording
conditions. This leads to image disturbances similar to those
induce by surface defects so that the discrimination task be-
comes more difficult.
To overcome this problem, an adaptive algorithm was de-
veloped for the automatic inspection of structured illumi-
nated surfaces. This method shows its robustness as it is part
of a widely used real-time industrial application.
The core component of the algorithm is the selection and
the extraction of the features best describing the image con-
tents. The first step of the algorithm consists in building the
feature vector c
∈ R
N
c
for all stripe image pattern f. This
process filters the most irrelevant information, transforming
an image of size N
x
·N
y
into its signature c of dimension N
c
,
where N
c
N
x
· N
y
. The feature vector building process is
made of different steps, each one corresponding to a dimen-
sionality reduction.
First, maxima and minima datasets containing the posi-
tion of bright and dark image lines are built from the im-
age pattern f. For all image maxima and minima the shape,
see (1), the distancem, and the intensity values of bright and
dark lines are computed.
12 EURASIP Journal on Image and Video Processing
Then, only image regions corresponding to characteristic
shape, distance, and intensity values of bright and dark lines
are retained in sets M
R,max
and M
R,min
.
Finally, further image regions englobs the regions defined
by M
R,max
and M
R,min
are built. Those segmented image re-
gions define the relevant information and so the feature vec-
tor c.
For the classification procedure, we consider three
classes: the class of nondefective surfaces Ω
A
grouping the
nondefective surfaces recorded with and without artefacts,
the class of structural defects Ω
R,T
, and the class of textu-
ral defects Ω
R,T
. The task then consists in assigning a class
Ω
={Ω
A
, Ω
R,T
, Ω
R,S
} to each pattern f according to feature
vector c. In addition to the test set w
te
defined earlier, we con-
sider a training set w
tr
made of 116 images, w
tr
w
te
= ∅.
The classification scheme we used is a supervised learning
one, the class of each pattern f
⊂ w
tr
and f ⊂ w
te
is known.
From the possible statistical learning approaches or decision
rules we decide to chose one of the most popular approachs
and easy to implement methods: the nearest-neighbor clas-
sification (k-NN)(YangandLiu[20] refers to the k-NN rule
as one of the most efficient methods). This is a reasonable
approach as our aim is to compare different feature extrac-
tion methods for stripes images and not to test and to op-
timize different classifiers. The k-nearest neighbor (k-NN)
technique assigns a feature vector c
∈ R
N
te
from test set w
te
to the class Ω
κ
of the majority of its k-nearest-neighboring
image patterns from training set w
tr
. We consider one nearest
neighbor k
= 1 and use the euclidian distance d
2
as metric
space for feature vectors pairs. Mathematical expression of
k-NN can be stated as shown in Algorithm 1.
The classification algorithm consists of an initial training
phase using images of set w
tr
to define the optimal param-
eters adjustment. Then classification performance is mea-
sured with the test set w
te
while comparing the true state with
the detected state.
7. CLASSIFICATION RESULTS
The classification is done using the images of set w
te
with the
optimized parameters of the algorithm. We would like to un-
derline that we have tried to make this test set as represen-
tative as possible. The number of images of sets w
A
, w
A,R
,
w
R,S
,andw
R,T
is proportional to the number of images that
are classified by the industrial system and the proportion of
badly depicted stripes, that is, with a low quality, corresponds
to real recording condition.
The parameters of the algorithm were adjusted in such
a way that the inspection conditions defined by the indus-
trial process are fulfilled: 100% detection of all defects, 100%
classification of all structural defects as structural ones, and
<10% false classified nondefective surfaces, see Section 2.
The classification results are depicted in Tab le 3 .
We observed that these classification results are conform
with the constrains defined in the industrial requirements.
Some image examples with corresponding classification re-
sults are shown in Figure 14.
The first group of images (Figures 14(a)–14(d)) shows
examples of typical surfaces. Figures 14(a)-14(b) depicts
Table 3: Classification of image set w
te
∈ R
188
recorded under
industrial real time conditions using the proposed algorithm. The
classification task consists in assigning each image of set w
te
to one
of the three distinct classes Ω
A
, Ω
R,S
,andΩ
R,T
.
True state
Ω
A
Ω
R,S
Ω
R,T
Detected state
Ω
A
94 0 0
Ω
R,S
851 6
Ω
R,T
0029
(a) (b) (c) (d)
Ω
R,S
/Ω
R,S
Ω
R,S
/Ω
R,S
Ω
R,T
/Ω
R,T
Ω
A
/Ω
A
True state/detected state
(e) (f) (g) (h)
Ω
R,T
/Ω
R,S
Ω
R,T
/Ω
R,T
Ω
A
/Ω
A
Ω
A
/Ω
R,T
Figure 14: Examples of classified images f of set w
te
.Images(a)
and (b) show two good classified textural defects. The former has a
size of
∼0.3 mm and the latter of ∼1.5 mm. Images (c) and (d) show
two good classified images representing a structural and a recording
artefacts. Images (e) and (f) depict a textural defect (classified as
structural) and a good classified textural surface. Images (g) and (h)
are nearly the same recording artefact, but the former was classified
whereas the latter was wrongly classified as a textural surface.
structural defects of different sizes, a textural defect is shown
in Figure 14(c) and a recording artefact can be seen in
Figure 14(d).
The second image group gives a good impression of the
difficulty of the discrimination task. Figure 14(e) expresses a
wrongly classified textural defect as a structural one. Using
this image and the image shown in Figure 14(f), we observed
that the size of bright stripes deviation is approximately the
same, namely of half a period d(P). But, the former was clas-
sified as textural whereas the latter as structural by the visual
inspector. Maybe because the human vision also integrates
the size of the defect in his judgement, the real depth of a de-
fect is certainly more difficult to appreciate when the struc-
tural disturbances are small and cover a huge surface region.
Our last remark concerns the two last images, Figures
14(g) and 14(h) both depict similar recording artefacts. But
if the former was classified as a nondefective surface the lat-
ter was falsely classified as textural defect. The reason is of
course the bad image quality, both average shape
S values of
0.56 and 0.53 and average intensity values of 192 and 191
Yannick Caulier et al. 13
correspond to structural and textural values; see Figure 13.
Another important factor explaining the bad discrimination
is the “contrast” of the bright lines, which is much less steep
thaninFigures14(a) or 14(b) for example.
8. CONCLUSION
In this paper, we presented an original usage of adapted
structural illumination. This lighting technique integrates a
Lambertian diffuse part for the inspection of specular sur-
faces and a light aperture to project a structured light on the
inspected surface. The geometries of both are adapted to the
shape of the inspected objects, so that a simple periodical
pattern is observed in the images.
We demonstrated that a good enhancement of structural
and textural defects (without revealing nondefective surfaces
in the same time) is achieved. All the necessary information
is contained in one camera image, no stereo vision is needed
to discriminate the different nondefective surface types.
We also compared the proposed approach with diffuse
and retroreflector lighting techniques. This shows some diffi-
culties in enhancing all structural defects, whereas the second
tends to be too sensitive as a noncritical surface structure.
We validated the proposed lighting technique using the
images recorded by a daily used industrial application inte-
grating such an adapted structured illumination. These im-
ages are classified using a segmentation and classification al-
gorithms. No calibration of the recording setup elements,
which are the sensor, the illumination, and the specular sur-
face is needed. We show that a good discrimination of tex-
tural, structural, and nondefective surfaces with nonoptimal
recording conditions, that is with recording artefacts, is pos-
sible.
The next step will be to consider 2.5D rather than 3D
technique to measure the depth of the defects with only one
camera and one adapted illumination. Based on a simple cal-
ibration procedure, we want to propose a new deflectometric
approach with an adapted structured illumination.
LIST OF SYMBOLS OF THE MAIN COMPONENTS
(C): Recording camera sensor
(L): Light source/illumination
(S): Whole surface to inspect
(S
inspect
): Surface inspected with one camera
(s): Elementary inspected surface
ρ: Specular reflectance coefficient, %
α: Specular reflectance angle, rad
Π
scan
: Recording plane of a line-scan camera
(LP
projected
): Projected illumination pattern on (S)
(LP
reflected
): Reflected illumination pattern by (S)
N
r
:Numberofprojectedraysby(L)
(d
P,mm
): Illumination pattern period, mm
(d
P,px
): Illumination pattern period, pixel
f: Image pattern
(x
w
, y
w
, z
w
): World coordinate system
(u, v): Image coordinate system.
ACKNOWLEDGMENTS
The authors are grateful to Mr. Marco Flachman, a colleague
of the Fraunhofer IIS in Erlangen, for his help in compar-
ing different illumination techniques. They would like to
thank the Bavarian Research Foundation BFS (Bayerische
Forschungsstiftung) for its financial help, which helped them
to fulfil their research activities. They also would like to thank
the reviewers for their helpful comments which contributed
to improve the quality of the manuscript.
REFERENCES
[1] S. Schuetz, Gewinnung von 3-d-Information durch Strukturi-
erte Beleuchtung, 200.
[2] P. Lang, “ Multisensor ielle Prue fung von Freiformflaechen,
Ph.D. thesis,” Fraunhofer, Stuttgart, Germany, 1999.
[3] O. Hall-Holt and S. Rusinkiewicz, “Stripe boundary codes for
real-time structured-light range scanning of moving objects,”
in Proceedings of the 8th International Conference on Com-
puter Vision (ICCV ’01), vol. 2, pp. 359–366, Vancouver, BC,
Canada, July 2001.
[4] T. P. Monks, J. N. Carter, and C. H. Shadle, “Colour encoded
structured light for digitisation of real-time 3-d data,” in Pro-
ceedings of the IEE 4th International Conference on Image Pro-
cessing, pp. 327–330, Maastricht, The Netherlands, April 1992.
[5] H. Ortiz and M. Paterson, “Location and shape measurement
using a portable fringe projection system,” Experimental Me-
chanics , vol. 45, no. 3, pp. 197–204, 2005.
[6] S. Winkelbach and F. Wahl, “Shape from single stripe pattern
illumination,” in Proceedings of the 24th DAGM Symposium on
Pattern Recognition, vol. 2449 of Lecture Notes in Computer Sci-
ence, pp. 240–247, Zurich, Switzerland, September 2002.
[7] Isra, “A fast paper inspection system,” Tech. Rep., Isra Vision
System AG, Darmstadt, Germany, 2005.
[8] F.P.Le
´
on and J. Beyerer, “Active vision and sensor fusion for
inspection of metallic surfaces,” in Proceedings of the Intelligent
Robots and Computer Vision XVI: Algorithms, Techniques, Ac-
tive Vision, and Materials Handling, vol. 3208 of Proceedings of
SPIE, pp. 394–405, Pittsburg, Pa, USA, September 1997.
[9] CLK: Beetanalyser, Industry product information http://www
.clkgmbh.de/geschaeftsfelder-produkte/food-packing/.
[10] R. L. Reynolds, F. Karpaia, D. A. Claarke, and O. L. Hageniers,
“Theory and applications of a surface inspection technique us-
ing double-pass retroreflection,” Optical Engineering , vol. 32,
no. 9, pp. 2122–2129, 1993.
[11] H. Marguerre, “Kontrastierverfahren fuer Kruemmungen und
Welligkeiten an Oberflaechen zur Qualitaetspruefung,” z. b.
von Lackoberflaechen. Feinwerktechnik und Messtechnik 9,
1985.
[12] A. Jordan, F. Kahmann, and F. Luecking, “Dual solution for
high-end stripe inspection,” Material Testing , vol. 26, no. 4,
pp. 66–71, 2003.
[13] M. C. Knauer, J. Kaminski, and G. Haeusler, “Phase measur-
ing deflectometry: a new approach to measure specular free-
from surfaces,” Optical Metrology in Production Engineering,
vol. 5457, pp. 366–376, 2004.
[14] H. Niemann, Pattern Analysis and Understanding , Springer
Series in Information Sciences, Springer, Berlin, Germany,
2nd edition, 1990.
[15] S. Kammel and F. P. Le
´
on, “Head-mounted display for inter-
active inspection of painted free-form surfaces,” in Proceedings
of the Internat ional Society for Optical Engineering, vol. 5079
14 EURASIP Journal on Image and Video Processing
of Proceedings of SPIE, pp. 254–264, Orlando, Fla, USA, April
2003.
[16] S. Kammel and F. P. Le
´
on, “Deflektometrie zur qualit
¨
ats-
pr
¨
ufung spiegelnd reflektierender oberfl
¨
achen,” Technisches
Messen , vol. 70, no. 4, pp. 193–198, 2003.
[17] S. Kammel, “ Deflektometrische untersuchung spiegelnd reflek-
tierender freiformflchen, Ph.D. thesis,” University of Karlsruhe
(TH), Karlsruhe, Germany, 2004.
[18] D. P
´
erard, “ Automated visual inspection of specular surfaces
with st ructured-lighting reflection techniques, no. 869,Ph.D.
thesis,” VDI Verlag,
¨
usseldorf, Germany, 2001.
[19] R. B. Fisher and D. K. Naidu, “A comparison of algorithms for
subpixel peak detection,” in Advances in Image Processing,
Multimedia and Machine Vision , J. Sanz, Ed., pp. 385–404,
Springer, Heidelberg, Germany, 1996.
[20] Y. Yang and X. Liu, “A re-examination of text categoriza-
tion methods,” in Proceedings of the 22nd Annual International
ACM SIGIR Conference on Research and Development in In-
formation Retrieval (SIGIR ’99), pp. 42–49, ACM Press, New
York, NY, USA, 1999.