Báo cáo hóa học: " Research Article Extraction of 3D Information from Circular Array Measurements for Auralization with Wave Field Synthesis" ppt
Bạn đang xem bản rút gọn của tài liệu. Xem và tải ngay bản đầy đủ của tài liệu tại đây (1.79 MB, 10 trang )
Hindawi Publishing Corporation
EURASIP Journal on Advances in Signal Processing
Volume 2007, Article ID 13416, 10 pages
doi:10.1155/2007/13416
Research Article
Extraction of 3D Information from Circular
Array Measurements for Auralization with Wave
Field Synthesis
Diemer de Vries, Lars H
¨
orchens, and Peter Grond
Laboratory of Acoustical Imaging and Sound Control, Department of Image Science and Technology, Faculty of Applied Sciences,
Delft University of Technology, P.O. Box 5046, 2600 GA Delft, The Netherlands
Received 29 April 2006; Revised 3 October 2006; Accepted 8 February 2007
Recommended by Ville Pulkki
The state of the art of wave field synthesis (WFS) systems is that they can reproduce s ound sources and secondary (mirror im-
age) sources with natural spaciousness in a horizontal plane, and thus per form satisfactory 2D auralization of an enclosed space,
based on multitrace impulse response data measured or simulated along a 2D microphone array. However, waves propagating
with a nonzero elevation angle are also reproduced in the horizontal plane, which is neither physically nor perceptually correct.
In most listening environments to be auralized, the floor is highly absorptive since it is covered with upholstered seats, occu-
pied during performances by a well-dressed audience. A first-order ceiling reflection, reaching the floor directly or via a wall,
will be severely damped and will not play a significant role in the room response anymore. This means that a spatially correct
WFS reproduction of first-order ceiling reflections, by means of a loudspeaker array at the ceiling of the auralization reproduc-
tion room, is necessary and probably sufficient to create the desired 3D spatial perception. To determine the driving signals for
the loudspeakers in the ceiling array, it is necessary to identify the relevant ceiling reflection(s) in the multichannel impulse re-
sponse data and separate those events from the data set. Two methods are examined to identify, separate, and reproduce the
relevant reflections: application of the Radon transform, and decomposition of the data into cylindrical harmonics. Application
to synthesized and measured data shows that both methods in principle are able to identify, separate, and reproduce the relevant
events.
Copyright © 2007 Diemer de Vries et al. This is an open access article distributed under the Creative Commons Attribution
License, which permits unrestricted use, distribution, and reproduction in any medium, provided the original work is properly
cited.
1. INTRODUCTION
The traditional reproduction formats of audio reproduction,
like two-channel stereo and Dolby sur round [1], have the re-
stric tion that they provide correct spatial information only
in a limited listening area, the so-called “sweet spot.” With
the introduction of wave field synthesis (WFS) by Berkhout
[2], it became possible to generate sound fields with nat-
uralspatialpropertieswithinanextendedvolumeorarea
bounded by arrays of loudspeakers. The “ideal” WFS repro-
duction room would be a 3D space of proper dimensions, all
boundaries of which are covered with closely sampled arrays
of indiv idually driven loudspeakers. Then, the acoustic wave
field in any enclosed space could be simulated or reproduced
and listeners within that space could walk around and per-
ceive the acoustic conditions at any place with correct tem-
poral and spatial properties. The reproduction of the acous-
ticsofahallinadifferent environment is called auralization
in this context, as an extension of the definition of this term
by Kleiner et al. [3].
However, from viewpoints such as accessibility and com-
putational power, it is not realizable to cover all the bound-
aries with loudspeakers. Therefore, present WFS-based au-
ralization systems consist of a loudspeaker array configura-
tion in a horizontal plane, roughly at the elevation of the
ears of the listeners. Typical input data for the auralization
are multi-trace impulse responses measured [4]orsimulated
[5] along a 1D (linear) or 2D (cross-shaped circular) micro-
phone array in a horizontal plane. By this way, wave com-
ponents incident with an ele vation angle unequal to zero
are “projected” in the horizontal plane as will be further ex-
plained in the next section. The mirror image sources that
represent the boundary reflections are reproduced in the hor-
izontal plane according to the recorded arrival times, which
2 EURASIP Journal on Advances in Signal Processing
θ
R
ϕ, α
z
x
y
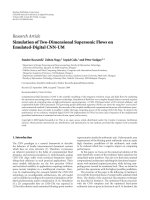
Figure 1: Geometry and variables of the circular array.
correspond to nonhorizontal travel paths. A 2D listening
space is simulated with most boundaries at wrong positions,
which might be perceived by the listener as missing the “hall
volume impression.”
Since the sensitivity of the human ear to vertical local-
ization is not ver y high [6, 7], some inaccuracy in the repro-
duction is permitted from a perceptual point of view. As the
floor of a concert hall or theatre is usually covered with ab-
sorptive seats or well-dressed listeners, it can be assumed that
sound waves, after being reflected by this floor surface, do not
play a significant role in a measured impulse response any-
more. Therefore, the first-order reflections from the ceiling
and second-order reflections via side walls and ceiling should
be the most important nonhorizontal contributions to the
sound field. As a first attempt to create a realistic perceptual
“volume” impression of a 3D hall, the TU Delft WFS system
is being extended with a ceiling array to control the elevation
angle of the significant ceiling reflections of the hall to be
auralized. For that purpose, these reflections should be iden-
tified and selected from the dataset measured with (or simu-
lated along) the microphone array in the horizontal plane. In
this paper, data simulated and measured along a circular mi-
crophone array are considered, since such arrays have proven
to be most efficient for auralization purposes [4].
Two d ifferent identification and selection methods are
examined. The first method is based on application of the
Radon transform. The second method decomposes the data
into cylindrical harmonics. Both methods aim to transform
the array data set from the “data space” to a “model space”
in such a way that interfering events in the data space appear
as distinct points in the model space. By this way, it will be
easy to identify different events and separate them from each
other. The last important step before the actual auralization
is the reproduction of the separated events in data space, re-
quiring a correct inverse transformation from model space to
data space.
2. 3D INFORMATION IN CIRCULAR ARRAY DATA
The coordinates, variables, and geometry used in the follow-
ing are specified in Figure 1. A circular microphone array
with radius R is positioned in the horizontal (x, y) plane.
Plane waves are considered incident on the array with az-
imuth angle ϕ and e levation angle θ (in degrees). Azimuth
angle ϕ is relative to some reference point, chosen here (x
=
−
R, y = 0, z = 0). Elevation angle θ is relative to the hor-
izontal (x, y) plane. A microphone position on the array is
specified by an angle α, also given in degrees relative to the
reference point.
θ
R
R
R
= R cos (θ)
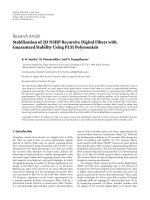
Figure 2: Geometry of plane waves incident on a circular array in
the horizontal plane.
17
16
15
14
13
12
11
10
9
8
7
t (ms)
−150 −100 −50 0 50 100 150
α (
◦
)
0
−5
−10
−15
−20
−25
(dB)
a
b
c
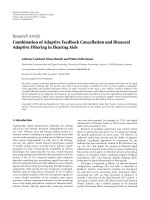
Figure 3: Arrival times as a function of microphone position on a
circular array for three plane waves with (a) ϕ
= 0
◦
, θ = 0
◦
, τ =
10 milliseconds, (b) ϕ = 40
◦
, θ = 30
◦
, τ = 13 milliseconds, and
ϕ
= 90
◦
, θ = 70
◦
, τ = 16 milliseconds (c) for an array with radius
R
= 1m.
If a plane wave travels in the horizontal plane, that is,
with elevation angle θ
= 0
◦
, and azimuth angle ϕ = 0
◦
,it
first arrives at microphone position α
= 0
◦
,seeFigure 2.The
arrival times of the wave on the circular microphone array
as a function of microphone position α are described by a
cosine-shaped curve:
1
the “maximum” is found for α = 0
◦
,
the “minimum” for α
=±180
◦
,andthe“zerovalue”for
α
=±90
◦
. In the following, the “average” arrival time at
which the center of the array is reached is called the inter-
cept time, denoted as τ. The geometrical amplitude of the
cosine-shaped arrival time curve is R/c,wherec represents
the sound velocity. The arrival time curve for this wave is
shown in Figure 3(a).
When a plane wave arrives at the array under a nonzero
elevation angle θ and azimuth angle ϕ
= 0
◦
, it again arrives
1
For an arbit rary signal, “arrival time” should be more precisely defined. In
the simulations and measurements considered in this paper, short broad-
band signals have been used which, in this context, can be considered as
Dirac pulses with well-defined arrival times with respect to their time of
generation t
= 0.
Diemer de Vries et al. 3
first at α = 0
◦
and last at α =±180
◦
. The arrival time
curve is still cosine-shaped, but now its geometrical ampli-
tude with respect to the intercept time decreases to R
/c with
R
= R cos θ as illustrated in Figure 2. The arrival time dif-
ferences between α
= 0
◦
and α =±90
◦
,andα = 0
◦
and
α
=±180
◦
are now reduced to R
/c and 2R
/c,respectively.
When, as extreme case, a plane wave arrives at the horizon-
tal array with vertical incidence (θ
= 90
◦
), it reaches all mi-
crophones at the same time and the arrival time curve is a
straig ht line. It can be concluded that the geometrical am-
plitudes of the arrival time curves in impulse response data
measured along a circular array in the horizontal plane con-
tain information about the elevation angles of incidence of
the plane wave components. However, due to the symmetry
of the setup with respect to the horizontal plane, it is not pos-
sible to distinguish between plane waves arriving from below
or from above the array. Since ceiling reflections always ar-
rive from above, the range of interest for the elevation angle
θ is restricted to 0
◦
<θ<90
◦
.
Variation of the azimuth angle of incidence ϕ of the plane
wave leads to a spatial phase shift of the cosine-shaped curve:
the first arrival at the array will occur for a nonzero micro-
phone position α. The general expression of the arrival time
curves is
t(α, ϕ, θ)
= τ −
R cos θ
c
cos(ϕ
− α). (1)
In the present work, a circular array using outward point-
ing cardioid microphones has been used for simulations and
measurements, as is usually done now in array-based room
acoustics analysis [4]. Therefore, the strength S of the signal
received at a microphone position α is weighted by a factor
according to the cardioid characteristics of the microphones,
depending on the angles ϕ and θ of the incident plane wave:
S(α, ϕ, θ)
=
P
0
2
1+cos(ϕ − α)cos(θ)
,(2)
where P
0
represents the pressure of the incident plane wave.
A simulation of the arrival time curves of three plane
waves with elevation angles θ
= 0
◦
,30
◦
,and70
◦
is shown
in Figure 3. The waves reach the array with azimuth angles
ϕ
= 0
◦
,40
◦
,and90
◦
,respectively.
For waves traveling in the horizontal plane, the strength
of the signal at microphone positions α
= ϕ ± 180
◦
, that
is, the “rear” of the array for that particular wave, tends to-
wards zero (see curve a in Figure 3(a)). The decrease in signal
strength is less for elevated plane waves, as shown in curves
b a nd c. For waves with vertical incidence (θ
= 90
◦
), the
strength of the recorded signal corresponds to half the pres-
sure of the incident plane wave at all microphone positions,
as is easily seen from (2).
3. SEPARATION AND RECONSTRUCTION
In the previous sec tion, it was shown that the arrival time
curves of plane waves in 2D array data contain 3D informa-
tion. This information will be used to identify first-order ceil-
ing reflections in circular array data sets measured in a con-
cert hall, using the realistic assumption that such reflections
112
110
108
106
104
102
t (ms)
−100 0 100
α (
◦
)
0
−5
−10
−15
−20
−25
(dB)
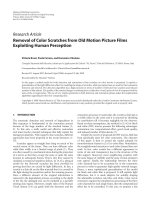
Figure 4: Multitrace impulse responses measured in the Frits
Philips Concert Hall, Eindhoven, The Netherlands.
can be considered to be plane waves at the array position.
Parts of such a data set, containing reflected waves arriving
within 100 milliseconds and 114 milliseconds after genera-
tion of the impulsive test signal, are shown in Figure 4.The
sound pressure of the reflected waves, measured with an out-
ward pointing cardioid microphone traveling along a hori-
zontal circle with a radius of 1 meter, is given as a function of
travel time t (vertical axis (ms)) and microphone position α
(horizontal axis, in degrees). This domain is called the data
space. It is seen that the cosine-shaped curves representing
the individual wave field components strongly interfere.
In order to make the identification of the ceiling reflec-
tion easier, the data is transformed to a model space,where
each wave component is represented by a well-resolved event.
After identification, the ceiling reflection is separated from
the other components by filtering. Then it is reconstructed
in the data space by inverse transformation, in a format that
can be applied to drive the ceiling array of the loudspeaker
configuration in the WFS reproduction room.
In the following, two methods will be investigated that
might be applied in the above procedure: application of the
Radon transform, and decomposition of the data into cylin-
drical har monics, and from there, into plane waves.
4. THE RADON TRANSFORM
4.1. Identification
The Radon transform is widely used, especially in the field
of seismic exploration, to detect components with a specific
shape in complex 2D data sets [8, 9]. Data (in the present
context: sound pressure data) are integrated along curves
with that shape. When strong amplitudes are present along
a certain curve, the integration wil l yield a high value, thus
detecting that component and its position in the data space.
The high integration value can be represented as a point in
a 2D model space where the position parameters of the in-
tegration curve are the coordinates. Most integration curves
can be written in the form
t
= τ + pf(α), (3)
4 EURASIP Journal on Advances in Signal Processing
where t is travel time, τ is the intercept time, that is, the time
at which the center of the array is reached, f (α) is the func-
tion of the angular microphone position that defines the ba-
sic shape of the integration curve, and p is some slope or
scaling parameter; the shape of the curve is fully specified by
the product pf(α).
The Radon transform is usually given in terms of a for-
ward transform from the data space d(α, t) to the model
space m(p, τ) and the adjoint transform mapping from the
model to the data space. These operators are not unitary in
general. Therefore, the adjoint transform does not result in
a perfect inversion of the forward transform: the successive
application of the forward transform and its adjoint will not
yield the original data in general. It is nevertheless possible to
calculate an approximate inversion of either the forward or
the adjoint transform. In the present work, the adjoint trans-
form is chosen to be inverted. We therefore denote the re-
sult of the forward transform as approximation of the model
space
m(p, τ). In the final implementation, the simple for-
ward transform is replaced by an i nversion scheme, details of
which are given further below.
The forward Radon transform describes a mapping from
the data space d(α, t) to the model space m(p, τ):
m(p, τ) =
∞
−∞
d
α, t = τ + pf(α)
dα. (4a)
The adjoint transformation is given by
d(α, t)
=
∞
−∞
m
p, τ = t − pf(α)
dp. (4b)
If, as in the context of this paper, the integr ation curves are
time-invariant, the Radon transform can also be performed
in the frequency domain, which appears to be faster than
time-domain processing:
M(p, ω) =
∞
−∞
D(α, ω)e
jωp f(α)
dα,(5a)
D(α, ω)
=
∞
−∞
M(p, ω)e
− jωpf (α)
dp. (5b)
In the context of seismic exploration, the integra tion curves
usually have the form of straight lines, parabolae or hyper-
bolae. In the present context, the wave components to be de-
tected are found at curves in the data space which are shaped
according to (1). We apply the transform for distinct values
of the angle θ. Therefore, we obtain a Radon transform pair
D
j
(α, ω), M
j
(ϕ, ω) for each chosen elevation angle θ
j
.We
denote the effective radius of the array for the particular an-
gle θ
j
as R
j
= cos θ
j
.
Inserting (1)in(5a), (5b) then leads to
M
j
(ϕ, ω) =
∞
−∞
D
j
(α, ω)e
− jω(R
j
/c)cos(ϕ−α)
dα,
(6a)
D
j
(α, ω) =
∞
−∞
M
j
(ϕ, ω)e
jω(R
j
/c)cos(ϕ−α)
dϕ.
(6b)
These equations can be written in discretized form as
M
j
ϕ
m
, ω
=
N
α
i=0
D
j
α
i
, ω
e
− jω(R
j
/c)cos(ϕ
m
−α
i
)
,
(7a)
D
j
α
i
, ω
=
N
ϕ
m=0
M
j
ϕ
m
, ω
e
jω(R
j
/c)cos(ϕ
m
−α
i
)
,
(7b)
or in vector/matrix form as
m
j
= Ld
j
,(8a)
d
j
= L
H
m
j
. (8b)
In order to optimize the correspondence between the re-
sult of the “inverse” Radon transform and the original data
space, in the present work (8a) has been replaced by a high-
resolution Radon transform as proposed by Sacchi and Ul-
rych [10]. This method employs a sparseness constraint on
the model domain and uses a conjugate gradient algorithm
in order to perform an approximate inversion of (8b)and
to optimize the solution iteratively. By inverse Fourier trans-
formation, the results of (8a), (8b) are brought back to the
model space m
j
(ϕ, τ) and the data space d
j
(α, t), respectively.
As the Radon transform performs a summation along the
curves in the data space, azimuthal strength information is
lost in the model space. It is nevertheless possible to account
for the angle-dependent signal strength due to the usage of
cardioid microphones, by extension of the Radon transform
presented above.
By integrating (2), it can easily be verified that the result
of an integration of cardioid microphone signals along a cir-
cle is independent of the azimuth and elevation angle of an
incident plane wave:
1
2π
2π
0
P
0
2
1+cos(ϕ − α)cos(θ)
dα =
P
0
2
. (9)
The usage of cardioid microphones leads to a weighting of
the model space by a factor 0.5. It is therefore sufficient to in-
clude the cardioid model when transforming from the model
to the data space:
D
j
α
i
, ω
=
N
ϕ
m=0
1+cos
ϕ
m
− α
i
cos
θ
j
×
M
j
ϕ
m
, ω
e
jω(R
j
/c)cos(ϕ
m
−α
i
)
.
(10)
Using a sparse inv ersion of (10) and a subsequent inverse
Fourier transform, m
j
(ϕ
m
, τ) has been calculated for the sim-
ulated data set of Figure 3, for three discrete values of the el-
evation angle: 0
◦
,30
◦
,70
◦
—corresponding to the elevation
angles of incidence for the three waves in the data set. In ad-
dition, the transformation to the model space has been calcu-
lated for an elevation angle of 50
◦
. Figure 5 shows the result.
For each elevation angle considered, a 2D model space frame
with (ϕ, τ) coordinates is g iven.
In the frames corresponding to plane waves with eleva-
tion angles actually present in the data set, the wave com-
ponents with elevation angles θ
= 0
◦
,30
◦
,and70
◦
can be
Diemer de Vries et al. 5
16
14
12
10
8
τ (ms)
−100 0 100
ϕ (
◦
)
0
−5
−10
−15
−20
−25
(dB)
(a)
16
14
12
10
8
τ (ms)
−100 0 100
ϕ (
◦
)
0
−5
−10
−15
−20
−25
(dB)
(b)
16
14
12
10
8
τ (ms)
−100 0 100
ϕ (
◦
)
0
−5
−10
−15
−20
−25
(dB)
(c)
16
14
12
10
8
τ (ms)
−100 0 100
ϕ (
◦
)
0
−5
−10
−15
−20
−25
(dB)
(d)
Figure 5: Result of Radon transform application to t he simulated data of Figure 3. Model space frames are shown for elevation angles (a)
θ
= 0
◦
,(b)30
◦
,(c)50
◦
, and (d) 70
◦
. The representations of the three waves in the data set are marked with circles in the corresponding
elevation angle frames.
found as well-resolved events, as expected (see circles). How-
ever, when considered in more detail, the events appear to
be extended, due to the imperfect inversion of the Radon
transform. Therefore, there is some “cross-talk” b etween the
frames of the model space: in frames not corresponding to
wave fronts in the data set, energy from other waves appears
as cross- or bowtie-shaped shadows. In the frame for θ
= 50
◦
(Figure 5(c)), only such shadows are present.
4.2. Separation and reconstruction
The wave component with an elevation angle θ
= 70
◦
could
be a first-order ceiling reflection. Therefore, it was attempted
to separate this component from the model space and recon-
struct it in the data space.
Figure 6 shows the model space frame for θ
= 70
◦
(Figure 5(d)), zoomed in on the event representing the wave
to be reconstructed. The cross-shaped extension of the repre-
sentation is clearly seen. Top right, a “tail” of the representa-
tion of the wave with θ
= 30
◦
is seen. Note that in the model
space of a data set measured in a concert hall, many such rep-
resentations interfere in such a way that even in that space,
full separation of the individual waves is impossible. There-
fore, a filtering window has to be chosen that will provide
a compromise between loosing energy belonging to the se-
lected wave component and including energy of other com-
ponents and noise.
16.8
16.6
16.4
16.2
16
15.8
15.6
15.4
15.2
τ (ms)
60 70 80 90 100 110 120
ϕ (
◦
)
0
−5
−10
−15
−20
−25
−30
(dB)
a
b
c
Figure 6: The model space frame for θ = 70
◦
(see Figure 5(d)),
zoomed in on the representation of the wave incident under that el-
evation angle. Three filter windows shown are used for the selection
of data for reconstruction in the data space.
As a first attempt, the rectangular window indicated as
“b” in Figure 6 was chosen to select the data for inverse
transformation to the data space. The reconstruction result
is given in Figure 7(b). It clearly resembles the correspond-
ing wave response in the original data set (see Figure 7(a)),
although subtraction of the reconstructed wave component
6 EURASIP Journal on Advances in Signal Processing
16
14
12
10
8
t (ms)
−100 0 100
α (
◦
)
(a)
16
14
12
10
8
t (ms)
−100 0 100
α (
◦
)
(b)
16
14
12
10
8
t (ms)
−100 0 100
α (
◦
)
−25
−20
−15
−10
−5
0
(dB)
(c)
Figure 7: (a) The simulated input data set, (b) the reconstructed response of the wave with ele vation ang le θ = 70
◦
, and (c) the result of
subtracting the reconstructed response from the original data.
16
14
12
10
8
t (ms)
−100 0 100
α (
◦
)
(a)
16
14
12
10
8
t (ms)
−100 0 100
α (
◦
)
(b)
16
14
12
10
8
t (ms)
−100 0 100
α (
◦
)
−25
−20
−15
−10
−5
0
(dB)
(c)
Figure 8: Results of subtracting the reconstructed response of the wave with elevation angle θ = 70
◦
from the data set of Figure 3,after
selecting the data in the model space using filter windows “a,” “b,” and “c” (indicated in Figure 6), respectively.
from the original dataset does not yield perfect removal of
the wave front (Figure 7(c)). This is mainly due to the imper-
fect inversion of the Radon transform and the loss in energy
caused by the filtering window.
Two other filtering windows have been applied, indicated
with “a” and “c” in Figure 6. Subtraction of the reconstructed
response from the original data yields the data sets shown in
Figures 8(a) and 8(c), respectively. In comparison with the
results of window “b” (see Figure 8(b)), the smaller window
“a” leaves some parts of the response uncompensated. The
application of the bigger window “c” results in better sup-
pression of the wave front, but also introduces some artifacts.
It can be concluded that the Radon transfor m method,
at least for simple simulated data sets, allows us to perform
the desired identification, separation, and reconstruction of
nonhorizontal components in impulse responses measured
along a circular array of cardioid microphones in the hor-
izontal plane. A more systematic study of the optimization
of the filtering windows for the selection of model space data
for reconstruction, including tapering and shaping according
to the data configuration, could further improve the perfor-
mance of the method.
5. CYLINDRICAL HARMONICS
Hulsebos e t al. [4] have shown how a wave field can be de-
composed into cylindr ical harmonics,
℘
(1)
k
ϕ
(r, ϕ, ω) = H
(1)
k
ϕ
(kr)e
jk
ϕ
ϕ
, (11a)
℘
(2)
k
ϕ
(r, ϕ, ω) = H
(2)
k
ϕ
(kr)e
jk
ϕ
ϕ
(11b)
Diemer de Vries et al. 7
represent the pressure fields of the incoming and outgoing
cylindrical harmonics, respectively. H
(1)
k
ϕ
(kr)andH
(2)
k
ϕ
(kr)are
Hankel functions of the first and second kinds, respectively;
k is the wave number. k
ϕ
is an integer indicating the order of
the cylindrical harmonic. It can be seen as an angular wave
number, forming a Fourier pair with the azimuthal angle ϕ.
Each cylindrical harmonic is the multiplication of a Han-
kel function with an orthogonal angular directivity function.
The sound field of a monopole corresponds to k
ϕ
= 0; a
dipole field is obtained by taking a linear combination of
℘
(2)
−1
and ℘
(2)
1
.
In [4], it is shown that after a double Fourier transform to
the angular wave number and frequency domains, the mea-
sured data can be expressed in terms of the pressure P and
the normal velocity V
n
(i.e., the component perpendicular
to the array) as
P
k
ϕ
, ω, R
=
Q
(1)
k
ϕ
, ω
H
(1)
k
ϕ
(kR)+Q
(2)
k
ϕ
, ω
H
(2)
k
ϕ
(kR),
(12a)
jρcV
n
k
ϕ
, ω, R
=
Q
(1)
k
ϕ
, ω
H
(1)
k
ϕ
(kR)+Q
(2)
k
ϕ
, ω
H
(2)
k
ϕ
(kR),
(12b)
where R is the array radius, and H
(1)
and H
(2)
are the deriva-
tives of the Hankel functions with respect to kR. Q
(1)
and Q
(2)
are the expansion coefficients of the incoming and outgoing
wave fields in terms of cylindrical harmonics, which can be
found from (12a), (12b), if P and V
n
are known on the array.
If there are no sources located inside the array, the incoming
and outgoing fields must be equal and it is possible to define
a single set of expansion coefficients:
Q
k
ϕ
, ω
=
1
2
Q
(1)
k
ϕ
, ω
+ Q
(2)
k
ϕ
, ω
. (13)
It is well known that the characteristics of a cardioid mi-
crophone can be obtained by combining a pressure-sensitive
monopole microphone and a velocity-sensitive dipole micro-
phone [11]:
S
k
ϕ
, ω, R
=
1
2
P
k
ϕ
, ω, R
+ jρcV
n
k
ϕ
, ω, R
. (14)
Equations (12a)and(12b) can therefore be rewritten as
S
k
ϕ
, ω, R
=
Q
k
ϕ
, ω
H
(1)
k
ϕ
(kR)+H
(2)
k
ϕ
(kR)− jH
(1)
k
ϕ
(kR)− jH
(2)
k
ϕ
(kR)
.
(15)
The decomposition describe d above is only correct for waves
propagating in the horizontal plane, that is, for elevation
angle θ
= 0
◦
.FromFigure 2, it follows that a plane wave
with nonzero elevation “sees” a smaller circular array, with
radius R
j
= R cos θ
j
. In order to determine the expan-
sion coefficients and perform the plane wave decomposi-
tion, R
j
shouldbeinsertedin(15) instead of R. Further-
more, the array receives only a projection of the normal ve-
locity V
n
= V
n
cos θ
j
. Again, the transformation is carried
out only for specific values of θ
j
.Inordertoaccountforplane
waves which are not propagating in the horizontal plane, (15)
therefore has to be rewritten as
S
j
k
ϕ
, ω, R
j
=
1
2
P
k
ϕ
, ω, R
j
+ jρccos
θ
j
V
n
k
ϕ
, ω, R
j
=
Q
j
k
ϕ
, ω
H
(1)
k
ϕ
kR
j
+ H
(2)
k
ϕ
kR
j
−
j cos
θ
j
H
(1)
k
ϕ
kR
j
+ H
(2)
k
ϕ
kR
j
.
(16)
Once the expansion coefficients have been found, the wave
field can be calculated for each value of the radial coordi-
nate r. It can be shown [4] that in a far-field approximation,
the plane wave decomposition of the incoming and outgoing
sound fields in terms of cylindrical harmonics is given by
s
∞
(ϕ, ω) =
1
π
k
ϕ
(− j)
k
ϕ
Q
j
k
ϕ
, ω
e
jk
ϕ
ϕ
. (17)
In the ideal case, a plane wave incident with a certain azimuth
angle should appear as a point after decomposition in the
model space if the elevation angle is chosen correctly for that
particular wave. After separation, the reconstruction in the
data space can simply be performed using (16)and(17)in
reverse order .
To test this method, the simulated data set of Figure 3
was used again. As earlier for the Radon transform method,
model space frames were constructed for elevation angles
θ
= 0
◦
,30
◦
,50
◦
,and70
◦
, shown in Figure 9. Again, the three
waves are represented by well-resolved “points” in the corre-
sponding frames, whereas the frame for θ
= 50
◦
only shows
low-energy artifacts and noise. As before, the wave with ele-
vation angle θ
= 70
◦
, representative for a ceiling reflection, is
selected for separation and reconstruction.
Figure 10 shows a zoomed-in picture of its model space
representation. In comparison with the Radon transform
equivalent, Figure 6, a similar cross-shaped extension pattern
of the “point” is seen, but n ow with lower energy. The same
filtering windows “a,” “b,” and “c” as in Figure 6 have been
chosen to select the data for reconstruction. Subtraction of
the reconstructed responses from the original data set yields
the results shown in Figures 11(a), 11(b),and11(c) for the
three windows, respectively. In all cases, the “ceiling reflec-
tion” response is reconstructed such that it can be removed
almost completely from the data. The best results are now ob-
tained for the larger windows “b” and “c.” Also here, a more
systematic study on window optimization has to be carried
out before real conclusions on the influence of its choice can
be drawn.
It can be concluded that also the plane wave decomposi-
tion by means of cylindrical harmonics allows us to identify,
separate, and reconstruct elevated components in impulse
responses measured along a circular array in the horizontal
plane, in a satisfactory manner.
8 EURASIP Journal on Advances in Signal Processing
16
14
12
10
8
τ (ms)
−100 0 100
ϕ (
◦
)
0
−5
−10
−15
−20
−25
(dB)
(a)
16
14
12
10
8
τ (ms)
−100 0 100
ϕ (
◦
)
0
−5
−10
−15
−20
−25
(dB)
(b)
16
14
12
10
8
τ (ms)
−100 0 100
ϕ (
◦
)
0
−5
−10
−15
−20
−25
(dB)
(c)
16
14
12
10
8
τ (ms)
−100 0 100
ϕ (
◦
)
0
−5
−10
−15
−20
−25
(dB)
(d)
Figure 9: Result of cylindrical harmonic decomposition of the simulated data of Figure 3. Model space frames are shown for elevation angles:
(a) θ
= 0
◦
,(b)30
◦
,(c)50
◦
, and (d) 70
◦
. The representations of the three waves in the data set are marked with circles in the corresponding
elevation angle frames.
16.8
16.6
16.4
16.2
16
15.8
15.6
15.4
15.2
τ (ms)
60 70 80 90 100 110
ϕ (
◦
)
0
−5
−10
−15
−20
−25
−30
(dB)
a
b
c
Figure 10: The model space frame for θ = 70
◦
(see Figure 9(d)),
zoomed in on the representation of the wave incident under that el-
evation angle. Three filter windows are shown used for the selection
of data for reconstruction in the data space.
6. APPLICATION TO MEASURED DATA
Both methods discussed above have been applied to the data
set measured in the Frits Philips Concert Hall in Eindhoven,
The Netherlands, shown in Figure 4. Figure 12(a) shows the
measured data set, containing the first-order ceiling reflec-
tion around t
= 110 milliseconds.
Note that since the signal source was positioned at the
stage center, the azimuth angle of incidence of the ceiling re-
flection is ϕ
= 0
◦
. Figure 12(b) shows the ceiling reflection
response after identification, separation, and reconstruction
using the Radon transform method for an elev ation angle
θ
= 70
◦
. The result of subtracting the isolated ceiling reflec-
tion from the original data set is shown in Figure 12(c).The
selected ceiling reflection is not sufficiently damped as can
be seen from the remaining artifacts indicated by the arrow
in Figure 12(c). This is mainly due to the imperfect inversion
that is inherent to the Radon transform.
In Figure 13, similar results are presented for the cylin-
drical harmonic decomposition method. Figure 13(a) shows
the measured input data, Figure 13(b) shows the response
of the ceiling reflection after identification, separation, and
reconstruction using the cylindrical harmonic decomposi-
tion method. The extracted ceiling reflection is about 5 dB
stronger than in the Radon case. Therefore, better suppres-
sion can be achieved after subtraction from the original
data set. The region indicated by the arrow in Figure 13(c)
exhibits fewer artifacts than the corresponding region in
Figure 12(c).
It can be concluded that both methods are able to iden-
tify, separate, and reconstruct specific reflections from a data
set measured along a circular array in the horizontal plane.
7. CONCLUSIONS
In multitrace impulse responses measured in a hall, using
a circular array with cardioid microphones in the horizon-
tal plane, plane wave data appear on cosine-shaped arrival
Diemer de Vries et al. 9
16
14
12
10
8
t (ms)
−100 0 100
α (
◦
)
(a)
16
14
12
10
8
t (ms)
−100 0 100
α (
◦
)
(b)
16
14
12
10
8
t (ms)
−100 0 100
α (
◦
)
−25
−20
−15
−10
−5
0
(dB)
(c)
Figure 11: Results of subtracting the reconstructed response of the wave with elevation ang le θ = 70
◦
from the data set of Figure 3,after
selecting the data in the model space using filter windows “a,” “b,” and “c” (indicated in Figure 10), respectively.
112
110
108
106
104
102
t (ms)
−100 0 100
α (
◦
)
(a)
112
110
108
106
104
102
t (ms)
−100 0 100
α (
◦
)
(b)
112
110
108
106
104
102
t (ms)
−100 0 100
α (
◦
)
−25
−20
−15
−10
−5
0
(dB)
(c)
Figure 12: (a) Detail of the measured data set of Figure 4, (b) reconstruction of the response of the first-order ceiling reflection using the
Radon transform method, (c) the result of subtracting (b) from (a).
112
110
108
106
104
102
t (ms)
−100 0 100
α (
◦
)
(a)
112
110
108
106
104
102
t (ms)
−100 0 100
α (
◦
)
(b)
112
110
108
106
104
102
t (ms)
−100 0 100
α (
◦
)
−25
−20
−15
−10
−5
0
(dB)
(c)
Figure 13: (a) The measured data set of Figure 4, (b) reconstruction of the response of the first-order ceiling reflection using the cylindrical
harmonics decomposition method, (c) the result of subtracting (b) from (a).
10 EURASIP Journal on Advances in Signal Processing
time curves. The geometrical amplitude of the cosine is de-
termined by the elevation angle under which the wave arrives
at the array. The strength of the recorded signal at a certain
position on the array is determined by both the azimuth and
elevation angles of the incident wave.
By this way, a 2D array recording contains 3D informa-
tion, which can be used to identify, separate, and reconstruct
first-order ceiling reflections from the data for further pro-
cessing in 3D auralization by wave field synthesis.
Two methods have been investigated for this purpose: ap-
plication of a 2D Radon transform to the impulse response
data, and decomposition of the data into cylindrical harmon-
ics and from there into plane waves. Both methods trans-
form the data to a so-called model space where the individual
wave components are well resolved. Here, the relevant com-
ponents are separated by filtering and are reconstructed in
the data space by inverse transformation.
Both methods appear to be able to provide useful results.
However, the cylindrical harmonics decomposition method
outperforms the Radon tr ansform due to the fact that the
inversion of the Radon transform is only approximate.
Since the filtering windows used to separate the relevant
data from the model space should have a significant influence
on the performance of both methods, they should be further
optimized.
REFERENCES
[1] R. Dressler, Dolby Pro Logic Surround Decoder Principles of Op-
eration, Dolby Laboratories Licensing, San Francisco, Calif,
USA, 1993.
[2] A. J. Berkhout, “A holographic approach to acoustic control,”
Journal of the Audio Engineering Society, vol. 36, no. 12, pp.
977–995, 1988.
[3] M. Kleiner, B I. Dalenback, and P. Svensson, “Auralization—
an overview,” Journal of the Audio Engineering Society, vol. 41,
no. 11, pp. 861–875, 1993.
[4] E. Hulsebos, D. de Vries, and E. Bourdillat, “Improved micro-
phone array configurations for auralization of sound fields by
wave-field synthesis,” Journal of the Audio Engineering Society,
vol. 50, no. 10, pp. 779–790, 2002.
[5] A. J. Berkhout, D. de Vries, J. Baan, and B. W. Van den Oetelaar,
“A wave field extrapolation approach to acoustical modeling in
enclosed spaces,” Journal of the Acoustical Society of America,
vol. 105, no. 3, pp. 1725–1733, 1999.
[6] J. Blauert, “Sound localization in the median plane,” Acustica,
vol. 22, no. 4, pp. 205–213, 1969.
[7] J. Blauert, Spatial Hearing, MIT Press, Cambridge, Mass, USA,
1983.
[8] S. R. Deans, The Radon Transform and Some of Its Applications,
Jon Wiley & Sons, New York, NY, USA, 1983.
[9] P. Toft, The Radon Transform—Theory and Implementation,
Ph.D. thesis, Technical University of Denmark, Lyngby, Den-
mark, 1996.
[10] M. D. Sacchi and T. J. Ulrych, “High-resolution velocity gath-
ers and offset space reconstruction,” Geophysics, vol. 60, no. 4,
pp. 1169–1177, 1995.
[11] L. E. Kinsler, A. R. Frey, A. B. Coppens, and J. V. Sanders, Fun-
damentals of Acoustics, chapter 14, John Wiley & Sons, New
York, NY, USA, 2000.
Diemer de Vries was born on January 3,
1945, in Weststellingwerf, The Netherlands.
He received his M.S. degree at Delft Uni-
versity of Technology in 1971, carrying out
his graduate research at the Laboratory
of Acoustical Imaging and Sound Control,
which he afterwards joined as a member of
staff. During his career as a university re-
searcher,heworkedonprojectsinroom
acoustics, building acoustics, and seismic
signal processing. In 1984, he received the Ph.D. degree on a the-
sis in the latter field. He now coordinates, as an Associate Professor,
the research on array technology-based wave field analysis and syn-
thesis in room acoustics, building acoustics, and audio technolog y.
Since 1981, he also teaches at the Royal Conservatory of Music in
The Hague, at the Department of “Art of Sound.” During the sum-
mer semester of 2001, he fulfilled the “Edgard Varese” guest pro-
fessorship at TU Berlin. In 2004, he held a Guest Professor Chair
at TU Ilmenau, Germany. Diemer de Vries is the Past Chairman of
the Dutch Acoustical Association. He is a Fellow of the AES and
a Member of the ASA. As a specific form of applied acoustics, he
plays the double bass in se veral orchestras and chamber music en-
sembles.
Lars H
¨
orchens was born in M
¨
onchenglad-
bach, Germany, in 1979. He studied media
technology at Ilmenau Technical Univer-
sity with emphasis on audiovisual technol-
ogy. After receiving his diploma in 2005, he
joined the Laboratory of Acoustical Imag-
ing and Sound Control at Delft University
of Technology, where he is currently work-
ing on his Ph.D. thesis on the analysis of dis-
persive wave fields using array technology.
Peter Grond simultaneously started two
studies after his secondary school: playing
the violin at the Conservatory of Music
in Rotterdam and Applied Physics at Delft
University of Technology. In 2001, he grad-
uated at the Conservatory. He decided to
complete his studies in Delft before start-
ing a musical career, which he did in 2005.
The research for his M.S. thesis forms the
nucleus of the work reported in this paper.
At present, Peter is successful as a violinist in several ensembles,
amongst which is his own formation “Free Impulse,” for which he
writes the arrangements.