Báo cáo hóa học: " Research Article Diurnal Changes of Heart Rate and Sympathovagal Activity for Temporal Patterns of Transient Ischemic Episodes in 24-Hour Electrocardiograms" pptx
Bạn đang xem bản rút gọn của tài liệu. Xem và tải ngay bản đầy đủ của tài liệu tại đây (2 MB, 10 trang )
Hindawi Publishing Corporation
EURASIP Journal on Advances in Signal Processing
Volume 2007, Article ID 32386, 10 pages
doi:10.1155/2007/32386
Research Article
Diurnal Changes of Heart Rate and Sympathovagal Activity for
Temporal Patterns of Transient Ischemic Episodes in 24-Hour
Elec trocardiograms
A. Smrdel and F. Jager
Faculty of Computer and Information Science, University of Ljubljana, 1000 Ljubljana, Slovenia
Received 26 April 2006; Revised 27 October 2006; Accepted 11 January 2007
Recommended by Maurice Cohen
We test the hypothesis that different temporal patterns of transient ST segment changes compatible with ischemia (ischemic
episodes) are a result of different physiologic mechanisms responsible for ischemia. We tested the hypothesis using records of
the Long-Term ST Database. Each record was divided into three intervals of records: morning, day, and night intervals; and was
inserted into one of three sets according to the temporal pattern of ischemia: salvo, periodic, and sporadic pattern. We derived time-
and frequency-domain parameters of the heart rate time series in selected intervals in the neighborhood of ischemic episodes. We
used the adaptive autoregressive method with a recursive least-square algorithm for consistent spectral tracking of heart rate time
series and to study frequency-domain sympathovagal behavior during ischemia. The results support the hypothesis that there are
at least two distinct populations, which differ according to mechanisms and temporal patterns of ischemia.
Copyright © 2007 A. Smrdel and F. Jager. This is an open access article distributed under the Creative Commons Attribution
License, which permits unrestricted use, distribution, and reproduction in any medium, provided the original work is properly
cited.
1. INTRODUCTION
Ischemia is one of the most common heart diseases. It is
caused by the insufficient supply of the heart muscle with the
oxygen, which c an cause part of the heart muscle to become
electrically inactive, and can in turn lead to acute myocardial
infarction, and consequently death. To further complicate
the matter, up to 95% of ischemic episodes may be silent [1],
while others are symptomatic. Ischemia o ccurs in different
ischemic syndromes, such as coronar y arter y disease, stable
angina pectoris, unstable angina, Prinzmetal’s angina, trans-
mural angina, and syndrome X [2]. The most commonly is-
chemia appears in patients with stable coronary artery dis-
ease. In these patients, ischemia is usually preceded with a
marked increase in heart rate, and majority of episodes ap-
pear to be caused by a physical exertion, where patophysiol-
ogy is connected to increased oxygen demand associated with
increased myocardial contractility and blood pressure. Less
common are ischemic episodes which are not preceded by
an increase in heart rate. These episodes usually appear due
to mental stress, where patophysiology is connected to re-
duced oxygen supply due to coronary vasoconstrictions. This
group includes ischemic episodes of Prinzmetal’s angina due
to vasospasms, of unstable angina due to thrombosis, and of
microvascular angina. Determining the type of ischemia (in-
creased demand or reduced supply) for a given patient us-
ing the analysis of the long-term ambulator y electrocardio-
graphic (ECG) records of the patient alone would not only
reduce the cost, but would also represent a noninvasive alter-
native to current invasive techniques for optimal selection of
therapy.
Previous study [3] described three different patterns of
ischemic episodes in the European Societ y of Cardiology ST-
T Database (ESC DB) [4]: salvo pattern, where episodes ap-
pear in short bursts; periodic pattern, where episodes appear
quasiperiodically during the entire record; and sporadic pat-
tern, where episodes appear without regularity. The hypothe-
sis was set that different physiologic mechanisms are respon-
sible for different patterns, namely, that the salvo patterns ap-
pear due to reduced oxygen supply caused by vasospasms,
emboly, or mental stress, while the sporadic patterns appear
due to increased oxygen demand caused by increased physi-
cal activity. Further study, using records of the ESC DB, tested
the hypothesis [5]. The observations of this study supported
the hypothesis, but the authors also pointed out that the
short duration of records in the ESC DB (2 hours) does not
2 EURASIP Journal on Advances in Signal Processing
permit accurate classification of records according to tempo-
ral patterns. Since then, the Long-Term ST Database (LTST
DB) [6] was released. The LTST DB contains 86 24-hour
expert-annotated ECG record, with a selection of records
covering majority of the ischemic syndromes. Owing to the
duration of records, the LTST DB enables better classification
of records according to temporal patterns, and in addition,
enables studies regarding diurnal changes. With numerous
samples of different temporal patterns, the LTST DB allows
studies of physiologic mechanisms responsible for ischemia.
Preliminary study in order to test the hypothesis using the
LTST DB was conducted in [7].
In this paper, we test the hypothesis, using the 24-hour
records of the LTST DB, that the salvo patterns are caused
due to vasospasms while the sporadic patterns appear due to
physical exertion. We studied time- and frequency-domain
parameters of instantaneous heart rate (IHR) before and
during ischemic episodes for records with distinct temporal
patterns of ischemia (salvo, periodic, sporadic) during differ-
ent intervals of records (morning, day, night) and during the
entire record.
2. METHODS
We divided each record of the LTST DB into three intervals
of records (see Figure 1):
(i) night interval: time when the patient is asleep;
(ii) morning interval: a 90-minute interval, following the
night interval;
(iii) day interval: the rest of the record.
Time when the patient is asleep is not provided within
the LTST DB, so we identified the night interval for each
record by observing trends of heart rate, which is lower
and smoother during the sleep, time series of QRS complex
Karhunen-Lo
`
eve (KL) coefficients, in which much more sud-
den step changes due to axis shifts are present during the
night, and noise, w hich is not as frequent during the sleeping
period as it is during the wake period. The morning inter-
val was defined as a 90-minute interval following the night
interval. The rest of the record was considered to be the day
interval. We then divided records of the LTST DB into three
sets using visual examination of time series of ST segment
deviation levels:
(i) the salvo-episode set which includes 6 records with dis-
tinct salvo patterns of episodes: s20021 (see Figure 2),
s20151, s20171, s20291, s20301 and s20311;
(ii) the periodic-episode set which includes 12 records with
periodic pattern of episodes: s20041, s20111, s20121,
s20131, s20181, s20261, s20271, s20411, s20511,
s20611, s30671, s30681 (see Figure 1);
(iii) the sporadic-episode set which includes 24 records with
sporadic pattern of episodes: s20031, s20081, s20101
(see Figure 3), s20191, s20251, s20331, s20341, s20351,
s20361, s20381, s20391, s20431, s20441, s20451,
s20481, s20491, s20551, s20571, s20601, s30701,
s30731, s30751, s30791, s30801.
Of the remaining 44 records, 21 showed no distinct
patterns of ischemic ST segment changes (s20051, s20161,
s20281, s20321, s20371, s20401, s20421, s20461, s20471,
s20561, s20581, s20591, s30661, s30691, s30711, s30721,
s30741, s30742, s30761, s30771 and s30781), 18 records had
no significant ischemic changes (s20011, s20061, s20071,
s20091, s20141, s20201, s20211, s20221, s20231, s20241,
s20501, s20521, s20531, s20541, s20621, s20631, s20641 and
s20651), while 5 records were excluded as duplicate records
of patients already included in one of the three sets (s20272,
s20273, s20274, s30732, and s30752). Multiple records be-
longing to the same patient exhibited the same temporal pat-
tern, and only the first record of the same patient was in-
cluded into one of the three sets.
We derived IHR time series, w here abnormal beats and
their neighbors were excluded. The IHR time series were then
resampled (Δt
= 0.5 s) and smoothed (3-point moving aver-
age). Next we derived time- and frequency-domain parame-
ters of the IHR time series over several intervals before and
during ischemic episodes (see Figure 4). We derived time-
domain parameters by calculating the mean and standard de-
viation of the IHR in the intervals and two time series of the
frequency-domain parameters of the IHR: fraction of the to-
tal IHR power in the low-frequency (LF) band (from 0.04 Hz
to 0.15 Hz) and fraction of the total IHR power in the high-
frequency (HF) band (from 0.15 Hz to 0.4 Hz). Using these
time series, we computed mean and standard deviation of the
frequency-domain parameters in intervals before and during
ischemia.
To derive the frequency-domain parameters of the IHR
time series we used the adaptive autoregressive method with
recursive least-square (RLS) algorithm [8, 9]. The advantage
of this method is that it is able to adapt to nonstationary be-
havior of time series being analyzed by adaptively estimat-
ing autoregressive (AR) coefficientsforeachsample.TheAR
coefficients are updated on the basis of previous ones and a
forgetting factor λ. Changes of the signal spectra characteris-
tics are tr acked by weighting the performance index
of the
RLS-based predictor:
=
n
i=0
λ
n−i
e(i)
2
,(1)
where 0 <λ
≤ 1 is the forgetting factor, n is the index of the
last sample considered, and e(i) is the estimation error,
e(i)
= y(i) − y(i). (2)
The predicted signal
y(i)canbeestimatedas
y(i) =
M
m=1
a
m
(n)y(i − m) =
a(n)
T
y(i − 1), (3)
where a(n) are the prediction coefficients, M is the order of
the model, and
y(i
− 1) =
⎡
⎢
⎢
⎢
⎢
⎣
y(i − 1)
y(i
− 2)
.
.
.
y(i
− M)
⎤
⎥
⎥
⎥
⎥
⎦
. (4)
A. Smrdel and F. Jager 3
−200
−100
0
100
200
−200
−100
0
100
200
40
80
120
160
Record:
s30681
heart rate
(bpm)
Combined ep.
Lead 0
ST deviation
level (μV)
Ischemic ep.
Lead 1
ST deviation
level (μV)
Ischemic ep.
0 2:00:00 4:00:00 6:00:00 8:00:00 10:00:00 12:00:00 14:00:00 16:00:00 18:00:00 20:00:00 22:00:00
Time (h:m:s)
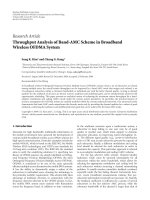
Figure 1: Time trends of a three-lead record s30681 (first two leads shown) from the periodic-episode set (all 24 hours of the recording are
shown, recording starts at 11:35:00, which corresponds to the time 0:00 in this figure). Vertical lines separate day, night, morning, and day
intervals. From top to bottom: heart rate (bpm); ischemic episodes from all leads, combined in the sense of logical OR function; ST segment
deviation for lead 0 (μV); ischemic episodes for lead 0; ST segment deviation for lead 1 (μV); ischemic episodes for lead 1.
−200
−100
0
100
200
−200
−100
0
100
200
40
80
120
160
Record:
s20021
heart rate
(bpm)
Combined ep.
Lead 0
ST deviation
level (μV)
Ischemic ep.
Lead 1
ST deviation
level (μV)
Ischemic ep.
7:00:00 7:30:00 8:00:00 8:30:00 9:00:00 9:30:00 10:00:00 10:30:00 11:00:00 11:30:00 12:00:00 12:30:00
Time (h:m:s)
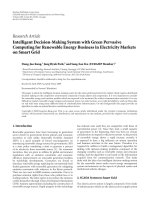
Figure 2: Time trends of a two-lead record s20021 from the salvo-episode set (6-hour excerpt from 24-hour record is shown, recording
starts at 11:00:00, corresponding to the t ime 0:00 at the beginning of this record, the last few hours of the day interval and the beginning of
the night interval are shown, which are separated by a vertical line). (For the legends, see caption of Figure 1.)
The performance index must be minimized according to the
adaptive prediction coefficients vector (δ
/δa = 0), thus sat-
isfying the following expression:
a(n)
=
R(n)
−1
p(n), (5)
where R(n) represents the autocorrelation matrix of
{y(i)}
signal calculated on M samples over a window of n samples:
R(n)
=
n
i=0
λ
n−i
y(i − 1)
y(i − 1)
T
,(6)
and
p(n)
=
n
i=0
λ
n−i
y(i)y(i − 1). (7)
From this equation, the first vector of prediction coefficients,
a(n), is calculated. All other vectors are calculated, without
minimizing the performance index, following the recursive
formula:
a(n)
= a(n − 1) − e
n
n − 1
g(n), (8)
where
e
n
n − 1
=
y(n) −
a(n − 1)
T
y(n − 1) (9)
represents the estimation error and g(n) represents the
Kalman gain vector,
g(n)
=
Q(n − 1)y(n − 1)
λ +
y(n − 1)
T
Q(n − 1)y(n − 1)
, (10)
and Q(n)
= R(n)
−1
. For each sample, the Q(n)isrecursively
updated,
Q(n)
=
I − g(n)
y(n − 1)
T
Q(n − 1)
λ
, (11)
where I is the unit matrix. The power spectral density S(ω, n)
can be estimated at the nth sample from the AR coefficients
a(n):
S(ω, n)
=
σ
2
e
(n)
1+
M
i=1
a
i
(n)e
− jiωΔt
2
, (12)
4 EURASIP Journal on Advances in Signal Processing
−200
−100
0
100
200
−200
−100
0
100
200
40
80
120
160
Record:
s20101
heart rate
(bpm)
Combined ep.
Lead 0
ST deviation
level (μV)
Ischemic ep.
Lead 1
ST deviation
level (μV)
Ischemic ep.
9:00:00 9:30:00 10:00:00 10:30:00 11:00:00 11:30:00 12:00:00 12:30:00 13:00:00 13:30:00 14:00:00 14:30:00
Time (h:m:s)
Figure 3: Time trends of a two-lead record s20101 from the sporadic-episode set (6-hour excerpt from the 24-hour record is shown, record-
ing starts at 9:33:00, corresponding to the time 0:00 at the beginning of this record, the last few hours of the day interval and the beginning
of the night interval are shown, which are separated by a vert ical line). (For the legends, see caption of Figure 1.)
Ischemic episode
I
··· t
B
6−3
B
3−0
I
0−3
B
6−3
= B
3−0
= I
0−3
= 3min
Figure 4: Time intervals before and during ischemic episodes, used
for the time- and frequency-domain analyses.
where σ
2
e
(n) is the noise power at the nth sample and Δt
is the sampling interval. A previous study [8] found that a
model order, M, of 12 allows acceptable discrimination of
the frequencies of interest. With higher order, the model is
more adapted and also more prone to noise, while compu-
tation is slower. The number of samples, participating in
the power spectra estimation, depends on the forgetting fac-
tor λ.Forλ
= 1, the entire time series contributes to the
power spectra estimation, which is acceptable for the sta-
tionary time series, while for the nonstationary time series
values of λ smaller than 1 are required, which per m it faster
adaption. With low values of λ, the system better adapts
to changes but is also more sensitive to noise, which de-
mands value of λ to be close to 1. This allows for longer win-
dows, thus making the system more insensitive to noise but
also less able to track rapid changes. The border frequencies
of LF and HF bands (0.04–0.15 Hz and 0.15–0.4 Hz, resp.)
correspond to periods of 25 seconds (0.04 Hz), 6.7 seconds
(0.15 Hz), and 2.5 seconds (0.4 Hz). We chose the values of
λ
= 0.985, which corresponds to exponentially weighted
window of 33 seconds (λ/(1
− λ)). This window length also
corresponds to the shortest annotated episode in the LTST
DB, which is 30 seconds in duration. The fraction of the total
IHR power in the LF band was used to estimate the sympa-
thetic activity, while the fraction of the total IHR power in
the HF band was used to estimate the vagal activity.
From obtained time- and frequency-domain measure-
ments, we derived aggregate average statistics for the sets dur-
ing all intervals of records. To assess significant differences
in intervals before and during ischemia, we used statistical
method one-way ANalysis Of VAriance (ANOVA) [10], while
to assess significant differences between pairs of sets during
intervals of records prior to and during ischemia, we used
Student t test [11], which is a special case of one-way ANOVA
for two sets. A value of P<.01 was considered significant.
3. RESULTS
A number of ischemic episodes and percentages of ischemia
duration per set for different intervals of records are shown in
Tab le 1. The incidence of ischemia as compared to other in-
tervals of records is the greatest for all sets during the morn-
ing interval, while the lowest incidence is during the night
interval. For the salvo-episode set the changes in incidence
throughout different intervals of records are minor. Dur-
ing the morning interval, the ischemia duration was only
slightly higher than during the day and night intervals. For
the periodic- and sporadic-episode sets, the changes during
different intervals are much more prominent. For these two
sets, the percentage of ischemia duration during the morning
interval is almost twice as high as it is during other intervals
of records. For the sporadic-episode set, only two episodes
appear during the night interval, when there is no physical
activity.
Tab le 2 shows aggregate average heart rates for all sets
during the intervals of records. The lowest heart rate is ex-
hibited for the salvo-episode set. Generally, the highest heart
rate for each set is during the morning interval, except for the
periodic-episode set, when slightly higher heart rate is during
the day interval. For the periodic- and sporadic-episode set
the heart rate during the night interval significantly differs
from that during the morning (t test: P<.005 and P<.001,
resp.) and day interval (t test: P<.005 and P<.001, resp.),
indicating much lower heart rate during the night interval as
it is during the morning and day intervals. Ta ble 3 shows ag-
gregate average ratios of the mean heart rate of the intervals
I
0−3
and B
3−0
. The lowest ratio of the mean heart rate is dur-
ing the day interval for all the sets, while the highest is during
A. Smrdel and F. Jager 5
Table 1: Number of ischemic episodes and percentages of ischemia duration (bracketed) per set for different intervals of records.
Number of episodes Morning Day Night Entire record
Salvo-episode set 18 (9%) 104 (6%) 60 (6%) 182 (6%)
Periodic-episode set
27 (34%) 195 (17%) 60 (8%) 282 (15%)
Sporadic-episode set
23 (13%) 136 (8%) 2(0%) 161 (6%)
Table 2: Aggregate average heart rates for all sets during the intervals of records. Standard deviations are bracketed.
Heart rate (bpm) Morning Day Night Entire record
Salvo-episode set 74.3 (13) 69.7 (10) 59.1 (10) 66.2 (11)
Periodic-episode set
78.2
‡
1
(11) 79.1
‡
2
(11) 66.0 (7) 74.7 (9)
Sporadic-episode set
79.3
1
(11) 76.9
2
(8) 62.7
3
(7) 72.4 (7)
‡
1
P<.005 (morning, night, periodic).
‡
2
P<.005 (day, night, periodic).
1
P<.001 (morning, night, sporadic).
2
P<.001 (day, night, sporadic).
3
P<.001
(night, entire record, sporadic).
Table 3: Aggregate average ratios of the mean heart rate of the in-
tervals I
0−3
(HR
I
0−3
)andB
3−0
(HR
B
3−0
).
HR
I
0−3
/HR
B
3−0
Morning Day Night Entire record
Salvo-episode set 1.054 1.041 1.048 1.048
Periodic-episode set
1.156 1.096 1.178 1.139
Sporadic-episode set
1.122 1.117 1.264 1.126
the morning interval for the salvo-episode set and dur ing the
night interval for the periodic- and sporadic-episode sets.
Figure 5 shows aggregate average heart rates for the sets
during intervals of records and for the entire record before
and during ischemia. Generally, the lowest heart rate is ex-
hibited for the salvo-episode set throughout the intervals of
records and for the entire record for intervals before and dur -
ing ischemia, while the highest heart rate is exhibited for the
sporadic-episode set. In the intervals of records and for the
entire record, for all the sets, the heart rate in the intervals
B
3−0
and I
0−3
rises but this increase is the least prominent
for the salvo-episode set. During the morning interval before
the ischemia onset, the heart rate for the salvo- and periodic-
episode set is approximately equal, while during ischemia the
heart rate for the periodic-episode set is much higher as it is
for the salvo-episode set. In the day interval, during the in-
tervals B
3−0
and I
0−3
, the heart rate for the salvo-episode set
significantly differs from that of the sporadic-episode set (t
test: P<.005 in both cases), indicating that different mech-
anisms might be responsible for ischemia in these two sets.
In the night interval, the heart rate for the salvo-episode
set is much lower than the heart rate for the periodic- and
sporadic-episode sets, but for all three sets, and not just for
the salvo-episode set, the heart rate starts to rise only dur-
ing ischemia. The overall results (entire record) show that the
heart rate for the salvo-episode set starts to rise after the is-
chemia onset, while for the periodic- and sporadic-episode
sets the hear t rate starts to rise before ischemia onset. For the
entire record, during the intervals B
3−0
and I
0−3
, the heart
rate for the salvo-episode set significantly differs from that
of the sporadic-episode set (t test: P<.001 in both cases).
During the day interval and for the entire record, the heart
rate for the sporadic-episode set significantly changes over
intervals prior to and during ischemia (one-way ANOVA:
P<.001 in both cases). The significant differenc es in aver-
age heart rates for salvo- and sporadic-episode sets indicate
that the ischemia in both groups might be triggered by differ-
ent mechanisms. In addition, the significant change in heart
rate before and during ischemia for sporadic-episode set in-
dicates that ischemia in this set could be caused by physical
exertion.
Figure 6 shows aggregate average normalized LF pow-
ers for the sets during intervals of records and for the en-
tire record before and during ischemia. Generally, the high-
est LF power during intervals of records and for the entire
record is exhibited for the salvo-episode set, while the low-
est LF power is exhibited for the sporadic-episode set. For all
the sets during intervals of records and for the entire record,
the LF power drops at the ischemia onset as compared to
the interval prior to ischemia, except for the salvo-episode
set dur ing the night interval. The greatest changes of the LF
power appear during the morning interval for all the sets,
and also during the night interval for the sporadic-episode
set. (Note that there are only two episodes present in this
set during the night interval.) In the day interval and for the
entire record, the LF power for the salvo-episode set signif-
icantly differs from that of the sporadic-episode set during
the intervals B
3−0
(t test: P<.001 in both cases) and I
0−3
(t test: P<.001 in both cases), indicating different sympa-
thetic activity in both sets, which might be explained with
different mechanisms. During the day interval and for the
entire record, the LF power for the sporadic-episode set sig-
nificantly changes over intervals prior to and during ischemia
(one-way ANOVA: P<.001 in both cases).
Figure 7 shows aggregate average normalized HF pow-
ers for the sets during intervals of records and for the en-
tire record, before and during ischemia. During the in-
tervals of records and for the entire record, the salvo-
episode set exhibits generally the highest HF power, while
6 EURASIP Journal on Advances in Signal Processing
50
75
100
125
Heart rate (bpm)
B
6−3
B
3−0
I
0−3
I
Morning
Salvo
Periodic
Sporadic
(a)
50
75
100
125
Heart rate (bpm)
B
6−3
B
3−0
I
0−3
I
Day
Salvo
Periodic
Sporadic
P<.005 (t, B
3−0
,Sa,Sp)
P<.005 (t, I
0−3
,Sa,Sp)
P<.001 (ANOVA, Sp)
(b)
50
75
100
125
Heart rate (bpm)
B
6−3
B
3−0
I
0−3
I
Night
Salvo
Periodic
Sporadic
P<.005 (t, I
0−3
, Sa, P)
P<.01 (ANOVA, P)
(c)
50
75
100
125
Heart rate (bpm)
B
6−3
B
3−0
I
0−3
I
Entire record
Salvo
Periodic
Sporadic
P<.001 (t, B
3−0
,Sa,Sp)
P<.001 (t, I
0−3
,Sa,Sp)
P<.01 (t, I
0−3
, Sa, P)
P<.001 (ANOVA, Sp)
(d)
Figure 5: Aggregate average hear t rates for the sets during intervals of records and for the entire record before and during ischemia. Vertical
bars indicate aggregate average standard deviations within the intervals B
6−3
(from 6 minutes to 3 minutes prior to ischemia), B
3−0
(from 3
minutes pri or to ischemia to ischemia onset), I
0−3
(first 3 minutes of ischemia), and I (during ischemia). Sa indicates salvo-episode set, P
indicates periodic-episode set, Sp indicates sporadic-episode set. t indicates Student t test over indicated interval for indicated sets. ANOVA
indicates one-way ANOVA for the indicated group over intervals B
6−3
, B
3−0
, I
0−3
,andI.
the sporadic-episode set exhibits genera lly the lowest HF
power. During the morning and day interval, and for the
entire record, the HF power for all sets slightly drops at
the beginning of ischemia as compared to the interval prior
to ischemia onset, except for the salvo-episode set during
the morning interval, when HF power remains unchanged.
During the night interval, the HF power for the salvo- and
periodic-episode sets slightly rises at the beginning of is-
chemia as compared to the interval prior to ischemia on-
set, while for the sporadic-episode set the HF power drops.
During the day interval and for the entire record, the HF
power for the salvo-episode set significantly differs from that
of the sporadic-episode set during the intervals B
3−0
(t test:
P<.001 and P<.01, resp.) and I
0−3
(t test: P<.001 in
A. Smrdel and F. Jager 7
0
0.1
0.2
Normalized power
B
6−3
B
3−0
I
0−3
I
Morning
Salvo
Periodic
Sporadic
(a)
0
0.1
0.2
Normalized power
B
6−3
B
3−0
I
0−3
I
Day
Salvo
Periodic
Sporadic
P<.001 (t, B
3−0
,Sa,Sp)
P<.001 (t, B
3−0
,P,Sp)
P<.001 (t, I
0−3
,Sa,Sp)
P<.005 (t, I
0−3
,P,Sp)
P<.005 (ANOVA, P)
P<.001 (ANOVA, Sp)
(b)
0
0.1
0.2
Normalized power
B
6−3
B
3−0
I
0−3
I
Night
Salvo
Periodic
Sporadic
(c)
0
0.1
0.2
Normalized power
B
6−3
B
3−0
I
0−3
I
Entire record
Salvo
Periodic
Sporadic
P<.001 (t, B
3−0
,Sa,Sp)
P<.005 (t, B
3−0
,P,Sp)
P<.001 (t, I
0−3
,Sa,Sp)
P<.001 (t, I
0−3
,P,Sp)
P<.001 (ANOVA, Sp)
(d)
Figure 6: Aggregate average normalized LF powers for the sets during intervals of records and for the entire record before and during
ischemia. Vertical bars indicate aggregate average standard deviations within the intervals prior to and during ischemia. (For the legends, see
caption of Figure 5.)
both cases), indicating different vagal activities in both sets,
which could be explained by different mechanisms involved
in triggering the ischemia. During the day interval and for
the entire record, the HF power for the sporadic-episode set
significantly changes over intervals prior to and during is-
chemia (one-way ANOVA: P<.001 in both cases). These re-
sults, together with the results for the LF power for sporadic-
episode set, indicate that ischemia in sporadic-episode set
would seem to be characterized by a high degree of variabil-
ity, which is consistent with observations in [ 12 ], while is-
chemia in salvo-episode set does not exhibit such degree of
variability.
4. DISCUSSION
The time- and frequency-domain results, obtained using 24-
hour annotated records of the LTST DB, support our hypoth-
esis, that the sporadic ischemic episodes appear due to phys-
ical exertion, while the salvos of ischemic episodes are result
of coronary vasoconstrictions and vasospasms.
8 EURASIP Journal on Advances in Signal Processing
0
0.1
0.2
Normalized power
B
6−3
B
3−0
I
0−3
I
Morning
Salvo
Periodic
Sporadic
(a)
0
0.1
0.2
Normalized power
B
6−3
B
3−0
I
0−3
I
Day
Salvo
Periodic
Sporadic
P<.001 (t, B
3−0
,Sa,Sp)
P<.01 (t, B
3−0
,P,Sp)
P<.001 (t, I
0−3
,Sa,Sp)
P<.001 (ANOVA, Sp)
(b)
0
0.1
0.2
Normalized power
B
6−3
B
3−0
I
0−3
I
Night
Salvo
Periodic
Sporadic
(c)
0
0.1
0.2
Normalized power
B
6−3
B
3−0
I
0−3
I
Entire record
Salvo
Periodic
Sporadic
P<.01 (t, B
3−0
,Sa,Sp)
P<.001 (t, I
0−3
,Sa,Sp)
P<.001 (ANOVA, Sp)
(d)
Figure 7: Aggregate average normalized HF powers for the sets during intervals of records and for the entire record before and during
ischemia. Vertical bars indicate aggregate average standard deviations within the intervals prior to and during ischemia. (For the legends, see
caption of Figure 5.)
Results show that the records in the salvo-episode set
have generally lower heart rate and standard deviation com-
pared to the records in the sporadic-episode set. We also ob-
served a notable increase of the heart rate prior to ischemia
onset for the sporadic-episode set which indicates that the
heart rate starts to increase in response to physical exertion in
order to satisfy increased oxygen demand, and only after that
ischemia occurs. For the salvo-episode set, we observed only
slight increase in the heart rate before ischemia onset indicat-
ing that ischemia in this set is not a result of increased phys-
ical exertion (increase in oxygen demand), but is rather a re-
sult of insufficient oxygen supply, which might occur due to
vasospasms and vasoconstrictions. For the sporadic-episode
set, the heart rate statistically significantly rises at the begin-
ning of an ischemic episode compared to the interval prior to
ischemia onset (in the day interval and for the entire record),
A. Smrdel and F. Jager 9
while the increase in the heart rate for the salvo-episode set is
not significant, also indicating that ischemia in this set is not
a result of physical exertion. Slight increase in heart rate for
the salvo-episode set might be interpreted as an attempt to
increase the blood supply to a heart muscle by an increase in
heart rate. Interestingly, the records in the periodic-episode
set exhibit similar changes of the heart rate before and dur-
ing ischemia as the sporadic-episode set, but the heart rate in
these intervals is much lower (the heart rate for the periodic-
episode set is approximately from 3.5 to 18 beats per minute
lower than it is for the spor adic-episode set), while the heart
rate during the day and night intervals and during the entire
record is higher than it is for the sporadic-episode set. The
time-domain results also show that in all sets, the incidence
of ischemia is the largest during the morning interval, and
the lowest during the night interval, which is in agreement
with observations in [13, 14]. This indicates a much greater
risk of ischemia in the morning interval than during other in-
tervals of day, a nd might be attributed to the lower ischemia
threshold during the morning interval [15].
The frequency-domain results show change of the LF
power (sympathetic activity) for the sporadic-episode set be-
fore the ischemia onset and significant change of the LF
power at the beginning of ischemia compared to the interval
immediately prior to ischemia onset (except during the night
interval when only two episodes app e ared in the sporadic-
episode set). For the HF power (vagal activity), we observed
smaller changes in intervals before and during ischemia espe-
cially for the salvo-episode set, while for the sporadic-episode
set we observed significant decrease in ac tivity at the be-
ginning of ischemia as compared to the interval immedi-
ately prior to ischemia onset during the day interval and for
the entire record. The results regarding sympathetic and va-
gal activities in our study seem in agreement with several
previous studies [14, 16, 17], which also described marked
changes in sympathetic and/or vagal activity during the is-
chemia.
Examination of the prior clinical information for the pa-
tients showed that all the patients, whose records were in-
serted in the salvo-episode set, had a Prinzmetal’s angina
(four of them had also a coronary artery disease). The pa-
tients, whose records were inserted in the periodic-episode
set, had mostly coronary artery disease, usually in combi-
nation with other diseases. The majority of the patients,
whose records were inserted in the sporadic-episode set,
had a coronary artery disease (22 of 24, one of those 22
had also a Prinzmetal’s angina), one patient in this set suf-
fered f rom syndrome X and one had palpitations. Regard-
ing this, we may conclude that the salvo patterns usually ap-
pear in patients with severe cases of heart disease, such as
Prinzmetal’s angina, while sporadic patterns appear in pa-
tients with milder forms of h eart disease, such as coronary
artery disease.
The patophysiology of ischemia triggered by vasospasms
or mental stress is difficult to describe. One possible explana-
tion is that during the postexcitation phase, the blood pres-
sure may drop abruptly and recovery of heart rate and con-
tractility may be delayed. We may further speculate that pe-
riodic platelet adhesion and breakoff may account for re-
current vasospasms. Also a recent study suggests that vagal
withdrawal precedes the onset of mental stress-induced is-
chemia [18]. On the other hand, the patophysiology of the
ischemia triggered by the exertion is easier to descr i be. Usu-
ally, the ischemia is preceded by an increase in heart r a te due
to physical exertion and an increase (morning and night in-
tervals) in sympathetic activ ity. In this settings, we would
expect increased contractility, blood pressure, metabolic de-
mand, and ischemia, instead of local coronar y vasodilation
and increased coronary flow. In addition, ischemia also acti-
vates complex pressor and depressor reflexes, which may alter
sympathetic and vagal inputs to the cardiovascular control
system. The sympathovagal behavior in the sporadic-episode
set is consistent with the patophysiology of effort angina.
One of the limitations of this study is the determination
of the time, when patient was asleep. For the reliability of the
correct determination of the night interval, we would require
the diary of activities. Since this information is not available
within the LTST DB, we had to rely on empirical knowledge
of heart rate changes, body position changes, and noise in
signal. We also used the data about time when the record-
ing was started, which is available in the LTST DB, to verify
that the time, when patient was asleep, was plausible. Also,
our results regarding changes of heart rate during intervals of
records show significantly lower h eart rates during the night
interval as compared to day and morning intervals, suggest-
ing that the night interval (time when patient was asleep)
was determined correctly. Nevertheless, the existence of the
diary of activities would be beneficial in validating our tech-
nique for determination of night interval. The other limita-
tion is a small number of records. Although our study in-
cluded great number of ischemic episodes (625), not all in-
tervals of the records were well represented. During the night
interval, there were only two ischemic episodes for sporadic-
episode set, which does not enable statistical interpretation.
To further strengthen our findings, more records w ith dis-
tinct temporal patterns should be included in the future, al-
though the sporadic-episode set probably would not contain
much more records during the night interval when there is
no physical activity.
5. CONCLUSIONS
Using the 24-hour records from the LTST DB, we tested
the hypothesis that different physiologic mechanisms are
responsible for different temporal patterns of ischemic
episodes. The obtained results lead us to conclude that dif-
ferent mechanisms are responsible for salvo and for spo-
radic patterns of ischemic episodes, namely, that physical ex-
ertion causes sporadic patterns, while vasospasms and vaso-
constrictions cause salvo patterns.
In this study, we assumed that only neurogenic fac tors
affect coronary regulation. In acute spastic angina, local en-
dothelial factors also regulate and modify blood flow [19].
This additional factors may result in modified response. Due
to those factors, it may be inappropriate to describe the pato-
physiology of the salvo-episode set only in terms of sympa-
thovagal influence.
10 EURASIP Journal on Advances in Signal Processing
REFERENCES
[1] T. C. Andrews and P. H. Stone, “Recent developments in the
understanding and management of angina pectoris in patients
with stable coronary artery disease,” Current Opinion in Car-
diology, vol. 6, no. 4, pp. 503–510, 1991.
[2] A. A. Quyyumi, “Current concepts of pathophysiology, cir-
cadian patterns, and vasoreactive factors associated with my-
ocardial ischemia detected by ambulatory electrocardiogra-
phy,” Cardiology Clinics, vol. 10, no. 3, pp. 403–415, 1992.
[3]F.Jager,G.B.Moody,andR.G.Mark,“Characterizationof
transient ischemic and non-ischemic ST segment changes,” in
Proceedings of 22th Annual Meeting on Computers in Cardiol-
ogy, pp. 721–724, Vienna, Austria, September 1995.
[4] A. Taddei, G. Distante, M. Emdin, et al., “The European ST-
T database: standard for evaluating systems for the analysis of
ST-T changes in ambulatory electrocardiography,” European
Heart Journal, vol. 13, no. 9, pp. 1164–1172, 1992.
[5] F.Jager,G.B.Moody,G.Antoli
ˇ
c, D. Ma
ˇ
si
ˇ
c, and R. G. Mark,
“Sympatho-vagal correlates of transient ischemia in ambula-
tory patients,” in Proceedings of 24th Annual Meeting on Com-
puters in Cardiology, pp. 387–390, Lund, Sweden, September
1997.
[6] F. Jager, A. Taddei, G. B. Moody, et al., “Long-term ST
database: a reference for the development and evaluation of
automated ischaemia detectors and for the study of the dy-
namics of myocardial ischaemia,” Medical and Biological Engi-
neering and Computing, vol. 41, no. 2, pp. 172–182, 2003.
[7] A. Smrdel and F. Jager, “Diurnal changes of heart rate and
sympatho-vagal activity for temporal patterns of transient is-
chemia,” in Proceedings of 32th Annual Meeting on Computers
in Cardiology, pp. 857–860, Lyon, France, September 2005.
[8] A. M. Bianchi, L. Mainardi, E. Petrucci, M. G. Signorini, M.
Mainardi, and S. Cerutti, “Time-variant power spectrum anal-
ysis for the detection of transient episodes in HRV signal,”
IEEE Transactions on Biomedical Engineering,vol.40,no.2,pp.
136–144, 1993.
[9] M. Akay, Biomedical Signal Processing, Academic Press, San
Diego, Calif, USA, 1994.
[10] A. G. Bluman, Elementary Statistics: A Brief Version,MacGraw-
Hill, New York, NY, USA, 3rd edition, 2006.
[11] W. H. Press, S. A. Teukolsky, W. T. Vetterling, and B. P. Flan-
nery, Numerical Recipes in C++, the Art of Scientific Com-
puting, Cambridge University Press, Cambridge, Mass, USA,
2nd edition, 2002.
[12] L. G. Gamero, J. Vila, and F. Palacios, “Wavelet transform anal-
ysis of heart rate var iability during mycardial ischaemia,” Med-
ical and Biological Engineering and Computing,vol.40,no.1,
pp. 72–78, 2002.
[13] J. D. Parker, M. A. Testa, A. H. Jimenez, et al., “Morning in-
crease in ambulatory ischemia in patients with stable coronary
artery disease: importance of physical activity and increased
cardiac demand,” Circulation, vol. 89, no. 2, pp. 604–614, 1994.
[14]A.J.vanBoven,J.Brouwer,H.J.G.M.Crijns,J.Haaksma,
and K. I. Lie, “Differential autonomic mechanisms underlying
early morning and daytime transient myocardial ischaemia
in patients with stable coronary artery disease,” British Heart
Journal, vol. 73, no. 2, pp. 134–138, 1995.
[15] A.A.Quyyumi,J.A.Panza,J.G.Diodati,E.Lakatos,andS.E.
Epstein, “Circadian variation in ischemic threshold: a mech-
anism underlying the circadian variation in ischemic events,”
Circulation, vol. 86, no. 1, pp. 22–28, 1992.
[16] Y. Goseki, T. Matsubara, N. Takahashi, T. Takeuchi, and C.
Ibukiyama, “Heart rate variability before the occurrence of
silent myocardial ischemia during ambulatory monitoring,”
American Journal of Cardiology, vol. 73, no. 12, pp. 845–849,
1994.
[17] S. Cerutti, A. M. Bianchi, and L. T. Mainardi, “Advanced spec-
tral methods for detecting dynamic behaviour,” Autonomic
Neuroscience: Basic and Clinical, vol. 90, no. 1-2, pp. 3–12,
2001.
[18] W. J. Kop, R. J. Verdino, J. S. Gottdiener, S. T. O’Leary, C. N.
Bairey Merz, and D. S. Krantz, “Changes i n heart rate and
heart rate variability before ambulatory ischemic events,”
Jour-
nal of the American College of Cardiology, vol. 38, no. 3, pp.
742–749, 2001.
[19] B. D. Bertolet and C. J. Pepine, “The vascular endothelium as a
key to understanding coronary spasm and syndrome X,” Cur-
rent Opinion in Cardiology, vol. 6, no. 4, pp. 496–502, 1991.
A. Smrdel received B.S., M.S., and Ph.D. de-
grees in computer and information science
from the University of Ljubljana, Ljubl-
jana, in 1997, 2000, and 2004, respectively.
Between 1997 and 2000, he was a young
researcher, and since 2001 he has been
an Assistant in the Faculty of Computer
and Information Science at the University
of Ljubljana. His research interests include
biomedical signal processing and other re-
lated topics.
F. Jager received a B.S. degree and an M.S.
degree in electrical engineering from the
University of Ljubljana in 1980 and 1984,
respectively. In 1994, he received a Ph.D. de-
gree in computer and information science
from the University of Ljubljana. Currently,
he is a Full Professor in the Faculty of Com-
puter and Information Science at the Uni-
versity of Ljubljana, and a Research Affili-
ate at the Massachusetts Institute of Tech-
nology. His research interests include biomedical signal processing
and medical imaging.