Báo cáo hóa học: " Research Article Detection of Disturbances in Voltage Signals for Power Quality Analysis Using HOS" ppt
Bạn đang xem bản rút gọn của tài liệu. Xem và tải ngay bản đầy đủ của tài liệu tại đây (1.88 MB, 13 trang )
Hindawi Publishing Corporation
EURASIP Journal on Advances in Signal Processing
Volume 2007, Article ID 59786, 13 pages
doi:10.1155/2007/59786
Research Article
Detection of Disturbances in Voltage Signals for
Power Quality Analysis Using HOS
Mois
´
es V. Ribeiro,
1
Cristiano Augusto G. Marques,
1
Carlos A. Duque,
1
Augusto S. Cerqueira,
1
and Jos
´
e Luiz R. Pereira
2
1
Department of Electrical Circuit, Federal University of Juiz de Fora, 36 036 330 Juiz de Fora, MG, Brazil
2
Department of Electrical Energy, Federal University of Juiz de Fora, 36 036 330 Juiz de Fora, MG, Brazil
Received 1 May 2006; Accepted 4 February 2007
Recommended by M. Reza Iravani
This paper outlines a higher-order statistics (HOS)-based technique for detecting abnormal conditions in voltage signals. The main
advantage introduced by the proposed technique refers to its capability to detect voltage disturbances and their start and end
points in a frame whose length corresponds to, at least, N
= 16samplesor1/16 of the fundamental component if a sampling rate
equal to f
s
= 256 × 60 Hz is considered. This feature allows the detection of disturbances in submultiples or multiples of one-cycle
fundamental component if an appropriate sampling rate is considered. From the computational results, one can note that almost
all abnormal and normal conditions are correctly detected if N
= s256, 128, 64, 32, and 16 and the SNR is higher than 25 dB. In
addition, the proposed technique is compared to a root mean square (rms)-based technique, which was recently de veloped to detect
the presence of some voltage events as well as their sources in a frame whose length ranges from 1/8 up to one-cycle fundamental
component. The numerical results reveal that the proposed technique shows an improved performance when applied not only to
synthetic data, but also to real one.
Copyright © 2007 Mois
´
es V. Ribeiro et al. This is an open access article distributed under the Creative Commons Attribution
License, which permits unrestricted use, distribution, and reproduction in any medium, provided the original work is properly
cited.
1. INTRODUCTION
The increasing pollution of power line signals and its impact
on the quality of power delivery by electrical utilities to end
users are pushing forward the development of signal process-
ing tools to provide several functionalities, among them it is
worth mentioning the following ones [1]: (i) disturbances
detection, (ii) disturbances classification, (iii) disturbance
sources identification, (iv) disturbance sources localization,
(v) transients analysis, (vi) fundamental, harmonic, and in-
terharmonic parameters estimations, (vii) disturbances com-
pression, (viii) signal segmentation, and so forth.
Regarding the powe r quality (PQ) monitoring needs, one
can note that the detection of disturbances as well as their
start and end points in electric signals is a very important is-
sue to upcoming generation of PQ monitoring equipment.
In fact, the detection technique has to present good perfor-
mance under different sampling rates, frame lengths rang-
ing from submultiples up to multiples of power frequency
cycle and varying signal-to-noise ratio (SNR) conditions.
Therefore, for those interested in disturbance analysis, one of
the first and most important function of a monitoring equip-
ment is to provide a real-time and reliable detection of dis-
turbances to facilitate their further characterization. In addi-
tion, the detection technique has to be capable of recognizing
short-time and long-time disturbances with high detection
rate.
Additionally, it is worth mentioning that PQ equipment
for detecting events and variations has to activate the distur-
bance tracking so that the portion of the signal including the
disturbance is the only segment processed. As a result, a re-
liable detection of disturbances as well as the their localiza-
tions in the power line signals facilitate the design and u se of
classification, compression, identification, signal representa-
tion, and parameters estimation to provide a comprehensive
analysis of voltage disturbances.
The necessity of improved detection performance for
continuous monitoring of electric signals has motivated the
development of several techniques that show a good trade-off
between computational complexity and performance [2–13].
In fact, the correct detection of disturbances in voltage sig-
nals as well as their start and end points can provide relevant
2 EURASIP Journal on Advances in Sig nal Processing
information to characterize the PQ disturbances and, maybe,
their sources.
In this regard, a great deal of attentions has been drawn
toward wavelet transform-based technique for detection pur-
pose. However, recent results have indicated that wavelet
transform-based techniques are very sensitive to the presence
high power background noise [14]. Another very interesting
techniques are the ones that make use of second-order infor-
mation of the error signal, which is the result of the subtrac-
tion of the fundamental component from the electric signal,
for detection purpose. The analysis of the error signal is at-
tractive and interesting solution to characterize the presence
of disturbances as discussed in [2, 4, 5, 8]. Among these tech-
niques, one can point out that the technique introduced in
[2] is, at the first sight, a very interesting solution because it
makes use of the innovation concept applied to the Kalman
filtering formulation [15] and, as a consequence, it demands
low computational cost and attains good performance if at
least one-cycle fundamental component is considered.
The techniques proposed in [2, 4, 5, 8] are very similar in
the sense that all of them make use of second-order statistics
of the error signal to detect the occurrence of disturbances.
Analyzing [ 2, 8], one notes that the advantage of the former
technique resides on the fact that it is a more sophisticated
technique than the latter one. However, it is worth men-
tioning that the second-order statistics are very sensitive to
the presence of Gaussian noise that usually models the back-
ground noise in voltage signals [1, 2]. As a result, the use of
such statistics could not be appropriate for those cases where
the power of background noise is high. On the other hand,
the use of higher-order statistics (HOS) such as cumulants is
very interesting, because the y are insensitive to the presence
of Gaussian noise [16, 17].
This paper introduces a technique based on HOS having
the following advantages: (i) it is more insensitive to the pres-
ence of background noise modeled as a Gaussian than previ-
ous techniques developed so far; (ii) it is capable of detect-
ing the occurrence of disturbances in frames whose lengths
correspond to at least N
= 16 samples, independent of the
choice of the sampling rate; and (iii) it pinpoints the start
and end points of the detected events. As a result, the pro-
posed technique could be used in noisy scenarios and situ-
ations where the detection of disturbances in frames whose
lengths correspond to submultiples or multiples of one-cycle
fundamental component is needed. Simulation results ver-
ify that the proposed technique is capable of providing im-
proved detection rate when applied to synthetic and real data.
This technique was partially introduced in [ 18 ].
The paper is organized as follows. Section 2 formulates
the detection problem. Section 3 presents the proposed tech-
nique for disturbance detection. Section 4 presents some
numerical results about the performance and applicability
of the proposed technique. Finally, concluding remarks are
stated in Section 5.
2. PROBLEM FORMULATION
The discrete version of monitored power line signals are di-
vided into nonoverlapped frames of N samples and the dis-
crete sequence in a frame can be expressed as an additive con-
tribution of several types of phenomena
x( n)
= x(t)|
t=nT
s
:= f (n)+h(n)+i(n)+t(n)+v(n),
(1)
where n
= 0, , N − 1, T
s
= 1/f
s
is the sampling period, the
sequences
{ f (n)}, {h(n)}, {i(n)}, {t(n)},and{v(n)} denote
the power supply signal (or fundamental component), har-
monics, interharmonics, transient, and background noise,
respectively. Each of these signals is defined as fol lows:
f (n):
= A
0
(n)cos
2π
f
0
(n)
f
s
n + θ
0
(n)
,(2)
h(n):
=
M
m=1
h
m
(n), (3)
i(n):
=
J
j=1
i
j
(n), (4)
t(n):
= t
spi
(n)+t
not
(n)+t
cas
(n)+t
dae
(n), (5)
and v(n) is independently and identically distributed (i.i.d.)
noise as normal N (0, σ
2
v
) and independent of { f (n)},
{h(n)}, {i(n)},and{t(n)}.
In (2), A
0
(n), f
0
(n), and θ
0
(n) refer to the magnitude,
fundamental frequency, and phase of the power supply sig-
nal, respectively. In (3), h
m
(n)andi
j
(n) are the mth har-
monic and the jth interharmonic, respectively, which are de-
fined as
h
m
(n):= A
m
(n)cos
2πm
f
0
(n)
f
s
n + θ
m
(n)
,(6)
i
j
(n):= A
I, j
(n)cos
2π
f
I, j
(n)
f
s
n + θ
I, j
(n)
. (7)
In (6), A
m
(n) is the magnitude and θ
m
(n) is the phase of
the mth harmonic. In (7), A
I, j
(n), f
I, j
(n), and θ
I, j
(n) are the
magnitude, frequency, and phase of the jth interharmonic,
respectively. In (5), t
spi
(n), t
not
(n), t
dec
(n), and t
dam
(n)repre-
sents transients named spikes, notches, decaying oscillations,
and damped exponentials. These transients are expressed by
t
spi
(n):=
N
spi
i=1
t
spi,i
(n), (8)
t
not
(n):=
N
not
i=1
t
not,i
(n), (9)
t
dec
(n):=
N
dec
i=1
A
dec,i
(n)cos
ω
dec,i
(n)n + θ
dec,i
(n)
×
exp
−
α
dec,i
n − n
dec,i
,
(10)
t
dam
(n):=
N
dam
i=1
A
dam,i
(n)exp
−
α
dam,i
n − n
dam,i
, (11)
respectively, where t
spi,i
(n)andt
not,i
(n) are the nth samples of
the ith transient named spike or notch. Note that (10)refers
to the capacitor switchings as well as signals resulted from
Mois
´
es V. Ribeiro et al. 3
faulted waveforms. Equation (11) defines the decaying expo-
nential as well as direct current (DC) components (α
dam
= 0)
generated as a results of geomagnetic disturbances, and so
forth.
The following definitions are used in this contribution:
(i) the vector x
= [x(n) ···x(n − N +1)]
T
is composed
of samples from the signal expressed by (1); (ii) the vector
f
= [ f (n) ··· f (n − N +1)]
T
is constituted by estimated
samples from the signal expressed by (2); (iii) the vector
v
= [v(n) ···v(n − N +1)]
T
is the additive noise vector;
and (iv) u
= h + i+t = [u(n) ···u(n−N +1)]
T
is composed
of the vectors formed by samples of the signals represented
by (3)–(5).
The detection of disturbances in the vector x can be for-
mulated as the decision between two hypotheses [19–21],
H
0
: x = f
ss
+ v ,
H
1
: x = f
ss
+ Δf
ss
+ u + v,
(12)
where hypothesis H
0
refers to normal conditions of voltage
signals and hypothesis H
1
is related to abnormal conditions
in voltage signals. In (12), the vector Δf
ss
represents a sud-
den variation in the fundamental component and the vector
f
ss
denotes the steady-state component of the fundamental
component. Finally, the vector u refers to the occurrence of
disturbances in the voltage signals whose components do not
appear in the fundamental component.
Supposing that L is the length of the disturbance and
N>L, one can assume that x
= f
ss
+ Δf
ss
+ u + v =
[x(n) ···x(n−N +1)]
T
, u+Δf
ss
= [0
T
d
,(u+Δf
ss
)
T
L
, 0
T
N
−L−d
]
T
,
and (u + Δf
ss
)
L
= [u(n+d)+Δ f
ss
(n+d) ···u(n+d+L− 1)+
Δ f
ss
(n+d +L−1)]
T
is the disturbance vector. 0
m
is a column
vector with m elements equal to zero. d and d+L are start and
end points of the disturbance in the N-length frame. Based
on this formulation, the disturbance occurrence interval is
denoted by
Ψ(n)
= μ(n − d) − μ(n − d − L), (13)
where μ(n) is a unit step function.
The disturbance detection process involves several vari-
ables that depend on the kind of application. For instance,
the starting point d could be known or not; the duration L
could be available or not; the wave shape of the disturbance
(u + Δf
ss
)
L
can be known, partial ly known, or completely un-
known [19, 22, 23]. In this context, H
0
is a simple hypothesis
and H
1
is a composite hypothesis.
From the detection theory, it is known that if the back-
ground noise v is additive, i.i.d., and its elements are Gaus-
sian random variables with known parameters, then the gen-
eralized likelihood ratio test (GLRT) is the classical process
which assumes the form of a matched filter [19–21, 24].
However, the evaluation of such technique demands high
computational complexity. One can note that if the back-
ground noise v is not Gaussian, then the evaluation of the
GLRT presents additional computational complexity even
for off-line applications [19–22].
Analyzing the vector v, one can note that this signal usu-
ally is modeled as an i.i.d. random process in which the
elements present an Gaussian probability density function
(p.d.f.). Therefore, the use of second-order statistics to an-
alyze the occurrence of disturbances can severely degrade the
detection performance if the power of v is high. Another very
important concern resides on the fact that if the vector v nei-
ther is an i.i.d. random process nor a Gaussian one, then the
use of second-order statistics can be very unreliable to extract
qualitative information if the power of the Gaussian noise is
high.
On the other hand, the use of higher-order statistics
(HOS) based on cumulants seems to be a very promis-
ing approach for disturbance detection in voltage signals
because they are more appropriate for dealing with Gaus-
sian signals. In fact, the cumulants are blind to any kind of
Gaussian process, whereas second-order information is not.
Then, cumulant-based signal processing techniques can han-
dle colored Gaussian noise automatically, whereas second-
order techniques may not. Therefore, cumulant-based tech-
niques boost signal-to-noise ratio when electric signals are
corrupted by Gaussian noise [17].
Additionally, the higher-order-based cumulants provide
more relevant information from the random process. The
use of such relevant information for detection purpose and
other applications such as parameters estimation and classi-
fication have b een successfully investigated in several appli-
cations [16, 17, 23–25] which are not related to power sys-
tems. Based on this discussion and assuming that v, f,andu
carry out relevant information from the disturbance occur-
rence, then the hypotheses stated in (12) are reformulated as
follows:
H
0
: u = v
u
,
H
1
: f = f
ss
+ v
f
,
H
2
: u = h + i + t + v
u
,
H
3
: f = f
ss
+ Δf
ss
+ v
f
,
(14)
where v
= v
u
+ v
f
. The hypotheses formulation introduced
in (14) emphasizes the need to analyze abnormal events
through the so-called primitive components of voltage sig-
nals that are represented by the vectors f and u. While the hy-
potheses H
0
and H
1
are related to normal conditions of such
voltage signal components, the hypotheses H
2
and H
3
are as-
sociated with abnormal conditions in these components.
Equation (14) means that we are looking for some kind
of abnormal behavior in one or two primitive components of
x so that a decision about disturbance occurrences is accom-
plished. This concept is ver y attractive, because the vectors
f
ss
+Δf
ss
+v
f
and h+i+t+v
u
can reveal insightful and different
information from the voltage signals. These information not
only leads to efficient and simple detection technique, but
also contribute to the development of very promising com-
pression, classification, and identification techniques for PQ
applications [1].
In Section 3, the high-order statistics-based technique
that implements (14)todetectabnormaleventsaswellas
their start and end points in frame composed of a reduced
number of samples is introduced.
4 EURASIP Journal on Advances in Sig nal Processing
3. PROPOSED TECHNIQUE
As far as disturbance detection is concerned, a n important
issue that have come to our attention is the fact that all de-
tection techniques presented so far do not address the prob-
lem of the minimum number of samples, N
min
, needed to de-
tect with high performance the occurrence of disturbances.
In fact, the development of techniques based on this premise
is interesting in the sense that for a given N
min
, it is possible
to design a detection technique capable of achiev ing a high
detection rate independent of the sampling rate, f
s
.
Then, by using an appropriate sampling rate, it w ill be
possible to detect disturbances in frames whose lengths cor-
respond to multiples or submultiples of one-cycle funda-
mental component. The detection technique proposed in [3]
is the only one that tried to detect a reduced set of distur-
bances as well as their correspondence to disturbance sources
inframeswhoselengthsrangefrom1/8uptoone-cyclefun-
damental component. And, as very well reported, it is an in-
teresting technique to the set of selected disturbances con-
sideredin[3]. However, this technique could not be an at-
tractive if the disturbance set is comprised of a large number
of disturbances. The numerical results, which are obtained
with synthetic and real voltage waveforms and are reported in
Section 4, are in support of this statement. One has to note
that our statement, by no means, invalidate the applicabil-
ity of this technique for its intentional use as addressed in
[3]. In fact, we are just attempting to highlight the fact that
the only one technique introduced s o far to identify distur-
bance source from the detected disturbances in submultiples
of one cycle of the fundamental component is the only avail-
able technique that could be considered for comparison w ith
the proposed technique.
We call attention to the fact that the technique discussed
in this section allows detection rates very close to 100% if
SNR is higher than 25 dB and the number of samples in the
vector x is higher than 16, see simulation results in Section 4.
As a result, the proposed technique can be applied to de-
tect a large number of disturbances ranging from variations
to high-frequency content events if an appropriate sampling
rate is taken into account. For example, if f
s
= 32 × 60 Hz,
then the proposed technique provides a h igh detection rate
when the frame is composed of at least 16 samples, which
correspond to a half-cycle fundamental component. In the
case of f
s
= 512×60 Hz, similar detection rate is attained in a
frame whose length corresponds to at least 1/32 cycles of the
fundamental component. One can note that if this technique
is well designed to a target sampling rate, then it will be ca-
pable of detecting disturbances in a very short-time interval
corresponding to submultiples of one cycle of the fundamen-
tal component.
The disturbance detection in a frame whose length cor-
responds to more than one-cycle fundamental component is
not a novelty. In fact, the novelty is the high detection rate
attained when the frame lengths correspond to submultiples
of one-cycle fundamental component, which is offered by the
proposed technique. Note that the detection capacity of this
technique is improved if the frame lengths corresponding to
Input NF
0
+
−
f (n)
u(n)
Feature
extraction
Detection
algorithm
Yes No
Detected?
Start and end
points
detection
Analyze next
frame
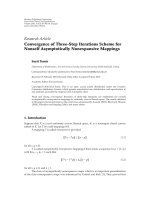
Figure 1: Block diagram of the detection technique of abnormal
conditions.
more than one cycle of the fundamental component are used
because the use of a large number of samples allows a bet-
ter estimation of the HOS-based par ameters. By using the
proposed technique, one is able to design source identifica-
tion and disturbance classification techniques that can use
the transient behavior associated with the detected distur-
bances to classify the disturbances and to identify the possible
disturbance sources for the ongoing disturbance in a short-
time intervals.
To go into detail of the proposed technique, Section 3.1
describes the scheme for detecting disturbances. In sequel,
Section 3.2 details the notch filter. Thereafter, Section 3.3
briefly highlights higher-order statistics and the feature se-
lection technique. Finally, Section 3.4 addresses the detection
algorithm.
3.1. Scheme of proposed technique
The block diagram of the proposed technique for detecting
abnormal conditions in voltage signal is depicted in Figure 1.
The main blocks in this figure are detailed as follows.
(1) Input: this block provides the N-length input vector
x in which the elements are given by (1).
(2) Notch filter: this block implements a second-order
notch filter in which the notch frequency is ω
0
= 2π( f
0
/f
s
).
The main advantage regarding the use of such approach is
that a finite-length implementation of such filter with at least
10 bits is enough to reproduce an approximated infinite pre-
cision notch filter response if f
0
f
s
[26, 27].
(3) Feature extraction: in this block, the selected HOS-
based features named cumulants of second- and fourth-
order are extracted from the vectors f and u to reveal in a
simple way abnormal behaviors in vector x.
(4) Detection algorithm: in this block Bayes detection rule
based on the maximum likelihood (ML) criterion is applied
[20, 21, 28]. The probability density function is the Gaus-
sian or normal density function. The major reasons for the
normal density function use is its computational tractability
and the fact that it modeled very well this detection prob-
lem. Additionally, if there is linear separabilit y among the re-
gions associated with the normal and abnormal conditions
in the vector space of extracted parameters, then linear tech-
nique that efficiently detects the occurrence of disturbances
Mois
´
es V. Ribeiro et al. 5
is implemented. The parameters of the linear technique can
be adaptively obtained by using the least mean square (LMS)
or the recursive least square (RLS) algorithm [29].
(5) Start and end point detection: in this block a simple
procedure, which is capable of informing the start and end
points of a detected abnormal condition in the vector x,is
implemented. The procedure is as follows.
Step 1. Vec tors f(n
− L
f
) = [ f (n − L
f
) ··· f (n − L
f
(i +1)+
1)]
T
and u(n − iL
u
) = [u(n − iL
u
) ···u(n − L
u
(i +1)+1)]
T
are, respectively, composed of samples from f and u vectors,
whose samples are inputs of the feature extraction block.
Note that L
f
and L
u
are lengths of vectors f(n − iL
f
)and
u(n
− iL
u
), respectively, and i = 0, 1,2, 3,
Step 2. HOS-based features are extracted from f(n
−iL
f
)and
u(n
− iL
u
)sequences.
Step 3. The start point of an abnormal event is given by
k
= min
iL
f
, iL
u
, (15)
where iL
f
and iL
u
refer to the vectors f(n−iL
f
)andu(n−iL
u
)
from which the differences between their HOS-based fea-
tures and the HOS-based features extracted from the previ-
ous vectors are greater than a specified threshold.
Step 4. The end point of an abnormal event is given by
j
= max
iL
f
, iL
u
, i ≥ k, (16)
where iL
f
and iL
u
are the end points detected in the f(n−iL
f
)
and u(n
− iL
u
) vectors from which the differences between
their HOS-based features and the HOS-based features ex-
tracted from the previous vectors are g reater than a specified
threshold.
One can note that L
f
L
u
because the abnormal events
related to the fundamental component are slower than the
ones that occur in the error signal component.
(6) Analyze next frame: this block is responsible for ac-
quiring the next frame for detect ion purpose.
3.2. Notch filter structure
The z-transform of a second-order notch filter, whose notch
frequency is ω
0
= 2π( f
0
/f
s
), is expressed by
H
0
(z) =
1+a
0
z
−1
+ z
−2
1+ρ
0
a
0
z
−1
+ ρ
2
0
z
−2
, (17)
where
a
0
=−2cosω
0
(18)
and 0
ρ
0
< 1 is the notch factor.
The feature extraction is performed over the notch filter
output u(n) and from the signal f (n), which is obtained by
the subtraction of u(n) from the input signal x(n). The im-
plementation of notch filter in the δ operator domain is given
by [26, 27],
H
0
(δ) = H
0
(z)|
z=1+Δδ
=
1+α
0,1
δ
−1
+ α
0,2
δ
−2
1+β
0,1
δ
−1
+ β
0,2
δ
−2
, (19)
where
α
0,1
=
2
Δ
1 − cos ω
0
,
α
0,2
=
2
Δ
2
1 − cos ω
0
,
β
0,1
=
2
Δ
1 − ρ
0
cos ω
0
,
β
0,2
=
1+ρ
2
0
− 2ρ
0
cos ω
0
Δ
2
.
(20)
Even though Δ
∈ [0, ∞), usually the value of it is very small,
0 < Δ
1, and carefully chosen for diminishing roundoff
error effects. Although the implementation of a filter in the δ
operator domain demands more computational complexity,
it is very robust to quantization effects.
3.3. High-order statistics
Some contributions have demonstrated that HOS-based
techniques are more appropriate to deal with non-Gaussian
processes and nonlinear systems than second-order-based
ones. Remarkable results regarding detection, classification
and system identification with cumulant-based technique
have been reported in [16, 17, 22, 23, 25]. Assuming that
components f and u of voltage signals are modeled as a non-
Gaussian process, the use of cumulant-based technique ap-
pears to be a very promising approach for detection of ab-
normal behaviors in voltage signals.
The expressions of the diagonal slice of second-, third-,
and fourth-order cumulants of a zero mean vector z,which
is assumed to be f
− E{f} and u − E{u},whereE{·} is the
expectation operator, are expressed by
c
2,z
(i) = E
z(n)z(n + i)
,
c
3,z
(i) = E
z(n)z
2
(n + i)
,
c
4,z
(i) = E
z(n)z
3
(n + i)
−
3c
2,z
(i)c
2,z
(0),
(21)
respectively, where i is the ith lag. Considering z as a finite-
length vector and i
= 0, 1, 2, , N − 1, approximations of
such cumulants are here, for the first time, defined by
c
2,z
(i):=
1
N
N−1
n=0
z(n)z
mod(n + i, N)
,
c
3,z
(i):=
1
N
N−1
n=0
z(n)z
2
mod(n + i, N)
,
c
4,z
(i):=
1
N
N−1
n=0
z(n)z
3
mod(n + i, N)
−
3
N
2
N
−1
n=0
z(n)z
mod(n + i, N)
N−1
n=0
z
2
(n),
(22)
where mod(a, b)isthemodulusoperator,whichisdefinedas
the remainder obtained from dividing a by b. The approxi-
mations presented in (22) lead to a very appealing approach
6 EURASIP Journal on Advances in Sig nal Processing
for problems where one has a finite-length vector from which
higher-order-based features have to be extracted for appli-
cations, such as detection, classification, and identification.
One has to note that the use of mod(
·) operator means that
we are considering that the vector z is an N-length periodic
vector. The reason for this refers to the fact that by using such
very simple assumption, we can evaluate the approximation
of HOS with all available N samples. As a result, the extracted
feature vector is more representative than the feature vector
extracted with a standard approximation of HOS given by
c
2,z
(i) =
2
N
N/2−1
n=0
z(n)z(n + i),
c
3,z
(i) =
2
N
N/2−1
n=0
z(n)z
2
(n + i),
c
4,z
(i) =
2
N
N/2−1
n=0
z(n)z
3
(n + i)
−
12
N
2
N/2
−1
n=0
z(n)z(n + i)
N/2−1
n=0
z
2
(n),
(23)
where i
= 0, , N/2 − 1.
Once the cumulants have been extracted, many different
processing techniques can be applied on HOS-based features
before their use for detection purpose. The motivation for
using different approaches for postprocessing the extracted
HOS-based features resides on the fact that they facilitate the
detection process of abnormal conditions. Note that this is a
heuristic approach that emerged as a result of a careful anal-
ysis of the HOS-based features extracted from many voltage
signals. Although it is a heuristic approach, it is worth stating
that to detect a disturbance what make difference is if the set
of features facilitates or not the detection process.
The HOS-based feature vector extracted from the vector
z, in which the elements are candidates for use in the pro-
posed technique, is given by
p
i
=
c
T
2, f
c
T
3, f
c
T
4, f
c
T
2,u
c
T
3,u
c
T
4,u
T
, i = 1, 2, (24)
where
c
2,z
= [c
2,z
(0) ···c
2,z
(N −1)c
2,z
(0) ···c
2,z
(N/2−1)]
T
,
c
3,z
= [c
3,z
(0) ···c
3,z
(N − 1)c
3,z
(0) ···c
3,z
(N/2 − 1)]
T
,and
c
4,z
= [c
4,z
(0) ···c
4,z
(N − 1)c
4,z
(0) ···c
4,z
(N/2 − 1)]
T
. z de-
notes f and u.In(24), i
= 1andi = 2denotenormaland
abnormal conditions in the vector x.
Aiming at the choice of a representative and finite set of
features from ( 24 ) that provides a good separability between
two distinct conditions that are individually represented by
hypotheses H
0
and H
1
, and hypotheses H
2
and H
3
,asseen
in (14), the use of the Fisher discriminant ratio (FDR) is ap-
plied [28]. The cost vector function of the FDR which leads
to the best separability in a low-dimensional space between
both aforementioned events, is given by
J
c
=
m
1
− m
2
2
1
D
2
1
+ D
2
2
, (25)
where J
c
= [J
1
···J
L
l
]
T
, L
l
is the total number of fea-
tures, m
1
and m
2
,andD
2
1
and D
2
2
are the means and vari-
ances vectors of features vectors p
1,k
, k = 1, 2, , M
p
and
p
2,k
, k = 1,2, , M
p
. M
p
denotes the total number of fea-
ture vectors. The symbol
refers to the Hadarmard product
r
s = [r
0
s
0
···r
L
r
−1
s
L
r
−1
]
T
.
The ith element of the parameter vector, see (25), hav-
ing the highest value, J
c
(i), is selected for use in the detection
technique. Applying this procedure to all elements of the fea-
ture vector, the K parameters associated with the K highest
values of J
c
are selected.
3.4. Detection techniques
From the hypotheses stated in (14), the detection problem
can be viewed as a classification problem, where hypotheses
H
0
and H
1
refer to a classification region R
n
= R
0
R
1
as-
sociated with the normal operation of voltage signal, while
hypotheses H
2
and H
3
are related to classification region
R
a
= R
2
R
3
which refers to abnormal condition. From
the above point of view, numerous classification techniques
can be applied to determine the hyperplane or nonlinear
curves that separate region R
n
from region R
a
,see[30].
By considering this paradigm, the goal is the choice of
well-suited classification techniques w hich lead to a good
trade-off between performance and computational complex-
ity if N
= 256, 128, 64, 32, and 16. By considering the condi-
tional probabilities as a Gaussian ones and assuming that the
Gaussian para meters are estimated from the training data,
then the likelihood ratio test of the maximum likelihood (ML)
criterion is given by
p
X|H
0
,H
1
x | H
0
, H
1
p
X|H
2
,H
3
x | H
2
, H
3
≥
<
π
0
π
1
, (26)
where π
0
= 1/2andπ
1
= 1/2 are the a priori probabilities of
normal and abnormal conditions associated with the voltage
signals.
4. NUMERICAL RESULTS
In this section, the performance of the proposed technique
is evaluated to validate its effectiveness for detecting distur-
bances in voltage signals. In addition, in this section, com-
parison results between the proposed technique and the tech-
nique introduced in [3] is presented.
To evaluate the performance of the proposed technique,
several waveform of voltage signals were synthetically gener-
ated. The generated disturbances are sags, swells, interrup-
tions, harmonics, damped oscillations, notches, and spikes.
The sampling rate considered was f
s
= 256 × 60 samples
per second (sps). Simulation with other sampling rates was
performed, but will not be presented here for the sake of
simplicity. However, it is worth mentioning that similar per-
formance of the proposed technique is verified when f
s
=
32×60 Hz, f
s
= 64×60 Hz, f
s
= 128×60 Hz, f
s
= 512×60 Hz,
f
s
= 1024 × 60, and f
s
= 2048 × 60 Hz if we take into account
N
≥ 16. For the notch filter, ρ
0
= 0.997.
Also, the detection performance of the proposed tech-
nique is verified with measurement data of voltage sig-
nals available from IEEE working group P1159.3 website,
which focused on data file format for power quality data
Mois
´
es V. Ribeiro et al. 7
00.02 0.04 0.06 0.08 0.1
Time (s)
−1
0
1
(a)
00.02 0.04 0.06 0.08 0.1
Time (s)
−1
0
1
(b)
00.02 0.04 0.06 0.08 0.1
Time (s)
−1
0
1
(c)
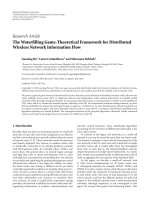
Figure 2: (a) Signal {x(n)},(b)signal{ f (n)}, (c) signal {u(n)}.
interchange. The available voltage measurement were ob-
tained with f
s
= 256 × 60 Hz. The SNR of these data was
estimated to be 40 dB.
For the sake of simplicity, the proposed technique is
named HOS, the techniques introduced in [3]arenamed
RMS 1 and RMS 2. RMS 1 and RMS 2 refer to the detection
techniques based on the rms evaluation with a half and one
cycles of the fundamental component, respectively.
An illustrative example of a voltage signal obtained from
IEEE working group P1159.3 website and considered in this
section is depicted in Figure 2.ItisseenfromFigure 2(a)
the voltage signal expressed by (1), Figure 2(b) shows the ex-
tracted fundamental component added with some kind of
variation represented by
{Δ f
ss
(n)},andFigure 2(c) depicts
the transient component of the voltage signal. From the re-
sult obtained, it can be noted that not only the transient sig-
nal carry out relevant information but also the fundamental
component. This is the reason why the proposed technique
makes use of information from both components for detec-
tion purpose.
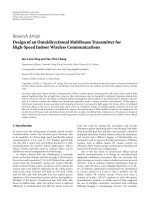
Figures 3–7 show the HOS-based features selected with
the FDR criterion. One has to note these pictures portray the
extracted features when the notch filter and ideal notch filter
are used to decompose the vector x into vectors f and u.The
comparison between the attained results with the notch and
ideal filters shows that the second-order notch filter can be
used to approximate the ideal notch filter without significant
loss of performance. Analyzing Figures 3–5, it is seen that
two, K
= 2, HOS-based features are enough for detecting
abnormal condition in voltage signals when N
= 256, 128,
and 64. For frame lengths equal to N
= 32 and 16, at least,
11.522.533.5
×10
−3
C
2
(257)
−5
0
5
10
15
×10
−5
C
4
(512)
Notch filter
With event
Without event
(a)
11.522.533.5
×10
−3
C
2
(257)
−5
0
5
10
15
×10
−5
C
4
(512)
Ideal filter
With event
Without event
(b)
Figure 3: HOS-based features extracted from voltage signals whose
frame length is equal to N
= 256. For this frame length, second-
and fourth-order statistics are extracted from u.
00.511.522.53
×10
−3
C
2
(256)
−1
0
1
×10
−4
C
4
(251)
Notch filter
With event
Without event
(a)
00.511.522.53
×10
−3
C
2
(256)
−1
0
1
×10
−4
C
4
(251)
Ideal filter
With event
Without event
(b)
Figure 4: HOS-based features extracted from voltage signals whose
frame length is equal to N
= 128. For this frame length, second-
and fourth-order statistics are extracted from u.
8 EURASIP Journal on Advances in Sig nal Processing
0.511.522.533.54
×10
−3
C
2
(65)
−1
−0.5
0
0.5
1
×10
−5
C
4
(128)
Notch filter
With event
Without event
(a)
0.511.522.533.54
×10
−3
C
2
(65)
−1
−0.5
0
0.5
1
×10
−5
C
4
(128)
Ideal filter
With event
Without event
(b)
Figure 5: HOS-based features extracted from voltage signals whose
frame length is equal to N
= 64. While second-order statistics are
extracted from f, the fourth-order statistic is extracted from u.
three, K = 3, features are needed, see Figures 6-7. These re-
sults were obtained with the discussed procedure for feature
extraction and selection applied to many voltage signals. The
voltage signals analyzed comprise typical waveform voltage
disturbances.
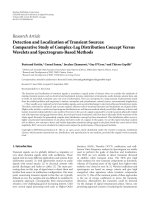
Figure 8 gives a picture of the performance of the HOS,
RMS 1, and RMS 2 techniques when f
s
= 256 × 60 Hz and
N
= 256, 128, 64, 32, and 16. These used frame lengths cor-
respondto1,1/2,1/4,1/8,and1/16cyclesofthefunda-
mental component, respectively. To obtain these results, 2236
synthetic waveforms of voltage signals were generated. The
synthetic voltage disturbances generated are sags, swells, in-
terruptions, harmonics, damped oscillations, notches, and
spikes. Although in measurement data we can see that the
SNR is around 40 dB, we evaluated the performance of the
three detection techniques for the SNR ranging from 5 up to
30 dB, but, for the sake of simplicity, only the results achieved
when SNR
= 30 dB are presented. From this plot, one can see
that HOS technique performance provides the lowest error
detection rate.
Figure 9 shows the results achieved when sags, swells, and
interruptions occur in the voltage signals to illustrate the per-
formance of all techniques when typical disturbances asso-
ciated with the fundamental components occur. The frame
lengths correspond to 1,1/2, 1/4, 1/8, and 1/16 cycles of the
fundamental component and the number of synthetic wave-
form is equal to 880. One can note that the performance
difference among HOS, RMS 1, and RMS 2 techniques is
0.04
0.02
0
C
4
(33)
2
4
6
8
10
×10
−3
C
2
(64)
−10
−5
0
×10
−3
C
2
(36)
Notch filter
With event
Without event
(a)
0.04
0.02
0
C
4
(33)
2
4
6
8
10
×10
−3
C
2
(64)
−10
−5
0
×10
−3
C
2
(36)
Ideal filter
With event
Without event
(b)
Figure 6: HOS-based features extracted from voltage signals whose
frame length is equal to N
= 32. While second-order statistics are
extracted from f, the fourth-order statistic is extracted from u.
0.04
0.02
0
C
4
(33)
2
4
6
8
10
×10
−3
C
2
(64)
−10
−5
0
×10
−3
C
2
(36)
Notch filter
With event
Without event
(a)
0.04
0.02
0
C
4
(33)
2
4
6
8
10
×10
−3
C
2
(64)
−10
−5
0
×10
−3
C
2
(36)
Ideal filter
With event
Without event
(b)
Figure 7: HOS-based features extracted from voltage signals whose
frame length is equal to N
= 16. While second-order statistics are
extracted from f, the fourth-order statistic is extracted from u.
Mois
´
es V. Ribeiro et al. 9
00.20.40.60.81
Cycles of the fundamental frequency
0
0.1
0.2
0.3
0.4
0.5
0.6
0.7
0.8
0.9
1
Error ratio
HOS
RMS 1
RMS 2
Figure 8: Error detection rate when the frame lengths correspond
to 1/16, 1/8, 1/4, 1/2, and 1 cycles of the fundamental component.
00.20.40.60.81
Cycles of the fundamental frequency
0
0.01
0.02
0.03
0.04
0.05
0.06
0.07
0.08
0.09
0.1
Error ratio
HOS
RMS 1
RMS 2
Figure 9: Error detection rate when the frame lengths are 1/16, 1/8,
1/4, 1/2, and 1 cycles of the fundamental component.
considerably reduced. It is something expected because RMS
1 and RMS 2 techniques were developed to detect sag distur-
bances as well as their sources. Based on other simulation re-
sults, one can state that if the disturbance set is reduced to be
composed of voltage sags, then the performance of the HOS
technique is slightly better than the performance of RMS 1
and RMS 2 techniques if SNR is higher than 25 dB and much
better if the SNR is lower than 25 dB. From the results por-
0 1015202530
SNR
0
0.1
0.2
0.3
0.4
0.5
0.6
0.7
0.8
0.9
1
Error ratio
HOS
RMS 1
RMS 2
Figure 10: Error detection rate when the frame length is equal to
one cycle of the fundamental component and the SNR ranges from
5upto30dB.
trayed in Figures 8 and 9, one can note that the proposed
technique offers a considerable enhancement compared with
the previous ones. In fact, the use of information from both
fundamental and transient components provides more rele-
vant characterization of disturbances in voltage signals, espe-
cially when N is reduced.
The results obtained with HOS, RMS 1, and RMS 2 tech-
niques when the SNR varies between 5 a nd 30 dB is high-
lighted in Figure 10. The following considerations were taken
into account to carry out the simulation: (i) the frame length
is equal to one cycle of the fundamental component, (ii)
f
s
= 256 × 60 Hz, (iii) the gener ated synthetic voltage dis-
turbances are sags, swells, interruptions, harmonics, damped
oscillations, notches, and spikes, (iv) the number of data is
2236. The results verify that HOS technique presents an im-
proved performance when the SNR is higher than 10 dB.
Figure 11 shows the performance of all three detection
techniques when the measurement data of the IEEE working
group P1159.3 are used. This database is comprised of iso-
lated and multiple events. The HOS, RMS 1, and RMS 2 tech-
niques were designed with real data in which the SNR is equal
40 dB. The generated voltage disturbances are sags, swells,
interruptions, harmonics, damped oscillations, notches, and
spikes. And, the numbers of data for design and test are equal
to 2236 and 110, respectively. It is clear to note that the HOS
technique is capable of detecting all disturbances, but the
same is not possible with the RMS 1 and RMS 2 techniques.
The performance of the HOS technique when the SNR
ranges from 5 up to 30 dB and the frame lengths correspond
to 1, 1/2, 1/4, 1/8, and 1/16 cycles of the fundamental compo-
nent is depicted in Figure 12. One can note that the perfor-
mance of the HOS-based technique achieves expressive de-
tection rate when the SNR is higher than 25 dB.
10 EURASIP Journal on Advances in Sig nal Processing
00.20.40.60.81
Cycles of the fundamental frequency
0
0.1
0.2
0.3
0.4
0.5
0.6
0.7
0.8
0.9
1
Error ratio
HOS
RMS 1
RMS 2
Figure 11: Error detection rate when the measurement data from
IEEE working group P1159.3 is considered. The frame lengths are
equal to 1/16, 1/8, 1/4, 1/2, and 1 cycles of the fundamental compo-
nent and the SNR is around 40 dB.
00.20.40.60.81
Cycles of the fundamental frequency
0
0.05
0.1
0.15
0.2
0.25
0.3
0.35
0.4
0.45
0.5
Error ratio
SNR = 30 dB
SNR
= 25 dB
SNR
= 20 dB
SNR
= 15 dB
SNR
= 10 dB
SNR
= 5dB
Figure 12: Error detection rate attained by HOS when the frame
length is equal to 1/16, 1/8, 1/4, 1/2, and 1 cycles of the fundamental
component and the SNR ranges from 5 up to 30 dB.
Overall, from the results obtained, it is seen that the pro-
posed technique is more effective in terms of performance
than the technique introduced in [3], if a reduced-length vec-
tor x is considered for detecting abnormal conditions of volt-
age signals.
Now, in order to present the behavior of the proposed
technique to pinpoint, the start and end points of distur-
00.02 0.04 0.06 0.08 0.1
Time (s)
−1
0
1
(a)
00.02 0.04 0.06 0.08 0.1
Time (s)
−1
0
1
(b)
00.02 0.04 0.06 0.08 0.1
Time (s)
−0.5
0
0.5
(c)
Figure 13: (a) Signal {x(n)},(b)signal{ f (n)},(c)signal{u(n)}.
00.02 0.04 0.06 0.08 0.1
Time (s)
−2
0
2
(a)
00.02 0.04 0.06 0.08 0.1
Time (s)
−1
0
1
(b)
00.02 0.04 0.06 0.08 0.1
Time (s)
−1
0
1
(c)
Figure 14: (a) Signal {x(n)},(b)signal{ f (n)},(c)signal{u(n)}.
bances in voltage signals, Figures 13 and 14 show real voltage
signals obtained from IEEE working group P1159.3 website,
{x( n)}, and their corresponding { f (n)} and {u(n)} com-
ponents, which are extracted in accordance to the proposed
technique, and Figures 15 and 16 depict the extracted HOS-
based parameter from these signals. L
N
= 128 for {x(n)}
and { f (n)} signals and L
N
= 8for{u(n)} signals. The
Mois
´
es V. Ribeiro et al. 11
00.02 0.04 0.06 0.08 0.1
Time (s)
−10
−5
0
(a)
00.02 0.04 0.06 0.08 0.1
Time (s)
−10
−5
0
(b)
00.02 0.04 0.06 0.08 0.1
Time (s)
−0.04
−0.02
0
(c)
Figure 15: (a) C
4
(0) HOS-based parameter extracted from {x(n)},
(b) C
4
(0) HOS-based parameter extracted from { f (n)},(c)C
4
(0)
HOS-based parameter extracted from
{u(n)}.
00.02 0.04 0.06 0.08 0.1
Time (s)
−10
−5
0
(a)
00.02 0.04 0.06 0.08 0.1
Time (s)
−10
−5
0
(b)
00.02 0.04 0.06 0.08 0.1
Time (s)
−10
−5
0
(c)
Figure 16: (a) C
4
(0) HOS-based parameter extracted from {x(n)},
(b) C
4
(0) HOS-based parameter extracted from { f (n)},(c)C
4
(0)
HOS-based parameter extracted from
{u(n)}.
reason for using fourth-order cumulants instead of second-
or third-order cumulants resides on the fact the former re-
vealed through simulations to be more appropriate than the
latter. Note that the start and end points of the abnormal
event can be very well detected with features based on fourth-
order cumulants.
5. CONCLUSIONS
A disturbance detection technique for voltage signals has
been introduced. The proposed technique allows the detec-
tion of abnormal conditions in frame with at least N
= 16
elements. Although, we have presented results based on volt-
age signals sampled at f
s
= 256 × 60 Hz, we have verified that
the same behavior is attained if the sampling rate is reduced
or increased. This feature is a very a ttractive one because the
detection of abnormal voltage signals can be performed at
frames which correspond to multiple or submultiples of one-
cycle fundamental component when different sampling rates
are considered. As a result, occurrences of short- and long-
time voltage disturbances can be detected appropriately.
From the results reported in Section 4, one can note that
the proposed technique, which was designed to detect the oc-
currence and the start and end point of events in voltage sig-
nals, can be applied not only for power quality application
but also to digital protection of power system that demands
fast, efficient, and simple detection techniques.
Future works are toward the development of signal pro-
cessing techniques capable of decomposing the power line
signals with reduced transient effect, the investigation of
the proposed HOS-based technique to digital protection of
power system and its extension to three-phase case.
ACKNOWLEDGMENTS
This work was supported in part by CNPq under Grants
150064/2005-5 and 550178/2005-8 and FAPEMIG under
Grant TEC 00181/06, all from Brazil. The authors are in debt
to the anonymous reviewers for providing valuable com-
ments and suggestions.
REFERENCES
[1] M. V. Ribeiro, “Signal processing techniques for power line
communication and power quality applications,” Ph.D. dis-
sertation, University of Campinas (UNICAMP), S
˜
ao Paulo,
Brasil, April 2005.
[2]C.A.Duque,M.V.Ribeiro,F.R.Ramos,andJ.Szczupak,
“Power quality event detection based on the divide and con-
quer principle and innovation concept,” IEEE Transactions on
Power Delivery, vol. 20, no. 4, pp. 2361–2369, 2005.
[3] I.Y.H.Gu,N.Ernberg,E.Styvaktakis,andM.H.J.Bollen,“A
statistical-based sequential method for fast online detection of
fault-induced voltage dips,” IEEE Transactions on Power Deliv-
ery, vol. 19, no. 2, pp. 497–504, 2004.
[4] M. Karimi, H. Mokhtari, and M. R. Iravani, “Wavelet based
on-line disturbance detection for power quality applications,”
IEEE Transactions on Power Delivery, vol. 15, no. 4, pp. 1212–
1220, 2000.
12 EURASIP Journal on Advances in Sig nal Processing
[5] H. Mokhtari, M. Karimi-Ghartemani, and M. R. Iravani, “Ex-
perimental performance evaluation of a wavelet-based on-
line voltage detection method for p ower quality applications,”
IEEE Transactions on Power Delivery, vol. 17, no. 1, pp. 161–
172, 2002.
[6]D.G.EceandO.N.Gerek,“Powerqualityeventdetection
using joint 2-D-wavelet subspaces,” IEEE Transactions on In-
strumentation and Measurement, vol. 53, no. 4, pp. 1040–1046,
2004.
[7] C W. Lu and S J. Huang, “An application of B-spline wavelet
transform for notch detection enhancement,” IEEE Transac-
tions on Power Delivery, vol. 19, no. 3, pp. 1419–1425, 2004.
[8] T. K. Abdel-Galil, E. F. El-Saadany, and M. M. A. Salama,
“Power quality event detection using Adaline,” Electric Power
Systems Research, vol. 64, no. 2, pp. 137–144, 2003.
[9] P. K. Dash and M. V. Chilukuri, “Hybrid S-transform and
Kalman filtering approach for detection and measurement of
short duration disturbances in power networks,” IEEE Trans-
actions on Instrumentation and Measurement,vol.53,no.2,pp.
588–596, 2004.
[10] I. Y H. Gu and E. Styvaktakis, “Bridge the gap: signal pro-
cessing for power quality applications,” Electr ic Power Systems
Research, vol. 66, no. 1, pp. 83–96, 2003.
[11] H. Zhang, P. Liu, and O. P. Malik, “Detection and classification
of power quality disturbances in noisy conditions,” IEE Pro-
ceedings: Generation, Transmission and Distribution, vol. 150,
no. 5, pp. 567–572, 2003.
[12] S J. Huang, T M. Yang, and J T. Huang, “FPGA realization of
wavelet transform for detection of electric power system dis-
turbances,” IEEE Transactions on Power Delivery, vol. 17, no. 2,
pp. 388–394, 2002.
[13] D. Castaldo, D. Gallo, C. Landi, and A. Testa, “A digital in-
strument for nonstationary disturbance analysis in power
lines,” IEEE Transactions on Instrumentation and Measure-
ment, vol. 53, no. 5, pp. 1353–1361, 2004.
[14] H T. Yang and C C. Liao, “A de-noising scheme for enhanc-
ing wavelet-based power quality monitoring system,” IEEE
Transactions on Power Delivery, vol. 16, no. 3, pp. 353–360,
2001.
[15] B.D.O.AndersonandJ.B.Moore,Optimal Filtering, Prentice-
Hall, Englewood Cliffs, NJ, USA, 1979.
[16] C. L. Nikias and A. P. Petropulu, Higher-Order Spectra
Analysis—A Nonlinear Signal Processing Framework, Prentice
Hall, Englewood Cliffs, NJ, USA, 1993.
[17] J. M. Mendel, “Tutorial on higher-order statistics (spectra) in
signal processing and system theory: theoretical results and
some applications,” Proceedings of the IEEE,vol.79,no.3,pp.
278–305, 1991.
[18] M. V. Ribeiro, C. A. G. Marques, C. A. Duque, A. S. Cerqueira,
and J. L. R. Pereira, “Power quality disturbances detection us-
ing HOS,” in IEEE Power Engineering Socie ty General Meeting,
p. 6, Monreal, QC, Canada, June 2006.
[19] R. N. McDonough and A. D. Whalen, Detection of Signals in
Noise, Academic Press, London, UK, 1995.
[20] H. L. Van Trees, Detection, Estimation and Modulation
Theory—Parts I, Springer, New York, NY, USA, 1968.
[21] H. L. Van Trees, Detection, Estimation and Modulation
Theory—Parts III, Springer, New York, NY, USA, 1971.
[22] M. Fishler and H. Messer, “Transient signal detection using
prior information in the likelihood ratio test,” IEEE Transac-
tions on Signal Processing, vol. 41, no. 6, pp. 2177–2192, 1993.
[23] S. Colonnese and G. Scarano, “Transient signal detection us-
ing higher order moments,” IEEE Transactions on Signal Pro-
cessing
, vol. 47, no. 2, pp. 515–520, 1999.
[24] G. B. Giannakis and M. K. Tsatsanis, “Signal detection and
classification using matched filtering and higher order statis-
tics,” IEEE Transactions on Acoustics, Speech, and Signal Pro-
cessing, vol. 38, no. 7, pp. 1284–1296, 1990.
[25] C. L. Nikias and J. M. Mendel, “Signal processing with higher-
order spectra,” IEEE Signal Processing Magazine,vol.10,no.3,
pp. 10–37, 1993.
[26] J.Kauraniemi,T.I.Laakso,I.Hartimo,andS.J.Ovaska,“Delta
operator realizations of direct-form IIR filters,” IEEE Transac-
tions on Circuits and Systems II: Analog and Digital Signal Pro-
cessing, vol. 45, no. 1, pp. 41–52, 1998.
[27] R. H. Middleton and G. C. Goodwin, “Improved finite word
length char acteristics in digital control using delta operators,”
IEEE Transactions on Automatic Control, vol. 31, no. 11, pp.
1015–1021, 1986.
[28] S. Theodoridis and K. Koutroumbas, Pattern Recognition,Aca-
demic Press, San Diego, Calif, USA, 1999.
[29] S. Haykin, Adaptive Filter Theory, Prentice-Hall, Englewood
Cliffs, NJ, USA, 1996.
[30] A. K. Jain, R. P. W. Duin, and J. Mao, “Statistical pattern recog-
nition: a review,” IEEE Transactions on Pattern Analysis and
Machine Intelligence, vol. 22, no. 1, pp. 4–37, 2000.
Mois
´
es V. Ribeiro was born in Tr
ˆ
es Rios,
Brazil, in 1974. He received the B.S. de-
gree in electrical engineering from the Fed-
eral University of Juiz de Fora (UFJF), Juiz
de Fora, Brazil, in 1999, and the M.S. and
Ph.D. degrees in electrical engineering from
the University of Campinas (UNICAMP),
Campinas, Brazil, in 2001 and 2005, respec-
tively. Currently, he is an Assistant Professor
at UFJF. He was a Visiting Researcher in the
Image and Signal Processing Laboratory of the University of Cali-
fornia, Santa Barbara, in 2004, a Postdoctoral Researcher at UNI-
CAMP, in 2005, and at UFJF from 2005 to 2006. He is Guest Edi-
tor for the special issues on Emerging Signal Processing Techniques
for Power Quality Applications and on Advanced Signal Processing
and Computational Intelligence Techniques for Power Line Com-
munications for the EURASIP Journal on Advances in Sig n al Pro-
cessing and Reviewer of International Journals. He has been author
of 15 journals and 37 conference papers, and holds six patents. His
research interests include computational intelligence, digital and
adaptive signal processing, power quality, power line communica-
tion, and digital communications. He received student awards from
IECON ’01 and ISIE ’03. He is a Member of the Technical Pro-
gram Committee of the ISPLC ’06, ISPLC ’07, CERMA ’06, and
ANDESCOM ’06, and a Member of the IEEE ComSoc Technical
Committee on Power Line Communications.
Cristiano Augusto G. Marques was born
in Juiz de Fora, Brazil, in 1979. He re-
ceived the B.S. degree in electrical engineer-
ing from the Federal University of Juiz de
Fora (UFJF), Juiz de Fora, Brazil, in 2005.
Currently, he is a graduate student in Elec-
trical Engineering Department at UFJF. His
research interests are power quality analy-
sis, dig ital instrumentation, and digital sig-
nal processing.
Mois
´
es V. Ribeiro et al. 13
Carlos A. Duque wasborninJuizdeFora,
Brazil, in 1962. He received the B.S. degree
from the Federal University of Juiz de Fora
(UFJF), Juiz de Fora, Brazil, in 1986, and
the M.S. and Ph.D. degrees in electrical en-
gineering from the Catholic University of
Rio de Janeiro, Rio de Janeiro, Brazil, in
1990 and 1997, respectively. Currently, he is
a Professor with the Engineering Faculty at
UFJF, where he has been since 1989. His re-
search interests include power quality analysis, digital instrumen-
tation, and digital signal processing.
AugustoS.Cerqueirareceived the B.S. and
D.Sc. degrees in 1998 and 2002, respec-
tively from the Federal University of Rio
de Janeiro (UFRJ). He has been an Asso-
ciate Professor at the Electrical Engineer-
ing Department of Federal University of
Juiz de Fora (UFJF), Brazil, since 2004.
He collaborates with the European Labora-
tory for Particle Physics (CERN) since 1997
in calorimeter projects. His research topics
comprise general signal processing, artificial intelligence, and in-
strumentation.
Jos
´
e Luiz R. Pereira received his B.S. in 1975
from the Federal University of Juiz de Fora,
Brazil, the M.S. in 1978 from COPPE—
Federal University of Rio de Janeiro, and the
Ph.D. in 1988 from UMIST, UK. From 1977
to 1992, he worked at the Federal University
of Rio de Janeiro. Since 1993, he has been
working at the Electrical Engineering De-
partment of the Federal University of Juiz de
Fora, where he recently became a Professor.
His research interests include planning and operation modeling for
transmission and distribution systems.