Báo cáo hóa học: " Developing 1D nanostructure arrays for future nanophotonics" potx
Bạn đang xem bản rút gọn của tài liệu. Xem và tải ngay bản đầy đủ của tài liệu tại đây (1.04 MB, 21 trang )
Abstract There is intense and growing interest in
one-dimensional (1-D) nanostructures from the per-
spective of their synthesis and unique properties,
especially with respect to their excellent optical
response and an ability to form heterostructures. This
review discusses alternative approaches to preparation
and organization of such structures, and their potential
properties. In particular, molecular-scale printing is
highlighted as a method for creating organized
pre-cursor structure for locating nanowires, as well as
vapor–liquid–solid (VLS) templated growth using
nano-channel alumina (NCA), and deposition of 1-D
structures with glancing angle deposition (GLAD). As
regards novel optical properties, we discuss as an
example, finite size photonic crystal cavity structures
formed from such nanostructure arrays possessing high
Q and small mode volume, and being ideal for devel-
oping future nanolasers.
Keywords Nanostructures Æ Nanophotonics Æ
Vapour–liquid–solid (VLS) growth Æ Glancing angle
deposition Æ Molecular scale imprinting Æ Nanowire
photonic crystals
Introduction
Demands for high speed, highly integrated, low power,
and low cost electronic and optoelectronic devices
continue to drive the development of devices below
about 100 nm. Increasingly, the classical semiconductor
physics is becoming inadequate as quantum mechanical
effects dominate the properties of devices. In this
regime, energy states of carriers change from continu-
ous states to quantized discrete states with coincident
changes in the density of states (DOS). As a result,
novel devices based on the unique novel properties of
nanowires can be obtained, such as (1) single-electron
transistors, (2) nanowire lasers with lower threshold
currents, higher characteristic temperatures and higher
modulation bandwidths, and (3) high performance
nanowire photodetectors. At the same time, these
structures when organized into arrays can offer systems
with unique properties. This review is focused on how
to realize such advanced structures addressing novel
approaches to organization such as molecular-scale
H. E. Ruda (&) Æ Z. Wu Æ U. Philipose Æ T. Xu Æ S. Yang
Centre for Nanotechnology, University of Toronto, Toronto,
Ontario, Canada, M5S 3E4
e-mail:
J. C. Polanyi Æ Jody (S. Y.) Yang
Department of Chemistry, University of Toronto, Toronto,
Ontario, Canada, M5S 3H6
K. L. Kavanagh Æ J. Q. Liu Æ L. Yang Æ Y. Wang
Department of Physics, Simon Fraser University, Burnaby,
British Columbia, Canada, V5A 1S6
K. Robbie Æ J. Yang Æ K. Kaminska
Department of Physics, Queen’s University, Kingston,
Ontario, Canada, K7L 3N6
D. G. Cooke Æ F. A. Hegmann
Department of Physics, University of Alberta, Edmonton,
Alberta, Canada, T6G 2J1
A. J. Budz Æ H. K. Haugen
Department of Engineering Physics, McMaster University,
Hamilton, Ontario, Canada, L8S 4M1
H. K. Haugen
Department of Physics and Astronomy, McMaster
University, Hamilton, Ontario, Canada, L8S 4M1
Nanoscale Res Lett (2006) 1:99–119
DOI 10.1007/s11671-006-9016-6
123
NANO REVIEW
Developing 1D nanostructure arrays for future nanophotonics
Harry E. Ruda Æ John C. Polanyi Æ Jody (S. Y.) Yang Æ Zhanghua Wu Æ
Usha Philipose Æ Tao Xu Æ Susan Yang Æ K. L. Kavanagh Æ J. Q. Liu Æ L. Yang Æ
Y. Wang Æ Kevin Robbie Æ J. Yang Æ K. Kaminska Æ D. G. Cooke Æ F. A. Hegmann Æ
A. J. Budz Æ H. K. Haugen
Published online: 26 August 2006
Ó to the authors 2006
imprinting (MSI), and to synthesis, such as vapor–li-
quid–solid (VLS) growth and glancing angle deposition
(GLAD), leading to a discussion of the particular
properties of one-dimensional (1-D) systems. We also
discuss how regular arrays of 1-D systems can offer
unique opportunities in their properties such as for
nanowire array laser photonic cavities.
Section 2 is concerned with MSI as a means of pre-
patterning surfaces using a two step process of self-
assembly and then imprinting. Organized patterns on
the atomic scale may be formed by this approach, and
are suitable as precursors for subsequent formation of
1-D nanostructures. For example, in Sect. 3 a review of
nanowire synthesis techniques are discussed including
VLS growth—this technique relies on the presence of
catalyst material for growth to occur, with the nano-
wire dimensions dictated by the size of the initial cat-
alyst deposit. MSI provides a means for atomically
defining the location and in-principle size of the
deposits, and therefore is the ideal first step in forming
organized systems of nanowires. Section 4 discusses the
unique properties of nanowires and systems of nano-
wires, with a strong emphasis on nanophotonics and
photonic devices. The paper ends with some broad
conclusions in Sect. 5.
Molecular-scale imprinting
It is widely recognized that the fabrication of nano-
structures atom-by-atom is a process so slow as to be
impractical as a means for manufacturing nanoscale
devices. To construct even an object of a few million
atoms, it will be necessary to assemble them concur-
rently, not consecutively. To this end, extensive
research has been performed, in many laboratories on
‘‘self-assembly’’. Increasingly, it is becoming possible
to self-assemble nanostructures that offer potential use
as devices. There is, however, a significant obstacle
along this path to device fabrication—namely, that the
requirement for self-assembly is very different from
that for device-utilization. Self-assembly requires
mobility, whereas device-utilization requires stability.
Typically self-assembly occurs at a surface, in the
physisorbed state. The subsequent stage of device-uti-
lization customarily involves charge-transfer (CT) to
the self-assembled structure or current flow through it.
However, with each attachment or detachment of an
electron or a hole, the interaction between the nano-
structure and its underlying substrate alters markedly,
thereby tending to shake the structure loose from its
weak physisorption moorings. It would appear, there-
fore, that successful device fabrication will involve two
consecutive stages; the mobile stage of self-assembly
and a subsequent stage of immobilization that we refer
to as ‘‘imprinting’’. Crucial to the imprinting stage—as
also in any macroscopic printing process—is pattern-
retention in going from the ‘‘type’’ to the ‘‘imprint’’.
The printing process may be seen as an induced
chemical reaction in which the physisorbed structure is
converted to the chemisorbed state. Since self-assem-
bly, which is a process of diffusion, takes a finite time,
t
sa
, it is advantageous to be able to select t
sa
, and sub-
sequently induce the imprinting reaction (physisorp-
tion fi chemisorption) at a chosen instant, t
imp
,by
means of a brief pulse of energy delivered in the form
of heat, light or incident electrons.
The requirement that the pattern which constitutes
the physisorbed nanostructure shall print—i.e., chem-
ically react—with the underlying surface without
alteration in pattern, can readily be translated into the
language of ‘‘reaction dynamics’’. Reaction dynamics is
the study of atomic and molecular motions in chemical
reactions. The requirement that a physisorbed pattern
print unaltered as a chemisorbed one is, therefore, a
requirement for fully localized reaction at the atomic
level. ‘‘Chemical reaction’’ consists in the transfer of all
or part of the physisorbed molecule, previously loosely
attached by physisorption to the surface, and therefore
at a distance from it, downward to the more-strongly
covalently bound separation from the surface. In a
well-localized reaction this transfer from the physi-
sorbed to the chemisorbed state occurs without lateral
displacement across the surface by so much as one
atomic spacing. Only then is the molecular-scale pat-
tern fully retained.
A priori one might suppose that the requirements
for highly localized reaction would be stringent,
including (a) a reaction coordinate (direction of
approach of the reagents) which is normal to the sur-
face-plane, and (b) minimum possible translational
energy along the reaction co-ordinate. Conditions (a)
and (b) would make it likely that the atom or group
approaching the surface had only a negligible momen-
tum across the surface, thereby tending to suppress
reaction at a distance from the original point of impact.
In fact the first example of the fully localized
‘‘imprinting’’ of a physisorbed nanostructure as an
indistinguishable chemisorbed atomic pattern [1]is
unlikely to have satisfied either criterion (a) or (b)
above. It would appear, therefore, that ‘‘molecular-
scale imprinting’’ (MSI) and its accompanying highly
localized reaction does not make such stringent
requirements on the molecular dynamics; the approach
to the surface need not be strictly at 90° to the surface-
plane, nor need the reaction be induced at its threshold
100 Nanoscale Res Lett (2006) 1:99–119
123
energy. This is, of course, favorable to the prospects for
generalizing the method of MSI. This is not to say that
any physisorbed nanostructure will chemically imprint
its pattern in unaltered form. It seems probable, how-
ever, that a broad category of reagents will do so,
under achievable experimental conditions.
Reference 1 provides an example of a physisorbed
self-assembled pattern of methyl bromide, CH
3
Br(ad),
adsorbed at approximately 50 K surface-temperature
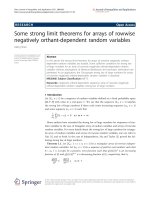
at a Si(111) 7 · 7 surface. Figure 1a shows an STM
image of the clean surface at V
s
= 1.5 V, Fig. 1b shows
the circles of physisorbed CH
3
Br(ad) found at 50 K,
and Fig. 1c shows a close-up of one of these circles
comprising 12 well-separated CH
3
Br(ad) molecules.
This is the molecular ‘‘type’’ prior to imprinting.
Though not previously reported for CH
3
Br(ad), such
rings are well-known for benzene at 78 K [2], which,
however, has not been observed to chemically
‘‘imprint’’. Figure 1d shows the effect of 193 nm radi-
ation on CH
3
Br(ad) at the unchanged surface voltage
of V
s
= 1.5 V; the bright physisorbed circles of
CH
3
Br(ad) have disappeared leaving dark circles of
Fig. 1 (a) STM image of the clean Si(111)7 · 7 surface at 50 K.
A7· 7 unit cell is indicated. V
surface
= 1.5 V, current = 0.2 nA,
~20 · 20 nm. (b) STM image of physisorbed CH
3
Br(ad) on the
50 K Si(111)7 · 7 surface at a coverage of 0.41 monolayer.
Physisorbed molecules appear as protrusions over the middle
adatoms. V
surface
= 1.5 V, current = 0.2 nA, ~20 · 20 nm. (c)
Zoomed-in STM image of a single ring of physisorbed CH
3
Br
on Si(111) surface (indicated by the dotted circle), as in (b) but
~30 · 30 A
˚
.(d) Chemisorbed Br on Si(111) surface after
photolysis of (three successive applications of) physisorbed
CH
3
Br(ad) at 50 K. Br (beneath dotted circle) appears as
depressions on the middle adatoms. V
surface
= 1.5 V cur-
rent = 0.2 nA, ~30 · 30 A
˚
.(e) STM image of chemisorbed Br
imprints on the middle adatoms (indicated by a dotted circle) as
in (d) but with V
surface
= 2.5 V. (f) STM image of chemisorbed
Br on the middle adatoms (dotted-in) obtained by scanning (a
single application of) physisorbed CH
3
Br(ad) at 2.5 V (scans
from lower left to upper right); V
surface
= 2.5 V, cur-
rent = 0.2 nA, ~30 · 30 A
˚
Nanoscale Res Lett (2006) 1:99–119 101
123
Br–Si which, in Fig. 1e, ‘light up’ to give 12 bright Br–
Si at V
s
= 2.5 V. This is the well-known voltage-
dependence of Br–Si STM images [3].
Definitive proof that the physisorbed CH
3
Br(ad),
only observable at the surface £50 K, had been con-
verted to a chemisorbed species was to be found in the
fact that the circular patterns of Fig. 1e following UV
irradiation survived unaltered when heated to 200°C
for over 1 min. Undoubtedly, chemisorption had
occurred. There is no way, however, that intact
CH
3
Br(ad) could become strongly chemisorbed at the
surface, but there is abundant evidence that physi-
sorbed methyl halides undergo photoreaction to halo-
genate reactive substrates [4–10]. What is new is the
identification, by STM, of this photoreaction as being a
highly localized event; i.e., Br–Si forms exclusively at
the Si-atoms directly beneath the parent CH
3
Br(ad)
molecules.
A number of authors have proposed and found
evidence that the major cause of photo-induced surface
reaction in physisorbed organic halides is charge-
transfer from the substrate to the adsorbate [4–10]. Not
surprisingly, therefore, the reaction of CH
3
Br(ad) with
Si(111) 7 · 7 could be induced by electrons of suffi-
cient voltage coming from the STM tip (namely 2.5 V).
Figure 1f shows that the reaction induced in this fash-
ion is, as before, highly localized, giving rise to rings of
chemisorbed Br–Si in place of the original rings of
physisorbed CH
3
Br(ad).
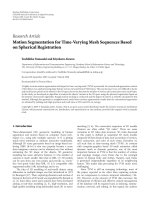
Figure 2 gives a schematic representation of the
process of MSI. A circle of 12 physisorbed CH
3
Br(ad)
are shown in Fig. 2a. In Fig. 2b, following irradiation
by photons or electrons the Br (red) are shown reacting
locally to brominate only the Si-atoms beneath the
CH
3
Br(ad). The CH
3
(g) radicals are thought to leave
the surface, since the characteristic black features
indicative of methyl bound to silicon were not
observed in the STM images following irradiation.
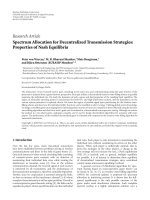
It remains to explain the highly localized nature of
the observed reaction. Figure 3 is the physisorption
geometry of CH
3
Br(ad)/Si(111) 7 · 7 computed in the
MP2 approximation. As expected the most-stable
configuration is that with the Br-end of CH
3
Br pointing
downward toward the Si surface. However, the C–Br
bond is found to be at an angle of approximately 60° to
the surface normal. When, therefore, an electron is
transferred to the CH
3
Br
–
anti-bonding orbital, causing
the C–Br bond in CH
3
Br
–
to extend, the Br is expected
to hit the surface at an angle to the surface-plane (cf.
condition (a) of the previous discussion). Since the
photon energy at 193 nm is 6.3 eV, the photo-electron
will bring several eV of excess energy to the CH
3
Br
(cf. condition (b); previous discussion). A priori one
might expect, therefore, that there would be sub-
stantial migration of Br across the surface with a
resultant ‘‘blurring’’ of the Br–Si imprint as compared
with the parent CH
3
Br(ad) pattern. This is not, how-
ever, observed.
From a fundamental standpoint, the observation of
highly localized reaction under conditions that seem to
strongly favor de-localization is an interesting conun-
drum. The proposed explanation [1] is that the Br
–
from
CH
3
Br recoiling toward the surface (even though at a
glancing angle of incidence) rides up a repulsive wall
and spends ~10
–13
s at the repulsive turning-point before
recoiling. These 100 fs are long enough to permit
Fig. 2 Schematic
representation of (a)
physisorption of CH
3
Br on
Si(111) surface with Br
pointing down, and (b)
chemisorbed Br on middle
adatom positions, after
photolysis or electron-impact
at 50 K
102 Nanoscale Res Lett (2006) 1:99–119
123
reverse charge-transfer to take place from Br
–
to the
underlying silicon surface [11], with the result that Br
–
is
trapped in the potential-well of the first Si atom that it
encounters, i.e., the reaction is highly localized.
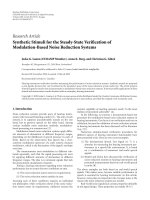
The proposed mechanism for MSI [1] is illustrated in
Fig. 4 as a three-stage process. The energies are cal-
culated by density functional theory (DFT) for the
simple model of (1) charge-transfer to the methyl
bromide from the silicon surface, CH
3
Br + e
–
fi
CH
3
Br
–
, (2) transfer of Br
–
from methyl bromide to the
surface modeled as CH
3
Br
–
+ SiH
3
fi CH
3
+Br
–
ÆSiH
3
, followed by (3) charge-transfer in ~10
–13
s. back
to the silicon surface, Br
–
ÆSiH
3
fi Br–SiH
3
+e
–
. The
three consecutive stages are indicated by the three
arrows labeled (1), (2) and (3) in the figure. It is evi-
dent that the loss of energy to the surface in stage (3)
transfers Br from the repulsive Br
–
ÆSiH
3
state to the
bound Br–SiH
3
state, in which it is held captive by a
strong covalent bond. Localized reaction, and hence
MSI, has taken place.
Nanowire synthesis
Growth on vicinal substrates
Several groups have reported on the growth of self-
assembled nanowires on vicinal substrates [12–20].
Figure 5 illustrates the process of nanowires growth on
vicinal substrates. The substrates are miscut with an
angle of 1–50°. Materials are alternatively deposited on
the substrates. The expitaxial growth for two materials
is performed in A layer-by-layer or step-flow growth
mode. The growth starts at the step edges and causes
lateral composition modulation. The tilt angle of
the nanowires is sensitive to the coverage of each
Fig. 4 Simple density functional theory (DFT) ab initio model
of the charge-transfer (CT) reaction with co-linear C–Br–Si: (1)
CH
3
Br(ad)+e
–
gives CH
3
Á Br
À
, (2) CH
3
Á Br
À
gives Br
À
Á SiH
3
,
and (3) Br
À
Á SiH
3
gives Br–SiH
3
+e
–
. The dots indicate repulsion.
Repulsion in step 2 was calculated separately for CH
3
Á Br
À
and
Br
À
Á SiH
3
. VEA = vertical electron affinity; E
a
= activation
energy; – DH = heat of reaction
Fig. 3 A depiction of the
equilibrium physisorption
geometry for CH
3
Br, showing
C–Br lying at an angle of ~60°
to the surface normal. The
cluster is Si
13
H
18
distributed
in three layers (a = adatom,
r = rest atom)
Nanoscale Res Lett (2006) 1:99–119 103
123
deposition cycle. If a total of one monolayer per cycle
is deposited, the nanowires are formed perpendicular
to the terraces. The nanowires tilt to the steps if less
than one monolayer per cycle is deposited. But if more
than one monolayer per cycle is deposited, the nano-
wires tilt away from the steps. Serpentine superlattice
nanowires can also be formed on the substrate by this
method by sweeping the per-cycle coverage through a
range that is needed for a vertical structure [14].
Growth on high-index substrates
Nanowires have been demonstrated to grow on high-
index substrates [21, 22]. No
¨
tzel et al. have reported on
growth of GaAs nanowires on high-index surfaces of
GaAs (311)A [21]. The growth of nanowires on high-
index surfaces is due to formation of an array of
nanometer-scale macrosteps or facets with a periodic-
ity determined by energy rather than growth-related
parameters. The layer-by-layer growth of flat surface
having high surface free energy is broken up by
forming facets with lower surface free energy to mini-
mize the surface energy, resulting in the formation of
macrosteps. Macrosteps oriented along the [233]
direction on the GaAs (311)A are formed by two sets
of {331} facets having roughly half the surface free
energy. The complete structure containing alternating
thicker and thinner channels of GaAs and AlAs forms
the nanowires oriented along [233] direction.
Self-assembled Ge nanowires have also been
reported to grow on high-index Si (113) substrates [22].
The nanowires do not orient along steps, instead they
orient along [332] direction and perpendicular to the
steps. It is believed that the orientation of elongated
anisotropically strained Ge islands are energetically
favored in the [332] direction.
Grown on V-grooved substrates
Growth of nanowires can be realized on non-planar
substrates, or so-called V-grooved substrates [23–31].
Different facets are formed on such substrates. The
migration of adatoms and effective sticking coefficient
associated with different facets are different. These
phenomena results in different growth rate on the
different facets, and thus results in lateral thickness
modulation across the substrate structure. V-grooves
are typically fabricated on GaAs (100) using electron-
beam or optical lithography and wet etching, and are
oriented along [01
"
1] direction. Preferential growth of
GaAs on the (100) surfaces located at the bottom of
the V-grooves, results in the formation of crescent-
shaped nanowires. Nanowires have also been grown on
patterned high-index GaAs (n11) substrates [32]. This
is realized by selective growth on the sidewall on one
side of the mesa top and oriented along the [01
"
1]
direction. The fast growth on the side walls results from
the preferential migration of Ga atoms from the mesa
tops and bottoms toward the sidewalls.
Glancing angle deposition
Aggregation of atomic vapors onto flat surfaces can
produce morphological structures with a surprising
degree of complexity and, to some degree, self-orga-
nization. Inter-atomic competition for preferred
incorporation sites in a growing thin film, when cou-
pled with dynamic variation of substrate orientation,
creates a growth regime that is both fundamentally
unpredictable and potentially technologically useful
[33, 34]. By choosing growth parameters, such as
temperature, deposition rate, film material, and sub-
strate orientation, atomically-structured porous mate-
rials can be synthesized with novel functional response
characteristics. These techniques have been demon-
strated to allow fabrication of single-material optical
interference coatings [35], broadband antireflection
coatings [36], and other photonic crystals [37, 38].
While fractal scaling effects have been found to limit
the utility of these films for some applications [39, 40],
these atomic-scale architectures appear to be uniquely
functional three-dimensional (3-D) organized materi-
als [41–44
].
Most thin film deposition technologies attempt to
produce fully dense or crystalline coatings. When
conducted under conditions that prevent film densifi-
cation (low temperature, high deposition rate, etc.),
thin film growth allows the fabrication of a wide variety
of atomically porous structures, whose electromag-
netic, biological, etc. response depends strongly on the
morphology. Figure 6 illustrates the difference
between conventional thin film crystal growth (a, b1,
c1, d1) versus atomically porous growth (a, b2, c2, d2)
where atomic vacancies are ‘‘frozen in’’ to the film
Fig. 5 Schematic illustration of nanowire grown on a vicinal
substrate
104 Nanoscale Res Lett (2006) 1:99–119
123
structure. When atoms condensing from the vapor (a)
are able to fill all crystal sites (b1), the resulting coating
is fully dense and crystalline (c1). If the condensing
atoms are prevented from filling crystal sites (b2), by
transport limitations during ballistic transport or sur-
face diffusion, the resulting coating is atomically por-
ous (c2). At each stage of growth the difference is as
illustrated in (d1 and d2) where in (d1) each arriving
atom is able to reach and condense in a vacant lattice
site, whereas in (d2) arriving atoms are unable to fill
each possible site. Exploiting this atomic-scale com-
petition effect, GLAD, Fig. 7, employs dynamic sub-
strate motion during growth to shape deposited thin
film coating structures. Atoms, evaporated from a bulk
quantity of the source material, sequentially arrive at
the substrate by ballistic transport, and condense to
form a thin film coating. The large substrate tilt en-
hances inter-atomic shadowing, producing porous
coatings with structures that can be controlled by
specifying the substrate orientation, including dynam-
ically [45]. The cross-section of a silicon thin film
deposited in this way is shown in Fig. 7b, where rod-
like morphological structure is seen to grow perpen-
dicular to the substrate, with characteristic dimensions
of tens of nanometers. Given the nearest-neighbor
spacing in crystalline or amorphous silicon of approx-
imately 250 pm, the 100 nm scale bar shown corre-
sponds to the linear dimension of about 400 atoms.
Fine structure within the silicon rods is observable
down to the resolution limit of the scanning electron
microscope at approximately 5 nm, or about 20 atoms.
Because the thin film coatings produced with GLAD
are atomically porous, their electromagnetic response
is best described with effective medium theory, which
predicts an effective response that to first order is
a density-weighted sum of the response of the
film material and the void regions [46]. Using this
knowledge, single-material periodically in-homogenous
coatings were produced to demonstrate 1-D optical
interference effects, including so-called Rugate filters
with sinusoidally varying refractive index [35]. If the
Fig. 7 (a) Schematic illustration of glancing angle deposition
(GLAD), employing substrate tilt and rotation relative to the
condensing atomic vapor flux to create atomically engineered
coatings. (b) Scanning electron micrograph fracture cross-section
of a silicon thin film deposited onto a rapidly rotating substrate at
85° tilt
Fig. 6 Schematic illustration
of atomic aggregation: growth
of fully dense crystals (a, b1,
c2, d1), and transport-limited
growth of atomically
structured porous thin film
coating (a, b2, c2, d2)
Nanoscale Res Lett (2006) 1:99–119 105
123
porosity of the most-porous layers within the structure
is kept intentionally low (by limiting the substrate tilt
to approximately 80
°
), a repeating structure is pro-
duced (Fig. 8a) with a strong optical stop-band, as
predicted by theory. If, however, highly porous layers
are included in the filter design (by tilting the substrate
beyond approximately 80°), a morphological scaling
effect is seen (Fig. 8b) that transforms the growing
interface from two dimensions to a fractal 2+ dimen-
sion. This result is explained by chaotic growth
mechanics that are intrinsic to film deposition at these
glancing deposition angles, and produce power-law
scaling in the morphological structure [39, 40, 46, 47].
While these scaling effects do place constraints on what
morphological structures are possible with this tech-
nique, they also provide unique benefits. Figure 9 dis-
plays a silicon optical filter, where the bifurcating chaos
of glancing deposition is exploited to produce an
antireflection coating that is continuously graded in
porosity to yield an effective refractive index of 1.0 at
the surface—a theoretically ideal index match to air or
vacuum ambient. By continuously, and controllably,
increasing the substrate tilt to 90°, a 5th order poly-
nomial (or quintic) decrease in refractive index was
accomplished, yielding a highly effective broadband
infrared antireflection coating [36]. Experimental
results are in good agreement with theory, suggesting
that this type of coating might be suitable for coatings
on high power laser optics, low-loss optical communi-
cation components, and others.
A recent advance in nanostructured thin film coat-
ings is the development of shaped nano-particles that
are fabricated as constituents of a thin film, then
removed from their substrate to produce a collection of
loose nano-particles, or a nano-powder. Figure 10
shows scanning electron micrographs of these particles.
The particles, in this case composed of silicon, are
helicoidal and about 1 lm long and 200 nm in diame-
ter. The helical pitch is approximately 200 nm. They
are fabricated by: depositing a dense sacrificial layer on
a substrate (in this case NaCl—table salt), depositing
the film with controlled substrate motion (in this case
silicon deposited onto a slowly rotating substrate held
at a fixed tilt angle of 85
°
), dissolution of the sacrificial
layer in water creating a suspension of the particles in
saltwater, successive dilution and centrifugation to
remove the salt and produce a suspension of the
Fig. 8 Scanning electron
micrograph fracture cross-
sections of periodically
inhomogeneous optical
interference filters, fabricated
from silicon, showing (a)
stable growth, and (b) fractal
scaling during growth
Fig. 9 Scanning electron micrograph fracture cross-sections of a
quintic broadband antireflection coating where porosity and
effective refractive index are continuously graded to match the
air/vacuum ambient
106 Nanoscale Res Lett (2006) 1:99–119
123
particles in pure water. To image the particles with
scanning electron microscopy, a drop of the final sus-
pension was placed on a flat silicon substrate, and the
water was allowed to evaporate, leaving the drying ring
and nano-particles seen in Fig. 10. The particles can be
individually separated by dilution, and their structure
can be specified by designing the substrate motion
during growth (for example right-handed helices are
produced by rotating the substrate one direction during
growth, left-handed by rotating the opposite). Fig-
ure 11 shows helicoidal (a) and rod-like (b) silicon
nano-particles. The size, and controlled morphology, of
these nano-particles suggest they might be useful in
experiments probing biological function, particularly as
they have an optical response that can be tailored, and
could be made to exhibit a signature response that
would allow accurate location of perhaps individual
particles. Preliminary experiments have shown that the
chiral structure of the helicoidal particles in suspension
results in circular polarization effects or ‘‘optical
activity’’ [42] including circular dichroism where the
periodic structure of the helix produces a resonance
condition for light matching the pitch and handedness
of the structure. By choosing growth conditions (sub-
strate rotation rate or rotation direction) specific
optical response characteristics can be engineered.
These particles can also be treated as nanophotonic
components in a larger system, and might be useful in
self-organized architectures for advanced sensing,
communication, or computation applications.
VLS growth
Free standing nanowires can not be obtained using
above mentioned methods. A more general method to
synthesize virtually any semiconductor nanowires is
Fig. 10 Scanning electron
micrograph plan-views of
synthesized chiral silicon
nano-particles, displaying
drying-drop pattern
formation (main image), and
aggregated loose nano-
particles (two insets)
Fig. 11 Scanning electron
micrograph plan-views of
synthesized silicon nano-
particles, illustrating (a)
helicoidal, and (b) rod-like,
morphologies
Nanoscale Res Lett (2006) 1:99–119 107
123
based on VLS growth mechanism. VLS growth was
first introduced in 1964 by Wagner and Ellis [48]. A
naturally occurring terrestrial example of VLS growth
is that of Germanium Sulfide whiskers, observed in
condensates of gases released by burning coal in culm
banks by Finkelman et al. [49].
Generally, metal is used as the liquid-forming agent.
The metal forms droplets of a liquid alloy with the
grown and/or solid substrate. The droplets dissolve
material from the vapor phase. These materials diffuse
to the liquid–solid interface and precipitate out to form
nanowires or whiskers. The kinetics and mechanism of
VLS growth has been studied in detail by Givargizov
[50].
Review of different approaches to VLS growth
There are a number of approaches reported for VLS
growth of nanowires or whiskers. Chemical vapor
deposition (CVD) has been mainly used for VLS
growth of whiskers in its early stage of investigation
mainly focused on Si and Ge at high growth tempera-
ture ranging from 950 to 1200°C and using Au, Pt, and
Au–Pt alloy as liquid forming agents [51–55]. At such
high growth temperature, the diameter of whiskers
range from 1 to 140 lm.
Ruda et al. have reported on growth of Si nanowires
using VLS-CVD using Au as the mediating solvent at
low temperature from 320 to 600°C[56]. It has been
shown that Si nanowires with diameter as small as
10 nm can be grown at low temperature and high
partial pressure.
Hiruma et al. [57–59] have grown III–V group
semiconductor whiskers such as GaAs and InAs using
metalorganic CVD (MOCVD) based on VLS mecha-
nism and using Au as catalyst at growth temperature of
450–500°C. It has been found that the whiskers grown
using CVD [60] and MOCVD [57, 58] are tapered, this
is because of the high lateral growth on the sidewall of
the whiskers due to the high pressure growth conditions.
Lieber et al. [61–64] extended the VLS growth
mechanism for nanowire growth of a broad range of
semiconductors including III–V and II–VI groups using
laser ablation. Using this method, nanowires with
diameter as small as 3 nm can be obtained. There is
also no tapering effect in the nanowires. Since a target
containing both the growth material and the metal for
catalyst agent is used, precision control of length and
composition of compound semiconductors, particularly
those with more than two elements, becomes difficult.
Ruda et al. [65, 66] have reported on VLS growth of
semiconductor nanowires using MBE in ultra-high
vacuum conditions. In VLS-MBE approach, the lateral
growth of nanowires is dramatically suppressed
because of the limited availability of source materials
on the side walls due to the strong directionality of the
source beams of MBE. Figure 12 shows condensed and
well-oriented GaAs nanowires grown on GaAs (100)
substrates. It has been shown that the nanowires are
single crystal with homogenous diameter along wire
axis as shown in Fig. 13. Most of the VLS-grown
nanowires grow along < 111 > direction. It has also
been shown that a small percentage of defect-free
nanowires grow along < 110 > direction.
Diameter and site control
Control of nanowire diameter is an important issue.
There are three factors can be used to control the
diameter, namely, growth temperature, vapor–solid
deposition rate which also depends on the growth
temperature, and size of catalyst particles. For a given
size of catalyst particle, the volume of the droplet of
liquid alloy is given by the phase diagram. More
materials can be dissolved in the droplet at a higher
temperature. This results in bigger droplets and
therefore larger diameter nanowires. Higher vapor–
solid deposition rate results in higher lateral growth
rate on sidewalls of the nanowires and thus larger
diameter nanowires. This is particularly serious for
CVD and MOCVD growth of nanowires because of
the inherent high growth pressure conditions. For a
given temperature, smaller sized particles give smaller
droplets and thus smaller nanowire diameters. Indeed,
this is part of the current motivation for studies of MSI
as a means of patterning nanoscale droplets—see
Sect. 2 for more details on this technique.
Diameter-controlled synthesis of Si nanowires has
been demonstrated by depositing well-defined Au na-
noclusters on Si substrates using CVD growth [67].
Fig. 12 A scanning electron microscope image of GaAs nano-
wires grown on a (001) GaAs substrate
108 Nanoscale Res Lett (2006) 1:99–119
123
A clear correlation between the size of Au nanoclus-
ters and the size of resulting Si nanowires has been
found. The disparity of Si nanowires is limited only by
the dispersity of Au nanoclusters. Ohlsson et al. [60]
demonstrated another method for synthesis of size-
controlled GaAs nanowires by depositing size-selected
gold aerosol particles on a GaAs (111)B substrate
using CVD. The Au particles are created by evapora-
tion or condensation method and charged by UV light.
The particles are size selected by a differential mobility
analyzer, which classifies the sizes of charged aerosol
particles by balancing their air resistance against their
mobility in an electric field. Shimada et al. [68] have
demonstrated the control of the size of nanowhiskers
by artificially changing the Au droplet size by tuning
the Au deposition. The minimum diameter can be as
small as 10 nm by reducing the Au deposition, how-
ever, the density of Au droplets also decreases.
Another important issue for nanowire growth is the
site controlling. This is necessary for integration of
nanowire technology with semiconductor component
technology for device applications. Ohlsson et al. have
demonstrated site controlled placement of nanowires
by manipulating the Au particles on the substrate using
atomic force microscopy [69]. Sato et al. [68, 70] have
reported the site controlled growth of GaAs whiskers
on GaAs substrates by depositing Au through SiO
2
mask window formed by electron-beam lithography.
When the window size increases, the number of whis-
kers grown inside the window increases.
Planar nanowhisker arrays have also been grown
using characteristic growth of GaAs nanowires along
[111]B direction [71]. The growth starts with creating a
step with {111}B sidewall by patterning using photoli-
thography followed by wet etching. SiO
2
is deposited
on the substrate except the GaAs step side. Au is
deposited on sidewalls of steps without SiO
2
mask.
GaAs whiskers are grown on the sidewalls of steps
using MOCVD. Growth of lateral nanowire bridging
between two parallel sidewalls of steps has also been
demonstrated [72].
Site-controlled processing for nanowire growth
using AFM or electron beam lithography is, however,
high-cost, time-consuming and low-throughput. Ruda
and coworkers [65] have demonstrated a method for
size- and site-control growth of nanowires. In this
method, a nano-channel alumina (NCA) with highly
ordered pores is used as a template to define the size
and site of Au dots for nanowire growth. Fig. 14
illustrates the process flow for preparing ordered
nanowires with a template. Au is deposited through the
template. Highly ordered Au dot arrays are obtained
on a substrate after etching away the NCA template.
Fig. 14 Schematic illustration of the process flow chart for the
preparation of ordered arrays of nanowires using a nano-channel
alumina (NCA) template
Fig. 13 Low magnification
(a) and high resolution (b)
transmission electron
microscope images of a GaAs
nanowire
Nanoscale Res Lett (2006) 1:99–119 109
123
Figure 15 shows the prepared NCA template and Au
dot array deposited through the NCA template.
GaAs nanowires are grown on GaAs substrates with
highly ordered Au dot array using MBE. Figure 16
shows FE-SEM images of a highly ordered GaAs
nanowire array. The diameter distribution of nano-
wires grown using NCA template is about three times
narrower than that without NCA as shown in Fig. 17.It
has been demonstrated that highly ordered nanowire
arrays with very narrow size distribution can be grown
using NCA templates.
Doping, p–n junctions, heterostructures
and superlattices
It is important to use conventional semiconductor
technologies such as doping, p–n junction formation,
and forming heterostructures and superlattices, to
prepare semiconductor nanowire devices. Cui et al.
[73] demonstrated the doping of single crystal silicon
nanowires using CVD, by incorporating B
2
H
6
in the
SiH
4
gas stream. Two-terminal, gate dependent elec-
trical measurements showed that the resulting silicon
nanowires were p-type. N-type of doping of silicon
nanowires was also demonstrated using phosphorus as
the dopant. GaAs nanowire p–n junctions have been
demonstrated by Haraguchi et al. [74]. N-type doping
of ~1 · 10
18
cm
–3
was achieved for GaAs nanowires
using MOCVD and using di-silane as the dopant spe-
cies. Carbon doping was also demonstrated with a
Fig. 15 A plan-view scanning electron microscope image of a
nano-channel alumina (NCA) template (a) and associated array
of gold dots (b) formed by evaporation through the template
Fig. 16 Scanning electron microscope images of an ordered
array of GaAs nanowires in plan view (a) and side view (b)
grown using a nano-channel alumina (NCA) template
Fig. 17 The diameter distribution of nanowires grown without
(a) and using a nano-channel alumina (NCA) template (b): solid
lines are a Gaussian curve fit to the distribution data
110 Nanoscale Res Lett (2006) 1:99–119
123
p-type doping concentration of ~8 · 10
18
cm
–3
. InAs/
InP 1-D heterostructures in nanowhiskers have been
grown using CVD by sequential switching of sources
followed by a procedure including growth interruption
[75]. GaAs/GaP superlattices within nanowires were
grown by repeated modulation of vapor-phase reac-
tants during the growth of nanowires, using laser
ablation of solid targets [69]. Single crystal Si/SiGe
superlattice nanowires have also been grown in a
quartz furnace tube using a combination of pulsed laser
ablation and CVD [76]. During the growth, a gas
mixture of H
2
and SiCl
4
was continuously introduced
into the reaction tube, while the SiGe alloy layers in
the superlattice were obtained by repeated ablation of
a Ge target by periodically switching on and off the
laser beam.
Beside the heterostructures formed by axial com-
position modulation, it is also possible to form het-
erostructures by radial composition modulation.
Lauhon and coworkers have reported on the synthesis
of Ge/Si core-shell nanowire heterostructures [77]. In
their growth, a Si nanowire core was first grown on an
oxidized Si substrate in a quartz tube using CVD and
silane as the source species. A Ge shell was then
deposited upon these nanowires. The radial growth
rate for the shell growth was enhanced by placing the
growth substrate downstream to favor un-catalysed
lateral growth, and where the thermal decomposition
of reactants increases as the gas flows through the
furnace.
Core-shell heterostructured GaN/ZnO nanowires
have also been grown by epitaxial casting of a GaN
shell on to a ZnO nanowire core using VLS-CVD
growth [78]. Single crystal GaN nanotubes have been
formed by subsequently removing the ZnO core
nanowire by thermal reduction and evaporation.
Solution phase synthesis
Synthesis from aqueous solution
Vayssieres et al. [79–81] have reported on a method to
synthesize nanorods and nanowires from aqueous
solutions. This method originated from experimental
monitoring of water-oxide interfacial thermodynamics
and following nucleation, growth, and aging processes
by means of chemical and electrostatic control of the
interfacial free energy. The control of interfacial free
energy in a system can be achieved by controlling
precipitation and dispersion conditions, and allowing
the generation of well-defined and well-ordered
nanorods and nanowires on various substrates. ZnO
nanorods and nanowires have been prepared by the
thermal decomposition of methenamine and zinc ni-
trate in aqueous solution at temperature of ~90°C. The
diameter of the nanorods is controlled by changing the
interfacial free energy chemically by changing the
concentration of the precursors. Nanorods and nano-
wires of iron oxide have been prepared from an
aqueous solution of ferric salts heated in a regular oven
at 100°C for up to 24 h, followed by an additional heat
treatment in air at ~390°C. The size of nanowires is
adjusted by electrostatically controlling the interfacial
free energy, which is obtained by controlling the pH
and ionic strength.
Solvo-thermal synthesis
Solvo-thermal synthesis method is based on the solvo-
thermal chemical reactions at elevated temperatures
and pressures. Heath et al. pioneered the solvo-ther-
mal synthesis of semiconductor nanowires [82]. They
synthesized Ge nanowires with diameters ranging from
7 to 30 nm and lengths of up to 10 lm by reducing
GeCl
4
and phenyl-GeCl
3
by sodium metal in an
alkane-solvent, heated and pressurized at 275°C and
100 atmospheres. Various nanorods and nanowires
such as SiC, CdWO
4
, InAs, CdS, and CdSe were later
synthesized later using the solvo-thermal method [83].
The products are often characterized by low yield, low
purity and poor uniformity in size and morphology.
Solution–liquid–solid (SLS) growth
Analogous to VLS growth, semiconductor nanowires
can also be synthesized in solution using metallic par-
ticles as growth seeds [84–86]. In this so called SLS
growth mode, metallic droplets are formed on the
substrate in the solution, and growth materials dissolve
into the droplets at the solution–liquid interface.
Semiconductor materials are precipitated from the
droplets and form nanowires. Buhro et al. [84]
reported on the growth of III–V semiconductor nano-
wires such as InP, InAs and GaAs, using the SLS
mechanism, in which nanoparticles of low melting
temperature metals or alloys such as In or Al
x
Ga
1-x
alloys are used as catalysts and the organo-metallic
reactions for nanowire growth are conducted at low
temperatures of ~203°C in hydrocarbon solvents.
Semiconductor polycrystalline fibres or near single
crystal whiskers of InP, InAs, and GaAs, with diame-
ters of 10–150 nm and lengths of up to several
micrometers have been produced. For conventional
and ambient-pressure solutions, metallic seed particles
with eutectic temperatures exceeding the boiling tem-
perature of the solvent can not be used.
Nanoscale Res Lett (2006) 1:99–119 111
123
Although nanowires can be grown using SLS with
low melting point seed particles, at a temperature
below the boiling point of conventional solvents, the
quality and yield of the resulting nanowires are gen-
erally not sufficiently high for device applications.
Hanrath and Korgel [86] used organic-monolayer-
protected metallic particles to grow semiconductor
nanowires using SLS in pressurized supercritical solu-
tion at high temperature. Si and Ge nanowires have
been grown using alkanethiol-capped gold nanocrystals
in supercritical hexane with silicon (diphenylsilane)
and germanium precursors at 500°C and 30 bar, and
375°C and 20 MPa, respectively. Bulk quantities of
defect-free nanowires with diameters ranging from 4 to
30 nm and length of several micrometers have been
obtained using this method.
Properties and applications of 1-D nanostructures
As the size of the nanostructures decrease, the energy
spectrum or density of states (DOS) changes from a
continuum of states into a discrete set of quantized
states. The DOS is a strong function of the spatial
dimensions. Figure 18 shows the variation of the DOS
with changing quantization dimension. Many unique
physical properties of nanowires can be related to their
state spectrum and the appearance of discrete energy
states and a sharp distribution of DOS as their size
diminishes.
Electronic properties
Electron transport in nanowires has attracted a great
deal of interest. In order to characterize the electronic
properties of nanowires, a important first step is to
align the nanowires on to patterned electrodes. Huang
et al. [87] have reported an approach to align nano-
wires using fluid flows, with separation and spatial
location, readily controlled. Parallel and crossed arrays
of nanowires have been demonstrated with single and
sequential crossed flows of fluid.
To characterize p–n, p–p, and n–n junctions, p- and
n-type silicon nanowires have been dispersed in ace-
tone and deposited sequentially on to an oxidized Si
substrate. Contacts to the silicon nanowires were
defined by electron beam lithography. Cui and Lieber
have measured the electronic properties of those
junctions and observed the current rectification of the
junctions which is similar to bulk semiconductor junc-
tions [88].
Optical properties
As an example of studies of the optical properties of
nanowires, we discuss research on ZnSe nanowires.
The work reported to date has been rather limited [89–
92]. It has been found that it is particularly difficult to
obtain perfectly stoichiometric ZnSe nanowires and
unless the growth conditions are optimized to minimize
the deviations from stoichiometry, the resulting nano-
wires contain too high a concentration of defects to be
of use in light-emitting applications. Small deviations
from stoichiometry can be detected only by very sen-
sitive techniques and photoluminescence (PL) is one
such technique. Most of the work on room temperature
PL spectra of ZnSe nanowires shows that the spectrum
consists of two characteristic emission peaks—the near
band edge emission (NBE) at 463 nm (2.68 eV) [91]
and a broad deep level (DL) emission at ~500–680 nm
(1.8–2.48 eV) [93]. The DL emissions are usually
associated with dislocations, stacking faults and non-
stoichiometric defects [94–96]. The intensity of the
NBE emission depends strongly on the growth method
[91] and is much weaker than the DL emission. In
some cases, the NBE emission is even absent [89, 92].
In Ref. 91, where the ZnSe nanowires were fabricated
by MOCVD, it was shown that the intensity ratio of
Fig. 18 A schematic
illustration of the density of
states (DOS) distribution in a
bulk semiconductor (a), in a
semiconductor nanowire (b)
and a semiconductor
quantum-dot (c): note that by
forming a heterostructure
within a one-dimensional (1-
D) nanostructure (or
nanowire), one can create a
three dimensionally confined
region (or quantum-dot)
112 Nanoscale Res Lett (2006) 1:99–119
123
the NBE to the DL emissions were strongly dependent
on the pressure of growth. The maximum intensity
ratio was found for an optimal pressure, but at this
pressure the yield of nanowires was a minimum.
Hence, it becomes imperative to look for methods
where we can have good yield of nanowires with high
optical quality. We were able to demonstrate that post-
growth treatment of ZnSe nanowires permits one to
obtain nanowires dominated by NBE emission as
shown in Fig. 19.
Time-resolved terahertz (THz) spectroscopy can
also be used to study the optical and transport prop-
erties of nanowires [97]. As an example, Fig. 20 shows
the results from an optical pump—THz probe experi-
ment on an array of GaAs nanowires (Fig. 20a). The
optical pump beam was comprised of 400 nm, 100 fs
laser pulses from a frequency-doubled Ti:sapphire
amplifier laser system (running at a repetition rate of
1 kHz). The normalized negative differential trans-
mission (– DT) of the THz probe pulse as a function of
delay time with respect to the pump pulse is shown in
Fig. 20b, and is representative of the transient photo-
conductivity in the nanowires [97]. The decay time of
the signal becomes longer at higher fluences, most
likely due to trap-filling effects that increase the carrier
relaxation times in the nanowires. The inset in Fig. 20b
shows bi-exponential fits to the normalized transient
signals of the form – DT = A
1
exp( – t/s
1
)+A
2
exp
(– t/s
2
), where the initial fast decay time s
1
varies from
about 4 to 13 ps as the average pump power increases
from 0.5 to 3 mW, with a corresponding increase in s
2
from 50 to 180 ps. The fast decay time s
1
could be due
to initial trapping at surface states on the nanowires.
Studies of the THz polarization anisotropy of the
nanowires are currently underway.
Low dimensional laser structures
Arakawa et al. first proposed a new type of laser using
low dimensional structures as an active layer [98]. The
400 450 500 550 600 650 700
0
500
1000
1500
2000
2500
Amplitude (arb. units)
Amplitude (arb. units)
λ (nm)
λ (nm)
λ (nm)
As grown
400 500 600 700
0
2000
4000
6000
Amplitude (arb. units)
Anneal for 30 mins
400 450 500 550 600 650 700
0
1000
2000
3000
4000
5000
6000
7000
8000
Anneal for 45 mins
(a)
(c)
(b)
Fig. 19 Photoluminescence spectrum of ZnSe nanowires at room temperature: (a) as-grown nanowires, (b) after annealing in a Zn-rich
atmosphere at 650°C for 30 min, and (c) after annealing in a Zn-rich atmosphere at 650°C for 45 min
Nanoscale Res Lett (2006) 1:99–119 113
123
threshold current of the laser is predicted to be lower
and less temperature sensitive. Asada et al. have the-
oretically studied the gain of the quantum-well, quan-
tum-wire, and quantum-dot (QD) lasers [99]. They
found that the shape of gain spectra become sharper
with increasing quantization dimension and the peak
gain increase with increasing quantization dimension.
Semiconductor nanowire lasers
Semiconductor nanowires form natural laser cavities.
Nanowire nanolaser of wide band-gap semiconductor
ZnO has been demonstrated by Yang et al. at room
temperature in ultraviolet [100]. Lasing with sharp
peak and rapid increase of intensity occurs as the
excitation intensity exceeds a threshold of about
40 kW/cm
2
. The lasing threshold is quite low as com-
pared with reported values of about 300 kW/cm
2
for
random lasing in disordered particles or thin films
[101].
Lieber et al. have demonstrated electronically dri-
ven single-nanowire lasers [102]. A n-type CdS nano-
wire is assembled onto p-type Si electrodes to form a
n-CdS/p-Si heterostructure. The n-type CdS nanowire
forms the cavity of the laser. At low injection current,
the emission spectrum shows a broad peak. Very sharp
peaks emerge as the injection current exceeds the
threshold current of about 200 lA.
An optical microcavity is an indispensable compo-
nent that can provide the necessary feedback for the
build-up of oscillations in a semiconductor laser. Nor-
mally, an optical cavity is formed by two end mirrors.
A structure called a distributed Bragg reflector (DBR)
has been used to enhance the end reflectivity of optical
cavities in surface emitting lasers [103], where alter-
native high and low refractive index materials form a
1-D periodic structure called a DBR mirror, having
high reflectivity for a selected wavelength. Alterna-
tively, a mechanism called distributed feedback (DFB)
[104, 105] has been widely used in semiconductor la-
sers, where a 1-D periodic structure is embedded to
induce Bragg diffraction, resulting in a standing wave
composed of two counter-propagating waves. The
above two structures (i.e., DBR and DFB cavities) can
be viewed as a 1-D photonic crystal cavity with the
advent of the concept of photonic crystals
(PCs)—these are artificial structures with a periodic
spatial variation of dielectric constant [106, 107]. Ow-
ing to the occurrence of a full photonic band gap
(where the light in all the directions can not propagate
in the PCs), it is feasible to implement optical micro-
cavities with intentionally introduced defects, similar
to the concept of a DBR cavity, where the periodic
structure surrounding the defect acts like DBR mir-
rors. Due to the small group velocity around the band
edge [108, 109] and an effective total internal reflection
(TIR) condition at the boundary, as analyzed in Ref. 8,
microcavities operating around the band edge (without
the introduction of defects) can have high-Q values,
similar to the concept of a DFB cavity. Despite the
similarity, PC microcavities can be extended to 2-D
and 3-D, to yield confining and coupling mechanism
unattainable in traditional 1-D structures.
We found that PCs consisting of semiconductor
nanowire arrays grown by VLS are excellent candi-
dates for photonic elements and devices, such as
microcavities, due to the high dielectric constant con-
trast and high aspect ratio [110]. In addition, it is easy
Fig. 20 Scanning electron microscope image of an array of
GaAs nanowires (a), and associated optical pump—THz probe
transient photoconductivity data in (b). The THz data in (b)
shows the normalized change in transmission of the THz pulse
through the sample as a function of delay time with respect to
400 nm, 100 fs pump pulses at various fluences. The inset is a
semi-log plot of the same data showing bi-exponential fits to the
decay dynamics, as discussed in the text
114 Nanoscale Res Lett (2006) 1:99–119
123
to control the crystal structure by patterning the metal
catalysis, and the versatility of composition modulation
of nanowires (including II–VI, III–V, and ternary III–
V) makes the integration of optical components in
diversified wavelength ranges possible. Plane wave
expansion (PWE) and finite difference time domain
(FDTD) techniques allow one to study the optical
properties of nanowire based PCs. It was found that
arrays consisting of nanowires with radius at or below
the edge of the effective single-wire confining range for
a stand alone Fabry–Perot cavity can still form a high-
Q value cavity with single mode operation. As shown
in Fig. 21, the light is confined in the nanowire array
both in the plane of periodicity and in the vertical
direction. A 3-D FDTD calculation gives the Q value
for the mode in a band edge cavity in Fig. 21a as 18,000
and for a defect cavity in Fig. 21b as 1800 [111]. The
mode volume for the defect mode is about 1.7 (k/n)
3
.
The nanowire array based PC microcavity laser may
extend state-of-art 1-D DBR and DFB lasers into 2-D
ones with a working range from the ultraviolet to near
infrared. In addition to microcavities, we are currently
investigating the waveguide in the line defect of
nanowire PCs and the propagation behavior in the
pass bands. We found that around certain regions of
the pass bands, it is possible to implement negative
Fig. 21 Illustration of the
space structures of nanowire
array based photonic crystal
cavities and the cross-section
of the mode in these cavities
as calculated using a 3D finite
difference time domain
calculation. The black lines
shown in the vertical cross-
section indicate the
confinement in this direction
(see Ref. 111)
Nanoscale Res Lett (2006) 1:99–119 115
123
refraction devices such as lenses with these nanowire
arrays, which will be discussed in another paper. With
these optical components, such as microlasers, wave-
guides, sharp benders, beam splitters and lens, nano-
wire array based PC may provide a platform for dense
optical integration. Recently, III–V nanowires have
been reported to epitaxially and vertically grow on
silicon substrates [112]. On-chip dense optical inte-
grated photonic circuits with nanowire array PCs may
be realized on silicon substrates with this technique,
which would be a promising method to enable the
interconnection between silicon-based electronics and
photonics.
Ultrashort optical pulse generation
Sources of ultrashort optical pulses are attractive for
many photonic applications such as telecommunica-
tions, imaging, and sensing. Optical sources based on
semiconductor materials offer attractive features such
as compact size, low cost, and high efficiency. Using the
technique of mode-locking, powerful short pulses with
sub-picosecond durations can be obtained from semi-
conductor-based systems [113]. A key requirement of
mode-locking for the generation of ultrashort pulses is
a broad gain bandwidth. Asymmetric quantum-wells
(QWs) can further broaden the gain bandwidth of a
semiconductor laser structure which is desirable for
applications that require broadband wavelength tun-
ing. Figure 22 shows the conduction band profile of an
InGaAs asymmetric QW active region that has been
fabricated using molecular beam epitaxy. The InGaAs
QWs have a thickness of 6 nm and transition
wavelengths of 965 and 995 nm. Mode-locking the
semiconductor lasers in an external cavity has gener-
ated optical pulses with durations of 2.0–3.9 ps that can
be tuned over 61 nm [114].
We also fabricated mode-locked QW diode lasers
producing short picosecond pulses at a wavelength of
1080 nm [115]. The active region of these devices has
been engineered to overlap with the gain region of a
ytterbium-doped fibre. Semiconductor optical amplifi-
ers (SOAs) with good performance have also been
demonstrated in this wavelength range. Figure 23
depicts a schematic of the setup used for short pulse
generation and amplification. A key feature of the
SOA is that it contains a flared waveguide which
improves gain saturation and energy extraction aspects
of the amplifier. Pulses 5 ps in duration with a central
wavelength of approximately 1080 nm have been
amplified to an average power of 50 mW. The ampli-
fied pulses exhibit a frequency chirp that can be
partially compensated using pulse compression tech-
niques. A modified dual-grating compressor has been
used to temporally reduce the amplified pulse width
from 5 ps to 520 fs, yielding a pulse peak power of over
40 W. Figure 24 shows an intensity autocorrelation
Fig. 22 Schematic illustration of the conduction band edge
profile of the active region of a compositionally asymmetric
quantum-well (QW) laser. Note: the thickness axis is not drawn
to scale
Fig. 23 External cavity mode-locked semiconductor oscillator
coupled to a flared-waveguide Semiconductor optical amplifier
(SOA). Adapted from [116] with permission
Fig. 24 Second order intensity autocorrelation traces of the
amplified and compressed pulse. The quoted pulse widths in the
figure are the FWHM of the autocorrelation trace. Assuming a
hyperbolic-secant-squared pulse shape, the compressed pulse
duration is 520 fs
116 Nanoscale Res Lett (2006) 1:99–119
123
trace of the pulse train following amplification and
compression. The compressed pulses are still a factor
of 2.5 above their Fourier transform limit, indicating
the need for higher order dispersion compensation.
Seeding a Yb:fibre amplifier with pulses from the diode
laser oscillator, or oscillator and SOA combination,
will provide powerful ultrashort pulses with variable
repetition rate and excellent beam quality. This hybrid
technology approach could prove of interest for a
number of applications.
Research on mode-locked diode lasers in a number
of laboratories has resulted in improved performance
characteristics such as higher output power, shorter
pulse duration, and enhanced beam quality. Innovative
semiconductor waveguide structures [117] have
resulted in record mode-locked peak powers as high as
1.4 kW from an all-semiconductor system [118]. Work
has also progressed in the development of vertical
external cavity mode-locked semiconductor lasers.
Such devices are capable of delivering ultrashort pulses
with excellent beam quality [119]. An area of research
that has received much interest recently is that of
nanostructured laser active regions. Novel laser struc-
tures containing quantum-wires and QDs can offer a
number of potential advantages over QW designs. In
particular, QD lasers have received considerable
attention in terms of future perspectives [120]. Fur-
thermore QD lasers exhibit features that are of interest
for mode-locking applications, and a number of mode-
locked lasers containing QD active regions have
already been fabricated. Thompson et al. discuss the
advantages in their report on a colliding pulse mode-
locked QD semiconductor laser operating at a wave-
length of 1:1 lm[121]. Kuntz et al. achieved Fourier-
limited short picosecond pulses at 1:3 lm wavelength
and a repetition rate of 50 GHz [122]. Finally, high
power ultrashort pulses with a duration as short as
400 fs have been obtained by Rafailov et al. directly
from a mode-locked two-section QD laser operating at
1260 nm [123]. It is clear that mode-locked semicon-
ductor laser sources based on quantum-wire or QD
materials show potential for deployment in a variety of
linear and nonlinear photonic devices.
Photodetectors
The detection of long-wavelength (e.g., 10 lm) infrared
radiation requires a semiconductor with small band
gap (i.e., as low as 0.1 eV). HgCdTe is commonly used
as the detector material due to its high responsibility.
However, there are difficulties in epitaxial growth and
processing of this II–VI semiconductor material
resulting in low yield and ultimately high cost.
Quantum wells are also used as infrared photodetector
materials using intersubband optical transitions in
quantum wells as the detection mechanism. However,
the quantum efficiency of such quantum-well infrared
photodetectors (QWIPs) is much lower than that of
HgCdTe. QDs are also used for infrared photodetec-
tors using optical transitions between bound states in
the conduction/valence bands [113–118]. The potential
advantages of QD infrared photodetectors are antici-
pated due to a reduction in the relaxation rates
between the confined states leading to increased
detection efficiency and increased sensitivity to normal
incident photoexcitation as a result of breaking polar-
ization selection rules. Nanowire photodetectors in
ultraviolet have been demonstrated using ZnO nano-
wires as the detector material [119]. Individual ZnO
nanowires are highly insulating in the dark with a
resistivity above 3.5 MW cm. The nanowire resistivity
decreases by 4–6 orders of magnitude when the nano-
wires are exposed to ultraviolet light.
Conclusions
In this article, the synthesis, properties and applica-
tions of nanowires were reviewed. Approaches to both
the direct synthesis and also patterning were discussed
with a view to forming both organized systems of
nanowires, as well as random distributions of nano-
wires on substrates that can serve directly or indirectly
as the basis for forming nanophotonic devices. We
discussed a number of potential nanophotonic device
opportunities including those in the emission and
detection of light. We showed how unique opportuni-
ties can arise when one combines the ability to position
and control the growth of high quality organized
nanowire structures. An example of the latter was that
of nanowire cavity structures possessing high Q
and
relatively small mode volume, suitable for efficient
next generation laser systems. Clearly such 1-D nano-
structures are highly promising for next generation
nanophotonic devices and systems.
Acknowledgements The authors gratefully acknowledge finan-
cial support from CIPI and NSERC.
References
1. S. Dobrin, X. Lu, F.Y. Naumkin, J.C. Polanyi, J.S.Y. Yang,
Surf. Sci. 573(2), L363 (2004)
2. D.E. Brown, D.J. Moffat, R.A. Wolkow, Science 279, 542
(1998)
3. S. Dobrin, K.R. Harikumar, J.C. Polanyi, Surf. Sci. 561,11
(2004)
Nanoscale Res Lett (2006) 1:99–119 117
123
4. E.P. Marsh, T.L. Gilton, W. Meier, M.R. Schneider, J.P.
Cowin, Phys. Rev. Lett. 61, 2725 (1988)
5. X.L. Zhou, J.M. White, Surf. Sci. 241, 259 (1991)
6. St. J. Dixon-Warren, E.T. Jensen, J.C. Polanyi, J. Chem.
Phys. 98, 5938 (1993)
7. Q.Y. Yang, W.N. Schwarz, P.J. Lasky, S.C. Hood, N.L. Loo,
R.M. Osgood Jr., Phys. Rev. Lett. 72, 3068 (1994)
8. H. Xu, R. Yuro, I. Harrison, Surf. Sci. 411, 303 (1998)
9. K.A. Khan, N. Camillone III, R.M. Osgood Jr., J. Phys.
Chem. B103, 5530 (1999)
10. G.G. Totir, Y. Le, R.M. Osgood Jr., J. Phys. Chem. B109,
8452 (2005)
11. C.A. Schmuttenmaer, C.C. Miller, J.W. Herman, J. Cao,
D.A. Mantell, Y. Gao, R.J.D. Miller, Chem. Phys. 205,91
(1996)
12. P. Petroff, A. Gossard, W. Wiegmann, Appl. Phys. Lett. 45,
620 (1984)
13. T. Fukui, H. Saito, Appl. Phys. Lett. 50, 824 (1987)
14. M. Miller, H. Weman, C. Pryor, M. Krishnamurthy,
P. Petroff, H. Kroemer, L. Merz, Phys. Rev. Lett. 68, 3464
(1992)
15. S. Hara, J. Ishizaki, J. Motohisa, T. Fukui, H. Hasegawa,
J. Crystal Growth 145, 692 (1994)
16. J. Ishizaki, S. Goto, M. Kishida, T. Fukui, H. Hasegawa,
Jpn. J. Appl. Phys. 33, 721 (1994)
17. F. Laruelle, F. Lelarge, Z. Wang, T. Me
´
lin, A. Cavanna,
B. Etienne, J. Crystal Growth 175/176, 1087 (1997)
18. T. Kato, T. Takeuchi, Y. Inoue, S. Hasegawa, K. Inoue,
H. Nakashima, Appl. Phys. Lett. 72, 465 (1998)
19. T. Ota, K. Maehashi, J. Christen, K. Oto, K. Murase,
H. Nakashima, Physica E11, 228 (2001)
20. S. Francoeur, A. Norman, A. Mascarenhas, E. Jones, J. Reno,
S. Lee, D. Follstaedt, Appl. Phys. Lett. 81, 529 (2002)
21. R. No
¨
tzel, N. Ledentsov, L. Da
¨
weritz, K. Ploog, M. Ho-
henstein, Phys. Rev. B45, 3507 (1992)
22. H. Omi, T. Ogino, Appl. Phys. Lett. 71, 2163 (1997)
23. W. Tsang, A. Cho, Appl. Phys. Lett. 30, 293 (1997)
24. E. Kapon, M. Tamargo, D. Hwang, Appl. Phys. Lett. 50, 347
(1987)
25. R. Bhat, E. Kapon, J. Werner, D. Hwang, N. Stoffel,
M. Koza, Appl. Phys. Lett. 56, 863 (1990)
26. S. Koshiba, H. Noge, H. Akiyama, T. Inoshita, Y. Nakam-
ura, A. Shimizu, Y. Nagamune, M. Tsuchiya, H. Kano, H.
Sakaki, K. Wada, Appl. Phys. Lett. 64, 363 (1994)
27. S. Simhony, E. Kapon, E. Colas, D.M. Hwang, N. Stoffel, P.
Worland, Appl. Phys. Lett. 59, 2225 (1991)
28. W. Tribe, M.J. Steer, D. Mowbray, M. Skolnick, A. For-
shaw, J. Roberts, G. Hill, M. Pate, C. Whitehouse, G.
Williams, Appl. Phys. Lett. 70, 993 (1997)
29. W. Tribe, M. Steer, A. Forshaw, K. Schumacher, D. Mow-
bray, D. Whittaker, M. Skolnick, J. Roberts, G. Hill, Appl.
Phys. Lett. 73, 3420 (1998)
30. E. Kapon, F. Reinhardt, G. Biasiol, A. Gustafsson, Appl.
Surf. Sci. 123/124, 674 (1998)
31. M. Steer, D. Mowbray, M. Skolnick, W. Tribe, A. Forshaw,
D. Whittaker, J. Roberts, A. Cullis, G. Hill, M. Pate, C.
Whitehouse, Physica E2, 949 (1998)
32. R. No
¨
tzel, M. Ramsteiner, J. Menniger, A. Trampert, H.
Scho
¨
nherr, L. Da
¨
weritz, K. Ploog, J. Appl. Phys. 80, 4108
(1996)
33. K. Robbie, M.J. Brett, J. Vac. Sci. Technol. A15, 1460
(1997)
34. K. Robbie, G. Beydaghyan, T. Brown, C. Dean, J. Adams,
C. Buzea, Rev. Sci. Instr. 75, 1089 (2004)
35. K. Kaminska, T. Brown, G. Beydaghyan, K. Robbie, Appl.
Opt. 42, 4212 (2003)
36. K. Kaminska, M. Suzuki, K. Kimura, Y. Taga, K. Robbie, J.
Appl. Phys. 95, 3055 (2004)
37. M.O. Jensen, M.J. Brett, Opt. Expr. 13, 3348 (2005)
38. K. Kaminska, K. Robbie, Appl. Opt. 43, 1570 (2004)
39. T. Karabacak, J.P. Singh, Y.P. Zhao, G.C. Wang, T. Lu,
Phys. Rev. B68, 125,408 (2003)
40. C. Buzea, G. Beydaghyan, C. Elliott, K. Robbie, Nano-
technol. 16, 1986 (2005)
41. G. Beydaghyan, K. Kaminska, T. Brown, K. Robbie, Appl.
Opt. 43, 5343 (2004)
42. K. Robbie, M.J. Brett, D.J. Broer, Nature 399, 764 (1999)
43. K.E. Gilbertson, W.H. Finlay, C.F. Lange, M.J. Brett,
D. Vick, Y.S. Cheng, Aerosol. Sci. 36, 933 (2005)
44. I. Hodgkinson, Q.H. Wu, M. Arnold, L. De Silva, G. Bey-
daghyan, K. Kaminska, K. Robbie, Appl. Opt. 45, 1563
(2006)
45. C. Buzea, K. Robbie, K. Kaminska, G. Beydaghyan,
T. Brown, C. Elliott, C. Dean, J. Vac. Sci. Technol. B23,
2545 (2005)
46. K. Kaminska, A. Amassian, L. Martinu, K. Robbie, J. Appl.
Phys. 97, 013511–1 (2005)
47. A.L. Barabasi, H.E. Stanley, Fractal Concepts in Surface
Growth (Cambridge University Press, 1995)
48. R. Wagner, W. Ellis, Appl. Phys. Lett. 4, 89 (1964)
49. R. Finkelman, R. Larson, E. Dwornik, J. Crystal Growth,
22, 159 (1974)
50. E. Givargizov, J. Crystal Growth 31, 20 (1975)
51. G. Bootsma, H. Gassen, J. Crystal Growth 10, 223 (1971)
52. E. Givargizov, J. Crystal Growth 20, 217 (1973)
53. J. Weyher, Mater. Sci. Eng. 20, 171 (1975)
54. J. Weyher, M. Surowiec, J. Crystal Growth 43, 245 (1978)
55. J. Weyher, J. Crystal Growth 43, 235 (1978)
56. J. Westwater, D. Gosain, S. Tomiya, S. Usui, H. Ruda,
J. Vac. Sci. Technol. B15, 554 (1997)
57. K. Hiruma, M. Yazawa, K. Haraguchi, K. Ogawa, J. Appl.
Phys. 74, 3162 (1993)
58. K. Hiruma, M. Yazawa, T. Katsuyama, K. Ogawa, M. Ko-
guchi, H. Kakibayashi, J. Appl. Phys. 77, 447 (1995)
59. A. Viswanath, K. Hiruma, T. Katsuyama, Superlat. Micro-
struct. 14, 105 (1993)
60. B. Ohlsson, M. Bjo
¨
rk, M. Magnusson, K. Deppert,
L. Samuelson, L. Wallenberg, Appl. Phys. Lett. 79, 3335
(2001)
61. A. Morales, C. Lieber, Science 279, 208 (1998)
62. J. Hu, T. Odom, C. Lieber, Acc. Chem. Res. 32, 435 (1999)
63. X. Duan, C. Lieber, Adv. Mater. 12, 298 (2000)
64. X. Duan, J. Wang, C. Lieber, Appl. Phys. Lett. 76, 1116
(2000)
65. Z. Wu, X. Mei, D. Kim, M. Blumin, H. Ruda, Appl. Phys.
Lett. 81, 5177 (2002)
66. Z. Wu, X. Mei, D. Kim, M. Blumin, H. Ruda, J. Liu, K.
Kavanagh, Appl. Phys. Lett. 83, 3368 (2003)
67. Y. Cui, L. Lauhon, M. Gudiksen, J. Wang, C. Lieber, Appl.
Phys. Lett. 78, 2214 (2001)
68. T. Shimada, K. Hiruma, M. Shirai, M. Yazawa, K. Harag-
uchi, T. Sato, M. Matsui, T. Katsuyama, Superlat. Micro-
struct. 24, 453 (1998)
69. M. Gudiksen, L. Lauhon, J. Wang, D. Smith, C. Lieber,
Nature 415, 617 (2002)
70. T. Sato, K. Hiruma, M. Shirai, K. Tominaga, K. Haraguchi,
T. Katsuyama, T. Shimada, Appl. Phys. Lett. 66, 159 (1995)
71. K. Haraguchi, K. Hiruma, T. Katsuyama, K. Tominaga,
M. Shirai, T. Shimada, Appl. Phys. Lett. 69, 386 (1996)
72. K. Haraguchi, K. Hiruma, K. Hosomi, M. Shirai,
T. Katsuyama, J. Vac. Sci. Technol. B15, 1685 (1997)
118 Nanoscale Res Lett (2006) 1:99–119
123
73. Y. Cui, X. Duan, J. Hu, C. Lieber, Phys. Chem. 104, 5213
(2000)
74. K. Haraguchi, T. Katsuyama, K. Hiruma, K. Ogawa, Appl.
Phys. Lett. 60, 745 (1992)
75. M. Bjo
¨
rk, B. Ohlsson, T. Sass, A. Persson, C. Thelander, M.
Magnusson, K. Deppert, L. Wallenberg, L. Samuelson,
Appl. Phys. Lett. 80, 1058 (2002)
76. Y. Wu, R. Fan, P. Yang, Nano Lett. 2, 83 (2002)
77. L. Lauhon, M. Gudiksen, D. Wang, C. Lieber, Nature 420,
57 (2002)
78. J. Goldberger, R. He, Y. Zhang, S. Lee, H. Yan, H. Choi,
P. Yang, Nature 422, 599 (2003)
79. L. Vayssieres, N. Beermann, S. Lindquist, A. Hagfeldt,
Chem. Mater. 13, 233 (2001)
80. L. Vayssieres, K. Keis, A. Hagfeldt, S. Lindquist, Chem.
Mater. 13, 4395 (2001)
81. L. Vayssieres, Adv. Mater. 15, 464 (2003)
82. J. Heath, F. LeGoues, Chem. Phys. Lett. 208, 263 (1993)
83. K. Tang, Y. Qian, J. Zeng, X. Yang, Adv. Mater. 15, 448
(2003)
84. T. Trentler, K. Hickman, S. Goel, A. Viano, P. Gibbons,
W. Buhro, Science 270, 1791 (1995)
85. H. Yu, W. Buhro, Adv. Mater. 15, 416 (2003)
86. T. Hanrath, B. Korgel, Adv. Mater. 15, 437 (2003)
87. Y. Huang, X. Duan, Q. Wei, C. Lieber, Science 291, 630
(2001)
88. Y. Cui, C. Lieber, Science 291, 851 (2001)
89. Y. Zhu, Y. Bando, Chem. Phys. Lett. 377, 367 (2003)
90. X.T. Zhang, K.M. Ip, Z. Liu, Y.P. Leung, Q. Li, S.K. Hark,
Appl. Phys. Lett. 84, 2641 (2004)
91. X.T. Zhang, K.M. Ip, Z. Liu, Y.P. Leung, Q. Li, S.K. Hark,
J. Appl. Phys. 95, 5752 (2004)
92. B. Xiang, H.Z. Zhang, G.H. Li, F.H. Yang, F.H. Su, R.M.
Wang, J. Xu, G.W. Lu, X.C. Sun, Q. Zhao, D.P. Yu, Appl.
Phys. Lett. 82, 3330 (2003)
93. S. Fujita, H. Mimoto, T. Naguchi, J. Appl. Phys. 50, 1079
(1979)
94. X.B. Zhang, K.L. Ha, S.K. Hark, Appl. Phys. Lett. 79, 1127
(2001)
95. V.P. Makhnii, I.V. Tkachenko, J. Opt. Technol. 70(9), 665
(2003)
96. K.M. Ip, Z. Liu, C.M. Ng, S.K. Hark, Nanotechnology 16,
1144 (2005)
97. D.G. Cooke, F.A. Hegmann, Y.I. Mazur, W.Q. Ma,
X. Wang, Z.M. Wang, G.J. Salamo, M. Xiao, T.D. Mishima,
M.B. Johnson, Appl. Phys. Lett. 85, 3839 (2004)
98. Y. Arakawa, H. Sakaki, Appl. Phys. Lett. 40, 939 (1982)
99. M. Asada, Y. Miyamoto, Y. Suematsu, IEEE J. Quantum
Electron. QE-22, 1915 (1986)
100. M. Huang, S. Mao, H. Feick, H. Yan, Y. Wu, H. Kind,
E. Weber, R. Russo, P. Yang, Science 292, 1897 (2001)
101. H. Cao, J. Xu, D. Zhang, S. Chang, S. Ho, E. Seelig, X. Liu,
R. Chang, Phys. Rev. Lett. 84, 5584 (2000)
102. X. Duan, Y. Huang, R. Agarwal, C. Lieber, Nature 421, 241
(2003)
103. T. Baba, T. Hamano, F. Koyama, K. Iga, IEEE J. Quant.
Electron. 27, 1347 (1991)
104. H. Kogelnik, C. Shank, Appl. Phys. Lett. 18, 152 (1971)
105. I.P. Kaminow, H.P. Weber, E.A. Chandross, Appl. Phys.
Lett. 18, 497 (1971)
106. S. John, Phys. Rev. Lett. 58, 2486 (1987)
107. E. Yablonovitch, Phys. Rev. Lett. 58, 2059 (1987)
108. J.P. Dowling, M. Scalora, M.J. Bloemer, C.M. Bowden,
J. Appl. Phys. 75, 1896 (1994)
109. K. Sakoda, K. Ohtaka, T. Ueta, Opt. Express 4, 481 (1999)
110. T. Xu, S. Yang, S.V. Nair, H.E. Ruda, Phys. Rev. B72,
045,126 (2005)
111. T. Xu, S. Yang, S.V. Nair, H.E. Ruda, Proc. SPIE 5971, 262
(2005)
112. T. Martensson, C.P.T. Svensson, B.A. Wacaser, M.W.
Larsson, W. Seifert, K. Deppert, A. Gustafsson, L.R. Wal-
lenberg, L. Samuelson, Nano Lett. 4, 1987 (2004)
113. P. Vasil’ev, Ultrafast Diode Lasers (Artech House Nor-
wood, MA, 1995)
114. M.J. Brennan, J.N. Milgram, P. Mascher, H.K. Haugen,
Appl. Phys. Lett. 81, 2502 (2002)
115. M.J. Brennan, A.J. Budz, B.J. Robinson, P. Mascher, H.K.
Haugen, IEEE Photon. Technol. Lett. 16, 1798 (2004)
116. A.J. Budz, M.J. Brennan, H.K. Haugen, Conference on
Lasers and Electro-optics (San Francisco, CA, 2004), paper
CTuP6
117. S. Gee, G. Alphonse, J. Connolly, P.J. Delfyett, IEEE J.
Select. Topics Quantum Electron, 4, 209 (1998)
118. K. Kim, S. Lee, P.J. Delfyett, Opt. Express, 13, 4600 (2005)
119. S. Hoogland, A. Garnache, I. Sagnes, J.S. Roberts, A.C.
Tropper, IEEE Photon. Technol. Lett. 17, 267 (2005)
120. D. Bimberg, J. Phys. D: Appl. Phys. 38, 2055 (2005)
121. M.G. Thompson et al Electron. Lett. 41, 248 (2005)
122. M. Kuntz et al New J. Phys. 6, 181 (2004)
123. E.U. Rafailov et al Appl. Phys. Lett. 87, 081,107 (2005)
124. S. Komiyama, O. Astafiev, V. Antonov, T. Kutsuwa,
H. Hirai, Nature 403, 405 (2000)
125. A. Yakimov, A. Dvurechenskii, A. Nikiforov, Y. Prosku-
ryakov, J. Appl. Phys. 89, 5676 (2001)
126. J. Phillips, J. Appl. Phys.
91, 4590 (2002)
127. S. Tong, J. Liu, J. Wan, K. Wang, Appl. Phys. Lett. 80, 1189
(2002)
128. D. Kuo, Y. Chang, Phys. Rev. B67, 353,131 (2003)
129. H. Kind, H. Yan, B. Messer, M. Law, P. Yang, Adv. Mater.
14, 158 (2002)
Nanoscale Res Lett (2006) 1:99–119 119
123