Báo cáo hóa học: " A solid-phase dot assay using silica/gold nanoshells" pptx
Bạn đang xem bản rút gọn của tài liệu. Xem và tải ngay bản đầy đủ của tài liệu tại đây (252.23 KB, 6 trang )
NANO EXPRESS
A solid-phase dot assay using silica/gold nanoshells
Boris Khlebtsov Æ Lev Dykman Æ Vladimir Bogatyrev Æ
Vladimir Zharov Æ Nikolai Khlebtsov
Published online: 17 November 2006
Ó to the authors 2006
Abstract We report on the first application of silica-
gold nanoshells to a solid-phase dot immunoassay. The
assay principle is based on staining of a drop (1 ll)
analyte on a nitrocellulose membrane strip by using
silica/gold nanoshells conjugated with biospecific prob-
ing molecules. Experimental example is human IgG
(hIgG, target molecules) and protein A (probing
molecules). For usual 15-nm colloidal gold conjugates,
the minimal detectable amount of hIgG is about 4 ng.
By contrast, for nanoshell conjugates (silica core
diameter of 70 nm and gold outer diameter of
100 nm) we have found significant increase in detec-
tion sensitivity and the minimal detectable amount of
hIgG is about 0.5 ng. This finding is explained by the
difference in the monolayer particle extinction.
Keywords Colloidal gold Á Silica/gold nanoshells Á
Solid-phase immunoassay
Introduction
The solid-phase immunoassays are based on adsorp-
tion of antigens onto a solid substrate followed by
binding of adsorbed target molecules with biospecific
labels. For instance, ELISA [1] technique uses anti-
bodies conjugated with enzymes to detect antigens
adsorbed onto inner sides of microtitration plates. It is
well known that the reliability of ELISA analyses can
only be ensured by application of a special equipment
and standard microplates and reagents [2]. In modified
versions of solid-phase immunoassays, the microtitra-
tion plates are replaced with nitrocellulose membrane
filters [3] or siliconized matrices [4] to adsorb various
antigens. In the membrane version, the solid-phase
immunoassay can be called ‘‘dot-immunoassay’’ as
usually a drop of analyte is deposited into center of a
5 · 5-mm delineate square and the reaction outcome
looks like a colored dot. The simplicity of analyses and
the saving of antigens and reagents allow one to
implement the solid-phase immunoassays in the labo-
ratory, field, or even domestic circumstances [5]to
detect proteins (Western blotting) [6], DNA (Southern
blotting) [7], or RNA (Northern blotting) [8].
In 1984, four independent publications [9] reported
on using colloidal gold particles as labels for solid-
phase immunoassay. The application of colloidal gold
conjugates is based on visual detection of biospecific
binding between adsorbed antigens and functionalized
particles due to intense red color of markers [10]. In
the ‘‘golden’’ dot-immunoassay, various biospecific
B. Khlebtsov Á V. Bogatyrev Á N. Khlebtsov (&)
Lab of Nanoscale Biosensors, Institute of Biochemistry and
Physiology of Plants and Microorganisms, Russian
Academy of Sciences, 13 Pr. Entuziastov, Saratov 410049,
Russia
e-mail:
V. Bogatyrev Á N. Khlebtsov
Saratov State University, 155 Moskovskaya St,
Saratov 410026, Russia
L. Dykman
Immunotechnology Group, Institute of Biochemistry and
Physiology of Plants and Microorganisms, Russian
Academy of Sciences, 13 Pr., Entuziastov, Saratov 410049,
Russia
V. Zharov
Philips Classic Laser Laboratories, University of Arkansas
for Medical Sciences, 4301 W Markham, Little Rock, AR
72206, USA
Nanoscale Res Lett (2007) 2:6–11
DOI 10.1007/s11671-006-9021-9
123
recognizing molecules can be used, including immuno-
globulins [11, 12], Fab- and scFv antibody fragments
[13], protein A [10], lectins [14], enzymes [15], strep-
tavidin or antibiotin antibodies [16], etc. The colloidal
gold conjugates have been applied to diagnostics of
parasite [17], virus [18], and fungus [19] diseases,
tuberculosis [20], melioidosis [21], syphilis [22], bru-
cellosis [23], shigellosis, and other enteric bacterial
infections [24], myocardial infarction [25], early preg-
nancy [26], species identification of bloodstains [27],
dot-blot hybridization [28], and serotyping of soil
bacteria [29].
In spite its attractive simplicity and efficiency, the
colloidal gold dot-immunoassay is not free of draw-
backs such as moderate sensitivity and long time of
detection. Last years, various new types of nanoparti-
cle structures have been suggested [30], including gold
nanorods [31] and silica/gold nanoshells [32]. In
particular, the silica/gold nanoshells have been used
in analytical diagnostics [33], photothermal therapy
[34], and optical visualization of cancer cells [35]. Here
we report on the first, to the best of our knowledge,
application of silica/gold nanoshells to a solid-phase
dot assay in which the nanoshells are used as color
markers for biospecific staining of a drop analyte
placed on a nitrocellulose membrane strip. Other steps
of dot assay technology being retained, the simple
replacement of 15–30 nm gold nanospheres by silica/
gold nanoshells results in dramatic (from four- to eight-
fold) increase in the detection sensitivity.
Experimental section
For experiments presented in this paper, 15-nm colloi-
dal gold nanospheres were prepared by Frens citrate
reduction protocol [10], whereas gold nanoshells were
fabricated as described in Ref. [36] with minimal
modifications concerning concentration and amount of
reagents. The extinction and elastic light scattering (at
90°) spectra of silica core and final nanoshell particles
were measured as described previously [37] by using a
Specord M 40 spectrophotometer equipped with a
special attachment for differential light scattering
spectroscopy measurements. To evaluate the silica
core and nanoshell diameter distributions, we used the
dynamic light scattering (DLS) setup described in Ref.
[38]. The DLS setup includes a He–Ne laser
(k = 633 nm, 10 mW/mm
2
), GO-5 goniometer (here
the scattering angle was equal to 90°), the temperature
control unit (±0.1°C), and a 288-chanel real-time
correlator PhotoCor-SP (PhotoCor, Russia). The auto-
correlation functions of scattered intensity fluctuations
were measured with sample time 10
–5
c for 1200 c. To
solve the inverse DLS problem [39], we used the
DynaLS algorithm [40]. In these experiments, we first
evaluated the silica core size distributions. Then, after
synthesis of gold nanoshells, the outer diameter distri-
butions were measured. The gold shell thickness
distribution can be obtained by subtraction of the shell
and core size distributions.
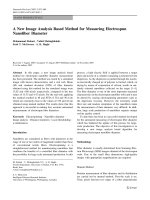
Figure 1 shows an example of silica core and outer
particle diameter distributions (Fig. 1a), as well as the
measured and calculated light scattering spectra
(Fig. 1b). Theoretical calculations were carried out by
a multilayer Mie algorithm [41] with using the spectral
dependence of water, silica, and gold dielectric func-
tions as described in Ref. [42] (the bulk gold dielectric
function was modified to account for the scattering of
electrons at gold shell boundaries [42, 43]). Close
agreement between the measured and calculated light
scattering and extinction (not shown) spectra gives
evidence for reliability of DLS nanoshell structure
parameters.
As an example of biospecific molecular binding,
we chose the human IgG (hIgG, Sigma, USA) and
protein A (Sigma) pair. Protein A is a staphylococcal
cell-wall protein that can interact, with a high affinity
constant, with the Fc fragment of the IgG molecule.
Each protein A molecule can bind at least two IgG
molecules [44]. Two types of conjugates, CG-
15 nm + ProteinA and NS-70/100 nm + Protein A
were compared in our dot assay experiments. Des-
ignation CG-15 nm means 15-nm (in diameter) gold
nanospheres, whereas symbol NS-70/100 nm stands
for silica (70 nm in diameter)/gold (100 nm outer
diameter) nanoshells.
Let us discuss first the general principles behind
optical monitoring of nanoparticle functionalization. It
is well known [45, 46] that each colloidal gold particle
has a Au
0
core and a Au
I
shell due to incomplete
reduction at the nanoparticle surface. Citrate and
chloride ions are coordinated to the Au
I
shell. So,
each gold particle is net anionically charged and thus
the gold sol is stabilized by electrostatic repulsion
forces. The addition of an electrolyte (e.g., 0.1% NaCl)
to a 15-nm gold colloid will result in a decrease in the
average interparticle distance because of charge
screening effects. Therefore, when NaCl salt is added
to a 15-nm gold colloid, the particles aggregate and the
colloid color turns from red to blue. The physical origin
of pronounced changes in sol color and in extinction
spectra is the strong electrodynamic interaction of gold
particles, caused by their close proximity [47]. This not
only serves as a simple demonstration of the charged
nature of the particles but also shows how one can
Nanoscale Res Lett (2007) 2:6–11 7
123
optically monitor the particle surface functionalization.
Indeed, the addition of protein A to the 15-nm gold sol
and the attachment of protein A molecules to the
particle surface results in steric stabilization [48]of
particles that now do not aggregate after addition of
the same electrolyte quantity. Therefore, the polymer
stabilization of gold nanoparticles against the salt
aggregation can be considered as a direct indication
of biopolymer modification of the colloidal gold
particle surface. In the case of silica/gold nanoshells,
the optical monitoring is not as evident as in the case of
small solid gold particles. The reason is that the colors
of nonaggregated (stabilized) and aggregated sols are
similar. Nevertheless, the extinction spectra of the
initial, functionalized, and aggregated nanoshells can
be used for quantitative optical control of nanoparticle
functionalization. In this work, the surface protein A
functionalization of silica/gold nanoshells was verified
by the minor spectral salt-induced changes of stabilized
particles, by the positive interaction with complemen-
tary analyte (hIgG) molecules in solid-phase
dot-immunoassay, and by the absence of interaction
with a negative control (BSA).
The protocol for obtaining CG-15 nm + Protein A
conjugates, which includes preparation and purification
of an aqueous probe solution, determination of the
‘‘gold number’’ (minimum amount of protein that
protects the sol against salt aggregation), attachment of
the probe to the label, addition of a secondary
stabilizer, concentration of the marker, and optimiza-
tion of the end product, was described in detail
elsewhere [10]. The resonance optical density A
515
of
15-nm gold sol at 515 nm was adjusted to 1 (the sol
thickness equals 1 cm). This solution has the following
parameters: the particle extinction and scattering cross
sections are C
ext
ðk ¼ 515 nmÞ’1:6 Â10
2
nm
2
and
C
sca
ðk ¼ 515 nmÞ’0:5nm
2
, respectively, the particle
number concentration N ’ 1:4 Â10
12
cm
À3
,and
the total surface of all particles in 1 cm
3
S ¼ NpR
2
’ 2:5cm
2
. To obtain conjugates, 10 lgof
protein A was added to a 1 ml of 15-nm gold sol. This
amount of protein stabilizes sol against addition of
NaCl (the final salt concentration is about 1%).
The resonance optical density A
630
of nanoshell sol
was equal to 1.4. Taking into account the DLS
geometrical parameters of nanoshells, we obtain the
extinction C
ext
ðk ¼ 630 nmÞ’6:8 Â 10
4
nm
2
and scatter-
ing C
sca
ðk ¼ 630 nmÞ’4:2 Â10
4
nm
2
cross sections, the
particle number concentration N ’ 0:5 Â10
10
cm
À3
,
and the total surface of all particles in 1 cm
3
S ¼ NpR
2
’ 0:4cm
2
. Virtually the same particle con-
centration was determined by relating the measured
optical density of 70-nm silica nanospheres and their
calculated extinction cross section C
ext
ðk ¼ 500 nmÞ’
3:1nm
2
. As the total particle surface was significantly
less than that in the case of 15-nm gold nanospheres,
we assumed that the addition of 10 lg of protein A to a
1 ml of nanoshell sol should also stabilize it against salt
aggregation. The absence of salt-induced aggregation
can be controlled by absence of significant changes in
extinction and scattering spectra after addition of salt.
We do observed the stabilization of nanoshell conju-
gates against salt, and this finding can be considered as
strong evidence for the attachment of protein A
molecules to nanoshell surface. It can be assumed that
the attachment of protein A to gold nanoshells is
controlled by electrostatic interaction at the corre-
sponding buffer conditions, according to the generally
accepted mechanism for adsorption of other biopoly-
mers to colloidal gold particles [10].
The dot assay was carried out on nitrocellulose
membranes (0.45 lm pore size; Schleicher & Schuell,
Germany). One microliter drops of the assay material
(hIgG; Sigma, USA) were spotted onto a nitrocellulose
filter in the center of drawn 5 · 5-mm squares, and the
membranes were held in a dry-air thermostat at 60°C
for 15 min. Note that the size of a dot on the
membrane strip is determined by the volume of analyte
and by the membrane property, but not by the analyte
concentration. In our experimental conditions (1 ll
40 60 80 100 120 140
Particle diameter (nm)
0
0.2
0.4
0.6
0.8
1
Particle number fraction
a
500 600 700 800 900
Wavelength (nm)
0
2
4
6
Scattering intensity, a.u.
SiO
2
/Au (70/100) nm
b
Fig. 1 (a) Particle diameter
distributions measured by
DLS method for silica core
(white column) and silica/gold
nanoshells (black columns).
(b) Calculated (solid line) and
measured (dashed line,
circles) light scattering
spectra of 70/100 nm silica/
gold nanoshells
8 Nanoscale Res Lett (2007) 2:6–11
123
analyte drops), the dot sizes were about 4–5 mm. After
spotting, the filters were incubated for 30 min at room
temperature in a blocking buffer (0.1% PEG,
M
w
= 20,000, Sigma, USA; 150 mN NaCl, and 20 mM
TrisHCl, pH 8.2). This procedure prevents non-specific
adsorption.
To detect hIgG, the nitrocellulose strip, after treat-
ment as above, was placed in a parafilm envelope and
was incubated in solutions of the CG-15 nm + Protein
A or NS-70/100 nm + Protein A conjugates for 1 h at
room temperature. The reaction outcome was the
development of red or blue-gray spots at 5 min after
adding the marker. The color of the spots intensified
gradually over a period of 1 h. The strips were then
removed and rinsed in water. Thereafter, they could be
stored as long as was wished, without changes in
staining intensity.
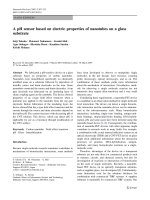
Figure 2 shows the results of dot assays with usual
colloidal gold particles (Fig. 2a) and silica/gold nano-
shells (Fig. 2b). The color of spots reflects the color of
marker solutions. The first spot corresponds to 0.5 lg
hIgG amount and other spots (first and second rows)
were obtained by double dilutions so that the final spot
corresponds to 0:5 lg=2
11
’ 0:2ng of hIgG. The third
row shows negative control with nonspecific BSA
molecules taken at the same concentration as hIgG.
Note that no staining occurred for spots with nonspe-
cific BSA molecules. In the case of colloidal gold
conjugates, the minimal detectable quantity of hIgG
equals C
min
CG
¼ 0:5 lg=2
7
’ 4ng. By contrast, in the case
of nanoshell conjugates, the minimal detectable quan-
tity of hIgG lies between C
min
NS
¼ 0:5 lg=2
ð9À10Þ
’ð0:5 À1Þng. Thus, a simple replacement of 15-nm
gold nanospheres with 100-nm gold nanoshells results
in dramatic increase in the dot assay sensitivity and the
minimal detectable amount of hIgG molecules is about
0.5 ng.
Discussion
To give some insight into possible mechanisms behind
observed difference in detection sensitivity, we first
note that the minimal detectable analyte quantity does
not depend on the concentration of probing markers
although the concentration of markers affects the
staining kinetics (data of our unpublished observa-
tions). This observation means that the main limiting
factor for detection sensitivity is the amount of analyte
sites available for biomolecular binding with recogniz-
ing molecules (protein A) attached to the particle
surface. Let us suppose that the detection sensitivity at
lowest analyte concentrations is determined by the
single-particle extinction properties provided that
there is some kind of proportionality between the
available sites and number of specifically adsorbed
markers. Then, by comparing the above extinction
coefficients, one could expect the significant (about
4 · 10
2
) increase in the detection sensitivity, which is at
odds with our experimental data.
Another explanation may be an assumption that the
detection limit corresponds to the single-layer assem-
bling of markers and the ratio of detection sensitivity
can be determined by equation
s s
NS
CG
¼
N
rmNS
ads
C
NS
ext
N
CG
ads
C
CG
ext
¼
Q
NS
ext
Q
CG
ext
ð1Þ
where N
ads
CG
and N
ads
NS
are the numbers of single-layer
adsorbed colloidal gold spheres and nanoshells, respec-
tively; Q
ext
is the extinction efficiency defined as the
ratio of the extinction and geometrical cross sections.
For resonance wavelengths, Eq. 1 predicts the estimate
s ’ 8:6=0:9 ’ 9:5 in excellent agreement with our
experimental observations.
Finally, we would like to discuss some points
related to optimal properties of nanoparticles that
may be used in the solid-phase dot immunoassay. In
principle, the silica/gold nanoshells are not the only
nanoparticle platform for analogous dot assays and
the similar experiments may be still feasible with
b
a
Fig. 2 Dot assay with colloidal gold (a) and nanoshell (b)
conjugates. One microliter drops of hIgG (initial concentration
0.5lg/ml, sequential double dilutions 1:2
n
) were spotted onto a
nitrocellulose filter in the center of drawn 5-mm squares. No
staining occurs for the bovine serum albumin (BSA) that was
used as negative control
Nanoscale Res Lett (2007) 2:6–11 9
123
other core materials, e.g. polystyrene/gold nanoshells
[49]. However, in our opinion, the silica/gold nano-
shells are the most convenient plasmon-resonant
markers due to easy and reproducible preparation
technology.
The next point concerns the core/shell geometrical
parameters. Our choice (70/100 nm) can be considered
as a compromise between the aggregation stability of
nanoshells, their optimal optical properties, and func-
tionalization ability. The nano-sized spherical SiO
2
cores can be easily fabricated using the Sto
¨
ber method
[50] with diameters ranging from 50–70 nm to 500 nm.
On the other hand, the minimal gold shell thickness is
usually about 15–20 nm [36]. Thus, the minimal outer
diameter of nanoshells is about 100 nm. The extinction
cross section of such nanoshells is more than two
orders higher as compared to 15-nm colloidal gold
spheres and in contrast to 100-nm solid gold spheres
such particles do not sediment within 1–2 h. Further-
more, we have found that NS-70/100-nm nanoshells
can be covered by protein A molecules without any
chemical procedures, i.e. by using simple mixing of
nanoshells and protein A solutions. One may assume
that other core/shell structures with close (core diam-
eter)/(shell thickness) ratios can be used as dot
immunoassay markers. However, this point seems to
be the subject of a separate special study.
With an increase in the gold shell thickness (or the
shell/core ratio), the optical properties of nanoshells
approach those for solid spheres. From this point of
view, if the core/shell particles are replaced by pure
gold particles with the same size, we also can expect an
enhancement of the detection sensitivity in comparison
with 15-nm colloidal gold particles. At present, there
exist several technologies for controlled preparation of
solid gold nanoparticles in a wide range of sizes
(including 100–120-nm particles) [51]. However, the
practical use of such large solid spheres may be
inconvenient because of high sedimentation rate and
unclear ability for functionalization through the simple
adsorption route.
Finally, we note that the solid-phase dot-immuno-
assay can be considered a semi-quantitative technique,
at least in its present form, as the assay allows one to
determine of a minimal analyte quantity from a series
of double dilutions. Nevertheless, we believe that the
dot color intensity can be correlated with the analyte
amount within a certain (possibly narrow) concentra-
tion range. To find a correlation between the analyte
concentration and the color intensity, one needs to
have an instrumental quantitative approach to
measuring the color intensity. In our opinion, such a
project could be realized in the future.
Conclusion
To summarize, we have shown that the silica gold
nanoshells can be functionalized by the simple adsorp-
tion without any chemical derivation of attached
molecules (tiol-, amine-, etc.). The functionalized
nanoshells, being used as biospecific markers in dot
immunoassay, reveal significantly high sensitivity com-
pared to usual gold nanospheres. This experimental
finding is in excellent agreement with a theoretical
model based on comparison of the extinction cross
sections of monolayer assembled markers. Although
we have studied only one experimental biospecific pair
(hIgG + protein A), the similar strategy could be
possibly used for the detection of other target mole-
cules. As it has been pointed out in the introduction
section, the colloidal gold dot-immunoassay has been a
well-known technique since 1984 [9]. However, to the
best of our knowledge, this work can be considered
the first report on the dot-immunoassay based on silica/
gold nanoparticles rather than on colloidal gold
markers.
Acknowledgments This research was partially supported by
grants from RFBR (Nos.05-02-16776, 04-04-48224), the targeted
program ‘‘Research of cooperative and non-linear phenomena in
light transport through mesascopic media as applied to
development of diagnostical techniques in biology, medicine
and industry’’ (No. RNP.2.1.1.4473). BK was supported by grants
from the President of Russian Federation (MK 961.2005.2),
CRDF (BRHE Annex BF4M06 Y2-B-06-08), and INTAS
Young Scientist Fellowship Grant 06-1000014-6421. VZ was
supported by grants from the National Institute of Biomedical
Imaging and Bioengineering (NIH/NIBIB, nos. EB000873 and
EB0005123).
References
1. E. Engvall, P. Perlmann, J. Immunochem. 8, 871 (1971)
2. B.S. Chessum, J.R. Denmark, Lancet 1, 161 (1978); L.J.
Kricka, T.J.N. Carter, S.M. Burt, J.H. Kennedy, R.L. Holder,
M.I. Holliday, M.E. Telford, G.B. Wisdom, Clin. Chem. 26,
741 (1980)
3. R. Hawkes, E. Niday, J. Gordon, Anal. Biochem. 119, 142
(1982)
4. T. Furuya, K. Ikemoto, S. Kawauchi, A. Oga, S. Tsunoda, T.
Hirano, K. Sasaki, J. Histochem. Cytochem. 52, 205 (2004)
5. B.C. Walton, M.G. Pappas, M. Sierra, R. Hajkowski, P.R.
Jacson, R. Custodio, Bull. P.A.H.O. 20, 147 (1986)
6. W.N. Burnette, Anal. Biochem. 112, 195 (1981)
7. E.M. Southern, J. Mol. Biol. 98, 503 (1975)
8. J.C. Alwine, D.J. Kemp, G.R. Stark, Proc. Natl. Acad. Sci.
U.S.A. 74, 5350 (1977)
9. D. Brada, J. Roth, Anal. Biochem. 142, 79 (1984); M.
Moeremans, G. Daneles, A. van Dijck, G. Langanger, J. De
Mey, J. Immunol. Meth. 74, 353 (1984); B. Surek, E. Latzko,
Biochem. Biophys. Res. Commun. 121, 284 (1984); Y H.
Hsu, Anal. Biochem. 142, 221 (1984)
10 Nanoscale Res Lett (2007) 2:6–11
123
10. L.A. Dykman, V.A. Bogatyrev, Biochemistry (Moscow) 62,
350 (1997)
11. S.R. Kimball, S.L. Rannels, M.B. Elenski, L.S. Jefferson,
Immunol. Meth. 106, 217 (1988)
12. M.V. Sumaroka, L.A. Dykman, V.A. Bogatyrev, N.V.
Evseeva, I.S. Zaitseva, S.Yu. Shchyogolev, A.D. Volodarsky,
J. Immunoassay 21, 401 (2000)
13. J.F. Hainfeld, R.D. Powell, J. Histochem. Cytochem. 48, 471
(2000); I.V. Volokhina, I.A. Sazonova, V.A. Velikov, M.I.
Chumakov, Microbiol. Research 160, 67 (2005)
14. W.P. Li, C. Zuber, J. Roth, Histochemistry 100, 347 (1993)
15. E.A. Saman, Gene Anal. Technol. 3, 1 (1986)
16. S. Tomlinson, A. Luga, E. Huguenel, N. Dattagupta, Anal.
Biochem. 171, 217 (1988)
17. Y.S. Liu, W.P. Du, Z.X. Wu, Int. J. Parasitol. 26, 127 (1996)
18. V.S. Dar, S. Ghosh, S. Broor, J. Virol. Meth. 47, 51 (1994)
19. A.C. Reboli, Clin. Microbiol. 31, 518 (1993)
20. L. Vera-Cabrera, A. Rendon, M. Diaz-Rodriguez, V. Hand-
zel, A. Laszlo, Clin. Diagn. Lab. Immunol. 6, 686 (1999)
21. M. Kunakorn, B. Petchclai, K. Khupulsup, P. Naigowit, Clin.
Microbiol. 29, 2065 (1991)
22. Q. Huang, X. Lan, T. Tong, X. Wu, M. Chen, X. Feng, R.
Liu, Y. Tang, Z. Zhu, J. Clin. Microbiol. 34, 2011 (1996)
23. T.Yu. Zagoskina, E.Yu. Markov, A.I. Kalinovskii, E.P.
Golubinskii, Zh Mikrobiol. Epidemiol. Immunobiol. (in
Russian) 6, 64 (1998)
24. L.A. Dykman, V.A. Bogatyrev, FEMS Immunol. Med.
Microbiol. 27, 135 (2000); V.A. Lazarchik, L.P. Titov, T.N.
Vorob’eva, T.S. Ermakova, O.N. Vrublevskaya, N.V. Vlasik,
Pros. Natl. Acad. Sci. of Belarus Republic, Ser. Medical
Sciences (in Russian) 3, 44 (2005)
25. H. Guo, J. Zhang, D. Yang, P. Xiao, N. He, Colloids and
Surfaces B 40, 195 (2005)
26. Z. Xu, Chung Hua I Hsueh Tsa Chih (Taipei) 72, 216 (1992)
27. S. Matsuzawa, H. Kimura, Y. Itoh, H. Wang, T. Nakagawa,
J. Forensic Sci. 38, 448 (1993)
28. A.F. Cremers, N. Jansen in de Wal, J. Wiegant, R.W. Dirks,
P. Weisbeek, M. van der Ploeg, J.E. Landegent, Histochem-
istry 86, 609 (1987)
29. V.A. Bogatyrev, L.A. Dykman, L.Yu. Matora, S.I. Schwarts-
burd, FEMS Microbiol. Lett. 96, 115 (1992)
30. M Ch. Daniel, D. Astruc, Chem. Rev. 104, 293 (2004)
31. J. Pe
´
rez-Juste, I. Pastoriza-Santos, L.M. Liz-Marza
´
n, P.
Mulvaney, Coordination Chem. Rev. 249, 1870 (2005); C.J.
Murphy, T.K. Sau, A.M. Gole, C.J. Orendorff, J. Gao, L.
Gou, S.E.; Hunyadi, T. Li, J. Phys. Chem. B 109, 13857
(2005); C. Burda, X. Chen, R. Narayanan, M.A. El-Sayed,
Chem. Rev. 105, 1025 (2005)
32. L.R. Hirsch, A.M. Gobin, A.R. Lowery, F. Tam, R.A. Drezek,
N.J. Halas, J.L. West, Ann. Biomed. Eng. 34, 15 (2006)
33. L.R. Hirsch, J.B. Jackson, A. Lee, N. Halas, J. West, Anal.
Chem. 75, 2377 (2003)
34. L.R. Hirsch, R.J. Stafford, J.A. Bankson, S.R. Sershen, B.
Rivera, R.E. Price, J.D. Hazle, N.J. Halas, J.L. West, Proc.
Natl. Acad. Sci. U.S.A. 23, 13549 (2003)
35. C. Loo, L. Hirsch, M. Lee, E. Chang, J. West, N. Halas, R.
Drezek, Opt. Lett. 30, 1012 (2005)
36. S.J. Oldenburg, R.D. Averitt, S.L. Westcott, N. Halas, Chem.
Phys. Lett. 288, 243 (1998)
37. N.G. Khlebtsov, V.A. Bogatyrev, L.A. Dykman, B.N.
Khlebtsov, M. Ya.Krasnov, J. Quant, Spectrosc. Radiat.
Transfer 89, 133 (2004)
38. B.N. Khlebtsov, E.M. Chumakov, S.V. Semyonov, M.I.
Chumakov, N.G. Khlebtsov, Proc. SPIE 5475, 12 (2004)
39. B.J. Berne, R. Pecora, Dynamic Light Scattering with
Application to Chemistry, Biology, and Physics. Dover
Publ., Mineola (2002)
40. URL:
41. N.G. Khlebtsov, J. Quant, Spectrosc. Radiat. Transfer 89,
143 (2004)
42. B.N. Khlebtsov, N.G. Khlebtsov, Proc. SPIE 6164, 11 (2006)
43. C.G. Granqvist, O. Hunderi, Phys. Rev. B 30, 47 (1978)
44. A.M. Egorov, M.M. Dikov, Mendeleev Chem. J. 27, 381
(1982)
45. H.B. Weiser, Inorganic Colloid Chemistry. Wiley, New York
(1933)
46. C.A. Mirkin, Inorg. Chem. 39, 2258 (2000)
47. N.G. Khlebtsov, A.G. Melnikov, V.A. Bogatyrev, L.A.
Dykman. Optical properties and biomedical applications of
nanostructures based on gold and silver bioconjugates, In:
Videen G, Yatskiv Ya S, Mishchenko M I (eds.), Photo-
polarimetry in Remote Sensing, NATO Science Series, II.
Mathematics, Physics and Chemistry, vol. 161, Kluwer
Academic Publishers, Dordrecht, pp. 265–308 (2004).
48. E.D. Goddard, B. Vincent (eds.), Polymer Adsorption and
Dispersion Stability(Am Chem. Soc., Washington (DC),
ACS Symp. Ser., 1984).
49. W. Shi, Y. Sahoo, M.T. Swihart, P.N. Prasad, Langmuir 21,
1610 (2005)
50. W. Sto
¨
ber, A. Fink, J. Colloid Interface Sci. 26, 62 (1968)
51. J. Kimling, M. Maier, B. Okenve, V. Kotaidis, H. Ballot, A.
Plech, J. Phys. Chem. B 110, 15700 (2006)
Nanoscale Res Lett (2007) 2:6–11 11
123