Báo cáo hóa học: "Modification of alumina matrices through chemical etching and electroless deposition of nano-Au array for amperometric sensing" pot
Bạn đang xem bản rút gọn của tài liệu. Xem và tải ngay bản đầy đủ của tài liệu tại đây (328.3 KB, 5 trang )
NANO EXPRESS
Modification of alumina matrices through chemical etching
and electroless deposition of nano-Au array for amperometric
sensing
Ar
"
unas Jagminas Æ Julijana Kuzmarskyte˙ Æ
Gintaras Valincˇius Æ Luciana Malferrari Æ
Albertas Malinauskas
Received: 29 December 2006 / Accepted: 26 January 2007 / Published online: 2 March 2007
Ó to the authors 2007
Abstract Simple nanoporous alumina matrix modifi-
cation procedure, in which the electrically highly insu-
lating alumina barrier layer at the bottom of the pores is
replaced with the conductive layer of the gold beds, was
described. This modification makes possible the direct
electron exchange between the underlying aluminum
support and the redox species encapsulated in the alu-
mina pores, thus, providing the generic platform for the
nanoporous alumina sensors (biosensors) with the
direct amperometric signal readout fabrication.
Keywords EIS Á Modification morphology Á
Nanoparticles Á Porous alumina
Introduction
Porous anodic oxide films of aluminum anodically
grown in the solutions of oxalic and/or sulfuric or
phosphoric acids have been used for decades as pro-
tection and hard coatings or adhesive layers. In recent
years these films, so-called alumina, due to their
honeycomb high-ordered and well-predetermined
structure, showing tube shaped pore array with a
center-to-center spacing from few tents to about
550 nm [1, 2] and the pore diameter from about 10 to
250 nm [3], are widely used as a host material for
fabrication nanostructured arrays of metals, [4–6]
semiconductors, [7–9] conducting polymers, [10] and
carbon tubes [11, 12]. Notably, that high-ordered
alumina matrices filled with nanowires or nanotubes of
desired material are promising candidates for catalyst,
[13] functional electrodes, [14] future sensors, [15, 16]
magnetic, [17] and optoelectronic [18, 19] devices.
Furthermore, high-ordered alumina membranes
recently have been used for detection DNA sequences
at the nmol cm
–2
level, [20] preparation of new bio-
chemical reactor systems, [21] and the synthesis of
nano-black lipid membranes [22]. The use of anodized
aluminum electrodes as support for amperometric
sensors is, however, unexplored due to high resistance
of alumina a thin scalloped barrier-oxide layer sepa-
rated the thick porous one from the metal [23] that is a
key problem. On the other hand, the development of
such system within the porous alumina matrix may lead
to construction of novel redox biosensor configura-
tions. In present paper, we describe a simple nano-
porous alumina matrix modification procedure, in
which the electrically highly insulating barrier layer at
the bottom of the pores is replaced with the gold beds.
This modification makes possible the direct electron
exchange between the underlying aluminum support
and the redox species encapsulated in the alumina
pores, thus, providing the generic platform for the
nanoporous alumina sensors (biosensors) with the
direct amperometric signal readout.
Electronic supplementary material Supplementary material is
available in the online version of this article at (doi: 10.1007/
s11671-007-9043-2) and is accessible for authorized users.
A. Jagminas (&) Á J. Kuzmarskyte˙ Á A. Malinauskas
Institute of Chemistry, Gos
ˇ
tauto 9, 01108 Vilnius, Lithuania
e-mail:
G. Valinc
ˇ
ius
Institute of Biochemistry, Mokslininku˛ 12, 08412 Vilnius,
Lithuania
L. Malferrari
Instituto Nacionale di Fisica Nucleare, viale Berti-Pichat 6/2,
40127 Bologna, Italia
123
Nanoscale Res Lett (2007) 2:130–134
DOI 10.1007/s11671-007-9043-y
Experimental details
Several different aluminum sheets, which purity ranged
from 98.0 to 99.99% (Goodfellow, Cambridge Ltd.),
were tested as precursors for the porous anodic oxide
film fabrication. The samples in the form of the flag-
shape plates (7 · 7 · 0.2) mm were annealed at 500 °C
for 3 h, chemically cleaned, rinsed, and electropolished
before use, as usually. Porous oxide films of from 3 to
10 lm thick were grown under the anodizing cell
voltage control in either an aqueous oxalic (0.3 M;
17 °C; 40 V) or phosphoric (0.04 M; 16 °C; 150 V) acid
solution. To destroy the insulating barrier oxide layer
only at the bottom of pores, several electrochemical
and chemical etching steps were used. The alumina
nanoporous layer modification included: (i) stepwise
decrease of anodizing voltage (U
a
) at the end of the
film growth down to U
a,fin
; (ii) chemical etching in a
solution of 0.5 M phosphoric acid at 30 °C for time s
w
and (iii) electroless deposition of zinc/nickel layer
in the immersion solution of zinc and nickel fluorbo-
rates (0.17 M Zn(BF
4
)
2
+ 0.87 M Ni(BF
4
)
2
+ 0.38 M
NH
4
BF
4
) at room temperature for time s
im
. The
completeness of deletion the alumina barriers at the
bottom of pores was checked after each treatment step
using scanning electron microscopy (SEM) (a Philips
30 L microscope equipped with energy dispersed X-ray
spectrometer) and electrochemical impedance spec-
troscopy (EIS). The EIS measurements were carried
out using a Solartron system that includes model 1286
potentiostat and model 1250 frequency response ana-
lyzer (Farnborough, UK). The EIS experiments were
conducted in a frequency range of 1 Hz–100 kHz, with
equal spaced data points on a logarithmic scale and
with ten measurements per decade. To avoid nonlinear
responses the amplitude of applied sinusoidal ac signal
was set to 10 mV. The spectral data were analyzed/
fitted with ZView software (Scribner Associates, South
Pines, NC, USA).
Electrochemical measurements were carried out
using a three-electrode polystyrene cell (2 ml) with a
6-mm-i.d. Kalrez
TM
O-ring, which set up the exposed
to solution surface area of the working electrode
to 0.32 ± 0.02 cm
2
. A platinum coil (~4cm
2
) and
Ag/AgCl/KCl
sat
(Microelectrodes, Inc., Bedford, NH)
were used as the auxiliary and reference electrodes,
respectively. EIS measurements were carried out at 0 V
bias versus the reference electrode at 20 ± 1 °Cin
aerated 10 mM sodium phosphate buffer (pH 7.0)
solution containing 100 mM sodium sulphate.
For backside observations of the film morphology
the alumina matrices were detached from substrate
by dissolution of aluminum as described by Li et al.
[1, 11].
Voltammetric behavior of alumina matrices was
studded using a PI 50-1 potentiostat (Belarus) inter-
faced through a home-made analogue to a digital
converter with a PC and a PR-8 programmer (Belarus).
All experiments were carried out at a temperature of
20 ± 0.2 °C in a conventional three-electrode cell. The
working electrode was either a vertical Au disc of
1cm
2
geometric area, made from a mat polycrystalline
Au sheet (99.99% purity), or alumina/nano-Au/Al of a
same geometric area. A Pt sheet 3 cm
2
in area was a
counter-electrode and a saturated potassium silver-sil-
ver chloride electrode (SCE) was used as a reference.
In order to avoid the contamination of the working
solution {5 mM K
3
[Fe{CN)
6
]+5mM K
4
[Fe(CN)
6
]}
with Cl
–
ions, the SCE was connected to the electro-
chemical cell through a 1 M KCl with agar-agar jelly
bridge. Prior to each experiment, the working solution
was deaerated with argon.
All solutions were prepared using highest purity
acids, chemically pure salts and Milli-Q water.
Reproducibility of the measurements was checked
by 3 repeated experiments.
Results and discussion
We found that the quality of perforation of alumina
matrices at the bottom of the pores and the ability to
form there well-adhered Zn/Ni layer depend strongly
on the aluminum purity as well as on the parameters of
post-treatment processes, e.g. U
a,fin
, s
w
, and s
im
.No
uniform deposition of Zn/Ni layer at the bottom of
pores was observed in the case of high purity aluminum
electrodes (>99.9%). Instead, good quality immersion
Zn layers were obtained using 99.685% purity alumi-
num (Si 0.156; Fe 0.089; Zn 0.03; Mg 0.021; Cu 0.016;
Mn, Ti, Cr and Pb 0.003 wt.%). This is consistent with
the experimental facts indicating preferable formation
of Zn/Ni immersion layer on the surfaces plate of
aluminum alloys [24].
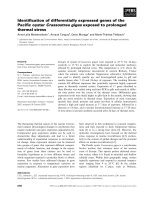
Figure 1 show the cross-sectional and backside SEM
images of the oxalic acid alumina matrices grown onto
99.685% purity aluminum at U
a
= 40 V for 1.5 h
after the perforation of alumina barriers by decreasing
U
a
down to U
a,fin
= 5.0 V and subsequent etchings in
the phosphoric acid and immersion solutions for 22 and
7 min, respectively. Notably, all these procedures lead
to the formation of alumina matrix with diameter pores
of ~ 45 nm and the interpore distance of ~ 108 nm
without detachment the porous matrix from the
Nanoscale Res Lett (2007) 2:130–134 131
123
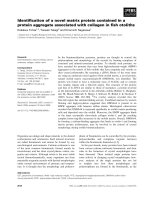
substrate. The optimal perforation conditions of the
phosphoric acid films included the gradual decrease of
the anodizing end-voltage from 150 V to U
a,fin
25–27 V
and the subsequent chemical etching steps for s
w
= 55–
65 min and s
im
= 5–7 min resulting in the fabrication
of alumina with average diameter of pores close to
200 nm and the center-to-center spacing of ~ 410 nm
(Fig. 2). Notably, all these post-anodizing procedures
lead not only to the perforation of the alumina nano-
channels but also to the deposition of a thin Zn
0
/Ni
0
immersion layer at the aluminum/solution interface at
the bottom of pores. Furthermore, seeking to cover the
bottoms of opened pores with well-adherent layer of
precious metal, gold electroless deposition process was
chosen in a 10 mM HAuCl
4
+ 50 mM MgSO
4
solution
by experimental way. The stored of alumina/Zn/Al
electrodes in this solution leads to the formation of
gold beds by the chemical exchange reaction between
the Au
3+
ions and the metallic Zn layer deposited at
the places of opened pores:
3Zn
0
+ 2Au
þ3
! 3Zn
2þ
+ 2Au
0
ð1Þ
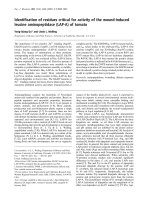
As a result of this treatment, gray color of the alu-
mina matrix acquired during zinc deposition turns into
olive signaling of the formation of the nano-Au species.
This was verified there by recording UV-Vis spectra of
the alumina matrices detached from the substrate. The
spectra in Fig. 3B show the emerging of absorbance
maximum at 535–550 nm wavelength range, charac-
teristic for gold colloids. The red-shift of the surface
plasmon resonance peak seen as the immersion time
increases confirms the growth of nano-Au particles [25]
at the bottom part of the pores. In addition, the
deposition of gold particles at the bottom of the alu-
mina pores has been also visualized by SEM images of
the matrix cross-sections (Fig. 3A) and EDX analysis
data (Fig. 3C).
To characterize the electrical properties of alumina
matrices, the EIS spectra were taken at each step of
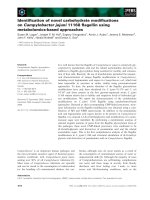
alumina formation and modification. Figure 4 depicts
typical Bode plots of the electrode admittance of the
aluminum electrode at different stages of the oxide
matrix formation and re-construction. A systematic
variation of the EIS spectra in Fig. 4 includes the
increase of electrode admittance in the low frequency
range and the shift of admittance curves towards lower
frequencies. The shift of the admittance plots indicates
the capacitance increase upon the successive steps of
alumina matrix post-treatment, which, as we believe,
considerably decreases or even fully removes the
insulating barrier. The capacitance increase is clearly
seen in the complex capacitance curves as well as in the
fitting to model [26, 27] parameters, which are pre-
sented in the Supporting Information section. The
most important result that follows from Fig. 4 is a
noticeable increase of the admittance in the low fre-
quency edge of the spectra. Particularly, the formation
of the immersion zinc layer at the bottom of the pores
yields approximately 3 fold increase, while the gold
beds formed in following stage increases the admit-
tance by approximately 25–30 times compared to the
initial admittance values of the chemically unmodified
alumina. Moreover, the EIS spectra of pure alumina
(Fig. 4, curve 1) were not significantly altered by the
addition of the redox species to the electrolyte, while
the gold-modified alumina matrices exhibited clear
sensitivity to the potassium ferrocyanide (curve 4). The
redox species especially influenced the low frequency
part of the EIS spectra, in which the weight of the
Faradaic processes contribution to the EIS signal
Fig. 1 The back-side (A) and the cross-sectional (B) SEM
images of alumina matrices grown in a solution of 0.3 M
(COOH)
2
at 40 V and 17 °C for 1.5 h onto the surface of
99.685 % purity Al followed by decrease of anodizing voltage
down to U
a,fin
= 5.0 V and subsequent etching in 0.5 M H
3
PO
4
at 30 °C for s
w
= 22 min
Fig. 2 The cross-sectional SEM image of alumina matrix grown
in a solution of 0.04 M H
3
PO
4
at 150 V and 16 °C for 2 h;
U
a,fin
= 27.0 V; s
w
= 60 min
132 Nanoscale Res Lett (2007) 2:130–134
123
becomes significant. In our case, the electrode admit-
tance at 1 Hz increased from ~50 to 150 lS (electrode
surface–0.32 cm
2
) upon injection of potassium ferro-
cyanide at concentration of 10 mM (compare curves 3
and 4). All this suggests that the alumina modification
procedures used in this work yield nanoporous elec-
trodes, on which the direct electron exchange between
the dissolved redox species and the underlying metal
becomes possible.
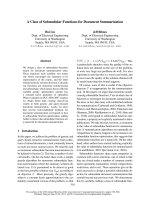
To probe the direct electron transfer rate we com-
pared the cyclic voltammetry response of the metal
gold and gold-modified alumina electrodes using ferri/
ferro cyanide redox system under the same experi-
mental conditions. Figures 5A and B illustrate typical
cyclic voltammograms (CVs) obtained in a solution of
10 mM K
3
[Fe(CN)
6
]/K
4
[Fe(CN)
6
] (1:1) using poly-
crystalline Au plate (99,9% purity) and gold-modified
alumina electrodes. As seen, the shapes of CVs are
comparable both qualitatively and quantitatively. In
particular, potential difference between cathodic and
anodic peaks DE
p
, equals ~200 mV at potential scan
rate of 50 mV/s. Similar current-potential behavior of
the bulk and nanostructured gold electrodes imply that
the rate of electron transfer reactions taking place at
both electrodes are similar. This is an important result
because it suggests that the modification route of the
nanoporous alumina surfaces presented in this work
makes available full removal of the alumina barrier
layer from the bottom of the pores.
Conclusions
Complete deletion of the alumina barrier layer only
at the bottom of the pores can be attained
through step-wise decrease of anodizing voltage,
several steps of chemical etching and electroless
deposition of nano-Au species at the bottom of
alumina pores at the aluminum/solution interface. By
this way, the low resistant nano-Au/alumina/Al
electrode for amperometric sensing was fabricated.
Fig. 3 (A) Cross-sectional SEM image of alumina matrix grown
as in Fig. 1 after the additional treatment in the Zn/Ni immersion
solution (pH 6.0) at RT for 5 min and electroless gold plating at
RT for 5 min. (B) UV-vis spectra of alumina matrices fabricated
as in (A) on the gold plating time: (1) 0; (2) 2; (3) 5; (4) 15 min.
(C) EDX spectra of alumina matrix grown and re-constructed as
in part B (curve 3)
-6
-5
-4
-3
-2
-1
0.1 10 1000 100000
Frequency, Hz
log (admittance), S
1
2
3
4
Fig. 4 Bode plots of admittance of Al/alumina electrodes within
1–100,000 Hz frequency range corresponding to different stages
of the barrier layer deletion: (1) after anodization of Al specimen
in 0.04 M H
3
PO
4
(U
a
150 V; 3.0 h; 16 °C followed by step-like
voltage decrease to U
a,fin
27.0 V and chemical pore widening for
s
w
60 min); (2) after formation of Zn
0
layer at the bottom of the
pores by immersion in a solution of Zn/Ni fluorborates for 7 min;
(3) after replacement of zinc by gold via chemical exchange
reaction; (4) the same as (3), however, the pore-filling solution
contains additionally the redox species [10 mM K
4
Fe(CN)
6
]
(vide infra). Electrode surface area exposed to the solution is
0.32 cm
2
. Temperature 20 °C
Nanoscale Res Lett (2007) 2:130–134 133
123
Notably, the fractal structure of re-constructed alu-
mina matrices results in the specific EIS response that
can be modeled by two parallel CPEs one of which
exhibits a % 1 and an another a % 0.5.
References
1. A.P. Li, F. Mu
¨
ller, A. Birner, K. Nielsch, U. Go
¨
selle, J. Appl.
Phys. 84, 6023 (1998)
2. A. Jagminas, D. Bigeliene, I. Mikulskas, R. Tomas
ˇ
i
"
unas,
J. Cryst. Growth 233, 591 (2001)
3. W. Lee, J K. Lee, Adv. Mater. 14, 1187 (2002)
4. C.R. Martin, R. Parthasarathy, V. Menon, Electrochim.
Acta. 39, 1309 (1994)
5. D. Al-Mawlawi, C.Z. Liu, M. Moskovits, J. Mater. Resp. 9,
1014 (1994)
6. C.J. Murphy, N.R. Jana, Adv. Mater. 14, 80 (2002)
7. J.D. Klein, R.D. Herrick, I.D. Palmer, M.J. Sailor, C.J.
Brumlik, C.R. Martin, Chem. Mater. 5, 902 (1993)
8. D. Xu, Y. Xu, D. Chen, G. Guo, L. Gui, Y. Tang, Adv.
Mater. 12, 520 (2000)
9. M.S. Sander, A.L. Prieto, R. Gronsky, T. Sands, A.M. Stacy,
Adv. Mater. 19(9), 665 (2002)
10. J. Joo, K.T. Park, B.H. Kim, M.S. Kim, S.Y. Lee, C.K. Jeong,
J.K. Lee, D.H. Park, W.K. Yi, G.H. Lee, K.S. Ryn, Synthetic
Metals 7–9, 135 (2003)
11. P. Li, C. Papadopoulos, J.M. Xu, M. Moskovits, Appl. Phys.
Lett. 75, 367 (1999)
12. T. Kyotani, L. Tsai, A. Tomita, Chem. Mater. 8, 2109
(1996)
13. Y. Ishikawa, Y. Matsumoto, Electrochim. Acta. 46, 2819
(2001)
14. A. Mozalev, S. Magaino, H. Imai, Electrochim. Acta. 46,
2825 (2001)
15. W.G. Yelton, K.B. Pfeifer, A.W. Staton, J. Electrochem. Soc.
149(1), H1 (2002)
16. A. Yu, Z. Liang, J. Cho, F. Caruso, Nano Lett. 3, 1203 (2003)
17. D. Al-Mawlawi, N. Coombs, M.J. Moskovits, Appl. Phys. 70,
4421 (1991)
18. C.K. Preston, M. Moskovits, J. Phys. Chem. 97, 8495 (1993)
19. I. Mikulskas, S. Juodkazis, A. Jagminas, S
ˇ
. Mes
ˇ
kinis, J.G.
Dumas, J. Vaitkus, R. Tomas
ˇ
i
"
unas, Optic. Mater. 17, 343
(2001)
20. S. Pan, L.J. Rothberg, Nano Lett. 3(6), 811 (2003)
21. Z. Wang, R.T. Haasch, G.U. Lee, Langmuir 21(4), 1153
(2005)
22. W. Ro
¨
mer, C. Steinem, Biophys. J. 86, 955 (2004)
23. J.W. Diggle, T.C. Downie, C.W. Goulding, Chem. Rev. 69,
365 (1969)
24. G. Qi, X. Chen, Z. Shao, Thin Solid Films. 406, 204 (2002)
25. S. Link, M.A. El-Sayed, J. Phys. Chem. B43, 4519 (2004)
26. A. Jagminiene, G. Valinc
ˇ
ius, A. Riaukaite, A. Jagminas, J.
Cryst. Growth 274, 622 (2005)
27. J. De Laet, H. Terryn, J. Vereecken, Electrochim. Acta. 41,
1155 (1995)
-0,2 0,0 0,2 0,4
I, mA
-4
-2
0
2
4
6
0,1 V/s
0,05 V/s
0,02 V/s
0,01 V/s
A
B
E, V
-0,2 0,0 0,2 0,4
E, V
I, mA
-4
-2
0
2
4
0,05 V/s
0,1 V/s
0,02 V/s
0,01 V/s
Fig. 5 Cyclic voltammograms of the gold plate (A) and nano-
Au/alumina/Al (B) electrodes fabricated as in Fig. 1 in a
deaerated and unstirred 10 mM K
3
[Fe(CN)
6
]/K
4
[Fe(CN)
6
] (1:1)
buffered solution (acetate buffer; pH = 6.0) on the potential scan
rate. The apparent surface area of electrodes 0.5 cm
2
134 Nanoscale Res Lett (2007) 2:130–134
123