Báo cáo hóa học: " Cross-Layer Quality-of-Service Analysis and Call Admission Control in the Uplink of CDMA Cellular Networks" potx
Bạn đang xem bản rút gọn của tài liệu. Xem và tải ngay bản đầy đủ của tài liệu tại đây (1.13 MB, 14 trang )
Hindawi Publishing Corporation
EURASIP Journal on Wireless Communications and Networking
Volume 2006, Article ID 62657, Pages 1–14
DOI 10.1155/WCN/2006/62657
Cross-Layer Quality-of-Service Analysis and Call Admission
Control in the Uplink of CDMA Cellular Networks
Chun Nie,
1, 2
Yong Huat Chew,
1
and David Tung Chong Wong
1
1
Institute for Infocomm Research, Agency for Science, Technology, and Research, Singapore 119613
2
Department of Electrical and Computer Engineering, National University of Singapore, Singapore 117576
Received 26 September 2005; Revised 16 March 2006; Accepted 26 May 2006
This paper addresses cross-layer quality-of-service (QoS) provisioning in the uplink of CDMA cellular mobile networks. Each
mobile can take up to four UMTS traffic classes in our model. At the data link layer and the network layer, the QoS performances
are defined in terms of signal-to-interference-plus-noise r a tio and outage probability, and packet loss rate and delay, respectively.
A call admission control scheme which fulfills these QoS metrics is developed to maximize the system capacity. The novelty of
this paper is that the effect of the lengthening of the on-periods of non-real-time traffic classes is investigated by using the Go-
Back-N automatic retransmission request mechanism with finite buffer size and limited number of retransmissions in the event of
transmission errors. Simulation results for a specific example demonstrate the reasonableness of the analytical formulation.
Copyright © 2006 Chun Nie et al. This is an open access article distributed under the Creative Commons Attribution License,
which permits unrestricted use, distribution, and reproduction in any medium, provided the original work is properly cited.
1. INTRODUCTION
The currently deployed universal mobile telecommunica-
tions system (UMTS) network is characterized by its abil-
ity to support multimedia communications with different bit
rates and quality-of-service (QoS) requirements. Four traf-
fic classes, conversational, streaming, interactive, and back-
ground, are defined in the UMTS QoS architecture together
with their respective QoS requirements [1]. Code division
multiple access (CDMA) is the multiple access technology
used to support the transmissions of multiclass services. In
this paper, voice, video, web-browsing, and data are used as
typical applications of these four traffic classes. Their QoS
performances in the uplink are investigated and their QoS
metrics are formulated at both the data link layer and the
packet level of the network layer.
In the literature, QoS provisioning in CDMA networks
has attracted a lot of research interests. At the data link layer,
Gilhousen et al. [2] studied the outage probability for a s in-
gle class on/off source in CDMA networks. Wong et al. [3–5]
extended the analysis of outage probability from a single class
sources to on/off multiclass sources, variable bit rate multi-
class sources, and video multiclass sources. Recently, the out-
age probabilities of multiclass multiconnection services are
investigated in [6]. At the network layer, packet loss rate and
delay performances are studied for CDMA systems [7, 8].
However, [7, 8] do not provide an analytical platform which
can b e directly applied to the QoS provisioning of practical
systems. For example, only voice and data services in single-
cell systems are considered in [7]andtrafficsourcesaresim-
ply modeled as exponential-on/exponential-off and Poisson
arrivals. Reference [8]investigatedpacketlossrateanddelay
performances in CDMA networks for voice, video, and data
services. However, analytical QoS formulation is given only
for voice services, while video and data ser vices are only ob-
tained through computer simulations.
The main contribution of this paper is an analytical for-
mulation for the QoS performances of all of the four traffic
classes jointly at both the data link and network layers. We
adopt more realistic traffic models for both real-time (RT)
and non-real-time (NRT) traffic than those in the literature.
The effect of the lengthening of the on-periods of the NRT
services is analyzed under Go-Back-N (GBN) automatic re-
transmission request (ARQ) scheme. The QoS attributes are
formulated in terms of the signal-to-interference-plus-noise
ratio (SINR) and outage probability at the data link layer, and
the average delay and packet loss rate at the network layer. A
QoS-based call admission control (CAC) scheme is also pro-
posed. The maximum system capacity satisfying all QoS re-
quirements at both the data link and network layers is com-
puted analytically.
The subsequent sections of this paper are organized as
follows. Section 2 develops a system model that describes a
cellular mobile network and establishes appropriate traffic
2 EURASIP Journal on Wireless Communications and Networking
models for the four traffic classes. In Section 3,anefficient
power control method is designed and the outage prob-
abilities at the data link layer are formulated accordingly.
Section 4 deals with the packet level QoS performances.
Section 5 presents analytical and simulation results to verify
the reasonableness of the analysis. Section 6 develops a CAC
scheme with cross-layer QoS satisfactions. Final ly, Section 7
concludes this paper.
2. SYSTEM MODEL
A cellular mobile system with multiple square cells is consid-
ered. This model is commonly adopted and referred to as the
Manhattan model [9]. A base station (BS) is located at the
center of each cell to serve a number of mobiles. Each mobile
supports multiconnection to transmit multiclass serv i ces.
The type of traffic classes is denoted by an index k,where
k
= 1forvoice,k = 2forvideo,k = 3 for web-browsing,
and k
= 4 for data, respectively. In order to evaluate the
QoS performances, appropriate traffic models are defined.
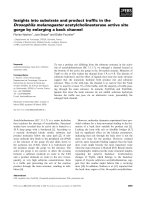
Voice and video are, respectively, modeled as an exponential-
on/exponential-off process and a two-dimensional discrete-
state continuous-time Markov chain, as shown in Figures
1(a) and 1(b).
In Figure 1(a), a voice service is modeled as a two-state
on/off birth-death process. In Figure 1(b), a video service
(k
= 2) is a variable bit ra te source and is described by
the Sen’s model [10]. Each video service can be decomposed
into one high-bit-rate (HBR) and M low-bit-rate (LBR) min-
isources. Hereafter, one HBR mini-source (k
= 2h)andM
LBR minisources (k
= 2l) will be used to replace a video ser-
vice. The activity factors, which are the probabilities that the
process stays in the on state, for the voice, LBR video, and
HBR video are, respectively, given by
p
k
=
α
k
α
k
+ β
k
, k ∈{1, 2l,2h},(1)
where 1/β
k
and 1/α
k
are, respectively, the average on and off
periods, and k
= 1forvoice,k = 2l for LBR video min-
isources, and k
= 2h for HBR video minisources, respec-
tively.
Thesourcetraffic of web-browsing and data services are
more accurately modeled as a Pareto-on/Pareto-off process
[11]. Let us denote the on and off periods of web-browsing
and data by t
on,k
and t
off ,k
, k ∈{3, 4},respectively.Theprob-
ability density functions ( pdf) of t
on,k
and t
off ,k
, k ∈{3, 4},
denoted by u
k
(t
on,k
)andv
k
(t
off ,k
), k ∈{3, 4},respectively,
are given by [12]
u
k
t
on,k
=
c
on,k
a
on,k
c
on,k
t
on,k
−c
on,k
−1
, t
on,k
≥ a
on,k
,(2)
v
k
t
off ,k
=
c
off ,k
a
off ,k
c
off ,k
t
off ,k
−c
off ,k
−1
, t
off ,k
≥ a
off ,k
. (3)
In (2)and(3), c
on,k
and c
off ,k
represent the shape parameters
of the on and off periods, while a
on,k
and a
off ,k
represent the
corresponding location parameters for web-browsing (k
=3)
and data (k
= 4) services, respectively. The location and
shape parameters are defined in [12].
For a Pareto-on/Pareto-off process, the activity factors of
web-browsing and data traffic at their source can still be ap-
proximately defined by p
k
, k ∈{3, 4},as
p
k
=
t
on,k
t
on,k
+ t
off ,k
, k ∈{3, 4},(4)
where
t
on,k
and t
off ,k
are the means of t
on,k
and t
off ,k
,re-
spectively. The reasonableness of this assumption is verified
through simulations in [13], at least for these parameters
whose ranges are around the values specified in the 3GPP
specification [1].
The assumptions and system par ameters used are listed
as follow.
(i) There exist N mobiles in each cell and they are uni-
formly located in the cell.
(ii) The area of a cell is denoted by A and the cellular net-
work comprises of n square cells.
(iii) n
i,k
denotes the number of voice, video, web-browsing,
and data streams of the ith (1
≤ i ≤ N)mobile,for
k
∈{1, 2, 3, 4},respectively.
(iv) G
k
, γ
∗
k
,andBER
∗
k
, k ∈{1, 2l,2h,3,4}, denote the
spreading gains, SINR, and bit-error-rate (BER) re-
quirements for voice, LBR video, HBR video, web-
browsing, and data services, respectively.
(v) S
i,k
and l
i,k
, k ∈{1, 2l,2h,3,4},1≤ i ≤ N,denote
the received power and total number of active spread-
ing codes used by voice, LBR video, HBR video, web-
browsing, and data services of the ith mobile, respec-
tively.
(vi) Perfect power control is implemented for each ser-
vice/minisource to ensure that the desired received
powers are achieved at the intracell BS.
(vii) All receivers have additive white Gaussian noise
(AWGN) with power η.
(viii) I
intercell
is the intercell interference from all neighboring
cells.
(ix) GBN ARQ has limited number of retransmissions for
web-browsing and data services.
(x) Web-browsing and data services are equipped with fi-
nite buffer of buffer sizes B
3
and B
4
,respectively,both
in unit of packets.
Voice and video services carry RT traffic and thus are
not very relevant to implement ARQ mechanism. Compara-
tively, web-browsing and data services carry NRT trafficand
thus can initiate the GBN ARQ scheme in case of packet er-
rors. Since GBN ARQ is a continuous retransmission scheme,
web-browsing/data trafficobservedinthechannelisstillan
on/off process except that the on-period observed in the
channels is lengthened as a result of retransmissions. This re-
sults in larger activity factors being observed in the channels
than those in the sources.
Chun Nie et al. 3
Off
On
α
k
β
k
(a)
(0, 0) (0,1) (0, M)
(1, 0) (1, 1) (1, M)
Mα
2
(M 1)α
2
α
2
β
2
2β
2
Mβ
2
λ
2
μ
2
λ
2
μ
2
λ
2
μ
2
Mα
2
(M 1)α
2
α
2
β
2
2β
2
Mβ
2
(b)
Figure 1: Traffic models: (a) 2-state Markov chain for a voice source, (b) 2-dimensional Markov chain for a video source.
Since each mobile experiences different amount of inter-
ference and retransmissions, the lengthened activity factors
of each mobile can be different even for the same class of
service. Let us denote the average on and off periods of web-
browsing and data services in the CDMA channel as
t
on,k,c
and t
off ,k,c
, k ∈{3, 4}, respectively, where the subscript c is
used to represent the channel, obviously,
t
on,k,c
> t
on,k
and
t
off ,k,c
< t
off ,k
.Letp
i,k,c
,1≤ i ≤ N, k ∈{1, 2l,2h,3,4},de-
note the lengthened activity f actors of voice, LBR video, HBR
video, web-browsing, and data services of the ith user in the
channel, respectively. p
i,k,c
= p
k
for k = 1, 2l,2h as there is
no retransmission scheme and p
i,k,c
>p
k
for k = 3, 4 as these
services use GBN ARQ scheme.
3. POWER CONTROL ALGORITHM AND QoS ANALYSIS
AT DATA LINK L AYER
System capacity and QoS performance metrics in CDMA
networks are associated with the multiple access interference
(MAI) contributed from the interfering mobiles. MAI in-
cludes both intracell and intercell interference resulting from
mobiles within and outside the reference cell. SINR is a func-
tion of the received powers, spreading gains and number of
active spreading codes, and is an important attribute at the
data link layer. It is necessary that the average SINR of each
service should be maintained at a required level. Denote set
V as
{1, 2l,2h,3,4}, V
as {1, 2h,3,4}, n
i,2l
= Mn
i,2
,and
n
i,2h
= n
i,2
(1 ≤ i ≤ N) for the ith mobile, the average SINR
of the kth service stream can be expressed as [6]
S
i,k
G
k
N
j
=1;j=i
k∈V
p
i,k,c
n
i,k
S
i,k
+ I
intercell
+ η
=
γ
∗
k
,(5)
where k
∈ V and i ∈{1, 2, , N}. I
intercell
denotes the mean
of the intercell interference. Our path loss model includes
only path attenuation and lognormal shadowing which has
been widely adopted [2–6]. Rayleigh and Ricean fading are
ignored. The total intercell interference is approximated by a
Gaussian distribution if the number of mobiles is sufficiently
large [2–6], with mean and variance g iven by
I
intercell
≤
N
i=1
k∈V
p
i,k,c
n
i,k
S
i,k
f
r
m
r
d
dA
A
,
Var
I
intercell
≤
N
i=1
k∈V
S
2
i,k
n
i,k
p
i,k,c
g
r
m
r
d
−
p
2
i,k,c
f
2
r
m
r
d
dA
A
+ S
2
i,2l
n
i,2
Mp
i,2l,c
1+(M −1)p
i,2l,c
×
g
r
m
r
d
−
Mp
i,2l,c
2
f
2
r
m
r
d
dA
A
,
(6)
where
f
r
m
r
d
=
r
m
r
d
4
e
(σ ln 10/10)
2
1−Q
40 log
r
m
/r
d
√
2σ
2
−
2σ
2
ln 10
10
,
g
r
m
r
d
=
r
m
r
d
8
e
(σ ln 10/5)
2
1 − Q
40 log
r
m
/r
d
√
2σ
2
−
2σ
2
ln 10
5
.
(7)
In (7), σ
2
is variance of the lognormal shadowing, r
m
and r
d
denote the distance between a mobile and its own intracell
BS, and the distance between the mobile and the intercell BS,
respectively . Let
Γ
i
=
k∈V
p
i,k,c
n
i,k
γ
∗
k
G
k
,
=
1 −
N
i=1
Γ
i
1+
f
r
m
/r
d
dA/A
1+Γ
i
.
(8)
4 EURASIP Journal on Wireless Communications and Networking
According to the formulation that is presented in [6], the fol-
lowing power level is derived:
S
i, j
=
ηγ
∗
j
1+Γ
i
G
j
,1≤ i ≤ N, j ={1, 2l,2h,3,4}. (9)
The data link layer QoS performance is analyzed in terms
of the outage probability, which refers to the probability that
the achieved SINR is below the SINR requirement or the
achieved BER is above the BER requirement. Within the ith
mobile, the outage probabilities for voice, LBR video, HBR
video, web-browsing, and data services are formulated as
P
out,i,k
,1≤ i ≤ N, k ∈{1,2l,2h,3,4},andgivenby[6]
P
out,i,k
=
→
N
→
V
×Q
δ
i,k
− μ
i
σ
i
, (10)
where σ
2
i
= Var[I
intercell
], μ
i
=
N
j=1; j=i
k∈V
(l
j,k
S
j,k
)+
I
intercell
, δ
i,k
= S
i,k
G
k
/γ
∗
k
− η, Q(x) =
∞
x
e
−t
2
/2
dt/
√
2π,and
the notation
→
N
→
V
=
n
1,2
l
1,1
=0
Mn
1,2
l
1,2l
=0
n
1,2
l
1,2h
=0
n
1,3
l
1,3
=0
n
1,4
l
1,4
=0
···
n
j,1
l
j,1
=0
j
=i
Mn
j,2
l
j,2l
=0
j
=i
n
j,2
l
j,2h
=0
j
=i
n
j,3
l
j,3
=0
j
=i
n
j,4
l
j,4
=0
j
=i
···
n
N,1
l
N,1
=0
Mn
N,2
l
N,2l
=0
n
N,2
l
N,2h
=0
n
N,3
l
N,3
=0
n
N,4
l
N,4
=0
×
N
j=1
j
=i
k∈V
n
j,k
l
j,k
p
i,k,c
l
j,k
1 − P
i,k,c
n
j,k
−l
j,k
.
(11)
Compared to the results in [6], the main contribution
here is to calculate the outage probabilities in the environ-
ment with the GBN-ARQ scheme. The computation of the
lengthened activity factors wil l be discussed in the next sec-
tion.
4. PACKET LEVEL QoS ANALYSIS AT THE
NETWORK LAYER
In this section, our aim is to formulate the packet level QoS
performance in the uplink of CDMA systems in terms of
packet loss rates and average delays. Packet level QoS at the
network layer is directly associated with the outage proba-
bility. If outage occurs, the packets are assumed erroneous
due to excessive bit errors. For RT voice and video traffic,
these packets are discarded and treated as packet loss. For
NRT web-browsing and data traffic, GBN ARQ mechanism is
implemented to retransmit the erroneous packets which also
result in longer packet delays. In previous works [7, 14, 15],
infinite buffer is considered and thus is not realistic. In the
following, we will investigate and provide the analytical plat-
form on the effect of a finite buffer on the packet loss rate and
the average delay of a Pareto-on/Pareto-off distributed NRT
traffic for CDMA systems.
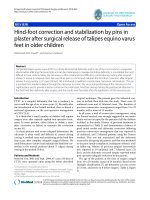
4.1. Go-Back-N ARQ
Compared to the stop-and-wait ARQ, GBN is more efficient
and easy to implement. Furthermore, it guarantees that the
received packets are in sequence as compared to the selec-
tive repeat ARQ. Figure 2(a) gives a good illustration on the
mechanism of GBN ARQ. At the source, the mobile has a fi-
nite buffer to accommodate the newly arrived packets. When
the first and subsequent few packets arrived, they are queued
in the buffer and at the same time transmitted over the chan-
nel. Upon reception, BS decodes the packet and sends an ac-
knowledgment (ACK if correctly decoded and NACK if is in
error) back to the mobile. Only if ACK is received, the mobile
will remove that packet from the buffer. In case if NACK is re-
ceived, both the particular packet and all its subsequent pack-
ets are retransmitted sequentially. BS will ensure that NACK
is not sent for more than a given maximum number. In the
process of retransmission, new packets continue to arrive and
are queued in the buffer, as shown in Figure 2(b). There are
two situations where packets will be lost.
(a) Since the buffer size is finite, when there are many re-
transmissions, buffer will overflow and newly arrived
packet will be dropped.
(b) A packet has been retransmitted for the allowable max-
imum number of times.
Assuming that k
={3, 4} represents web-browsing and data
services, respectively, the system parameters and assump-
tions are defined as follows.
(1) A finite buffer with a size of B
k
packets, k ∈{3, 4},is
used by a sender.
(2) Each on-period contains l
k
packets of the same size,
where the total length of the l
k
packetsisarandom
variable which follows a pdf that is defined in (2)or
(3). Packets are generated continuously dur ing the on-
period with a fixed time duration, T
k
, k ∈{3, 4}.
(3) When a packet is transmitted from a mobile to the BS,
the mobile waits for an acknowledgment within a time
interval of T
k
. The packet wil l be removed from the
buffer upon the receipt of ACK. The ratio of T
k
to T
k
is assumed to be an integer, s
k
,(e.g.,s
k
= T
k
/T
k
= 2in
the example shown in Figure 2(a))andB
k
≥ s
k
holds.
(4) Packet error probability is defined as p
e,k
, k ∈{3, 4}.
(5) ACK and NACK are always received correctly.
(6) Let the maximum number of retransmissions be M
re,k
,
k
∈{3, 4}.
Next, the following variables, which are useful for our analy-
sis, are defined. For simplicity and ease of notations, the sub-
script k, which is used to differentiate between the two NRT
services, will not be shown in the next few subsections. For
Chun Nie et al. 5
1234234 23456456456456
1st retransmission of packet 2
Maximum retransmission of
packet 2
1st retransmission of
packet 4
3rd retransmission of packet 4
Accepted
Discarded
Discarded
Accepted
Discarded
ACK
NACK
Mobile station
(sender)
Base station
(receiver)
Time
Time
12 23 4
(a)
123423453456456456456456756 7867 l
Time
123456
Packet arrivals
s
1+s
Transmission time
of packet 2
Delay of packet 2
Transmission time
of packet 4
Delay of packet 4
Transmission finishing time
packet 2
Packet removal time
packet 2
Transmission finishing time
packet 4
Packet removal time
packet 4
(b)
1
21
321
4321
54321
654321
765432
876543
876543
876543
876543
C87654
DC8765
EDC876
FEDC87
FEDC87
FEDC87
FEDC87
FEDC8
FEDC
FED
FE
F
9overflow
A overflow
B overflow
F
out
E
out
D
out
C
out
8
out
7
out
6
out
5
out
4
out
3
out
2
out
1
out
12312345345 678C 78 CDEF Tx over air
Buffer
status
T
on
T
on, c
Buffer size = 6
M
re
= 2
s
= 2
(c)
Figure 2: (a) GBN ARQ mechanism, (b) definition of packet transmission and removal time in Go-Back-N ARQ, and (c) lengthening effect
of the on-period: an example.
6 EURASIP Journal on Wireless Communications and Networking
example, M
re
would mean M
re,k
, T would mean T
k
,andso
on.
(1) v is the index used to represent packet sequence ap-
pearing in the source, v
= 1, , l.
(2) t
in,v
denotes the initial transmission time of the vth
packet at the mobile at time, t
arr,1
= 0.
(3) t
fn,v
denotes the finishing time of the vth packet at the
mobile.
(4) t
rm,v
denotes the time when the vth packet is removed
from the buffer of the mobile. From definition, this
will only happen if ACK is received, and hence t
rm,v
=
t
fn,v
+ sT.
(5) T
tr,v
= t
fn,v
− t
in,v
is the transmission time before the
packet is successfully transmitted.
(6) m
v
denotes the number of retransmissions for the vth
packet such that m
v
≤ M
re
.
The definitions of these variables can also be found in
Figures 2(b) and 2(c). There are a few interesting relation-
ships which can be derived if the buffer size is infinite:
t
in,v
=
⎧
⎪
⎪
⎪
⎨
⎪
⎪
⎪
⎩
(v − 1)T, v ≤ s +1,
(v − 1) +
v−s−1
q=1
m
q
(1 + s)
T, v>s+1,
T
tr,v
=
⎧
⎪
⎪
⎪
⎪
⎪
⎨
⎪
⎪
⎪
⎪
⎪
⎩
1+(1+s)
v
q=1
m
q
T, v ≤ s,
1+(1+s)
v
q=v−s
m
q
T, v>s.
(12)
The example shown in Figure 2(c) is used for illustration.
Take t
in,1
= 0 (referenced, v = 1), then t
in,2
= T, t
in,3
= 2T
(v
= s + 1), packet 1 is not retransmitted, hence m
1
= 0,
therefore t
in,4
= 3+0= 3, t
in,5
= 7 since m
2
= 1andm
3
= 0,
and so on. In the following, based on the above definition,
we are going to derive a few results for finite buffer size.
4.2. The number of overflowed packets
Assume there are l packets in an observed on-period. When
the lth packet arrives at the buffer, we assume χ packets have
been removed from the buffer and ω (ω
≤ χ) packets are cor-
rectly received. The finite buffer can store a maximum of B
packets, therefore, N
of
(l) = max(l − χ − B, 0) denotes the
number of overflowed packets (if any) and χ
−ω is the num-
ber of unsuccessful packets which have attempted to retrans-
mit for M
re
times. This is illustrated using Figure 2(c). In this
example, when l
= 15thpacketarrival,χ = 6packets(1to6)
have been removed from the buffer. All of these packets have
been correctly received eventually, and hence ω
= 6. This
means that l
− χ − B = 3 packets (9, A,andB) are lost. Note
that after the lth packet, no packets will arrive and hence
there will not be any packet overflow.
Using the relationships that t
rm,χ
≤ (l −1)T and t
rm,χ+1
≥
(l − 1) T, together with the fact that m
q
ranges from zero to
M
re
, the range of χ can be found to be
χ
≤ l − 1 − s, χ ≥ max
l −1 −s
1+(1+s)M
re
− 1, 0
. (13)
Similarly, based on the fact that χ − ω packets have been re-
transmitted for M
re
times, we can obtain
χ
−
l −1 −s −χ
(1 + s)M
re
≤ ω ≤ χ. (14)
Although packet i is transmitted for
i
q
=i−s
(1+m
q
)times,
the first
i−1
q=i−s
(1+m
q
) is due to the erroneous transmissions
of its previous packets and only the final 1 + m
i
transmis-
sions will determine whether it will be successfully transmit-
ted. Hence, out of n
tr
≤ χ +(l − 1 − s − χ)/(1 + s)transmis-
sions associated to the χ packets only ω packets are success-
fully received. The probability that ω packets are correctly re-
ceived out of all the χ removed packets when the lth packet
arrive is given by C
χ
ω
· (1 − p
M
re
+1
e
)
ω
(p
M
re
+1
e
)
χ−ω
,whereC
χ
ω
is the binomial coefficient. The probability that there are ω
correct transmissions in all the n
tr
transmissions is given by
C
n
tr
ω
·(1 − p
e
)
ω
p
n
tr
−ω
e
. Averaging over all possible retransmis-
sion and overflow scenarios, the average overflowed packets
conditional on l are given by
N
of
(l) =
χ
max
χ=χ
min
χ
ω
=ω
min
C
n
tr
ω
1 − p
e
ω
p
n
tr
−ω
e
C
χ
ω
1 − p
M
re
+1
e
ω
p
M
re
+1
e
χ−ω
max(l −χ − B,0)
χ
max
χ=χ
min
χ
ω
=ω
min
C
n
tr
ω
1 − p
e
ω
p
n
tr
−ω
e
C
χ
ω
1 − p
M
re
+1
e
ω
p
M
re
+1
e
χ−ω
, (15)
where ω
min
= χ −(l−1−s−χ)/(1+s)M
re
, χ
min
= max{(l −
1 − s)/1+(1+s)M
re
−1, 0}, χ
max
= l − 1 − s,andn
tr
≤
χ +(l −1 −s −χ)/(1 + s) can be derived using (13)and(14).
In (15), the denominator is the normalization factor.
4.3. The lengthened activity factor
Under the assumption of a small retransmission probability,
the lengthened activity factor in the GBN ARQ system, p
on,c
,
Chun Nie et al. 7
can still be approximated by
p
on,c
=
t
on,c
t
on,c
+ t
off ,c
, (16)
where
t
on
+ t
off
= t
on,c
+ t
off ,c
.Wefirstillustratehowt
on,c
can
be obtained.
The lengthened on-per iod is given by t
fn,l
, that is, the
time when it completed the transmission of the lth packet.
Another variable k(l) is defined, where k(l)
≤ l is the
number of packets transmitted over the channel. In the case
when there are overflowed packets, k(l) will exclude these
packets. For the example shown in Figure 2, since there is 3
overflowed packets, k(l
= 15) = 12. Mathematically, the
on-period is given by
t
on,c|l
= t
fn,k
− t
in,1
=
k(l)+(1+s)
k(l)
q=1
m
q
T. (17)
All retransmissions will follow the same statistics. Taking the
expectation of (17)withrespecttok(l)andm,wehave
t
on,c|l
= E
k(l)
T +(1+s)E[m]E
k(l)
T. (18)
Using the packet error probability (outage probability)
p
e
, the number of retransmissions m is a random variable
with probability given by
Pr(m = ρ) =
⎧
⎪
⎨
⎪
⎩
1 − p
e
p
ρ−1
e
, ρ<M
re
,
1 − p
e
p
M
re
e
+ p
M
re
+1
e
= p
M
re
e
, ρ = M
re
,
(19)
and its mean is given by
E[m]
=
p
e
− p
M
re
+1
e
1 − p
e
. (20)
Since k(l)
= l −N
of
(l), average over all retransmission and
overflow scenarios,
E
k(l)
=
k(l) = l −N
of
(l). (21)
As the on-period is Pareto distributed, the probability
that an on-period has l packets, denoted by p(l), is approx-
imately given by
p(l)
= Pr{t = lT}=
(l+1)T
lT
c
on
a
c
on
t
−c
on
−1
dt, t ≥ a
on
.
(22)
Based on (15), (20), and (21), the mean of the lengthened
on-period of a web-browsing/data service in the GBN ARQ
system given in (18) can be formulated by
t
on,c
=
∞
l=a
on
/T
p(l) ×
1+
p
e
− p
M
re
+1
e
(1 + s)
1 − p
e
×
l −N
of
(l)
×
T
,
(23)
where a
on
is the minimum length of Pareto on-period and
a
on
/T means the minimum number packets in each Pareto
on-period.
4.4. Total packet loss
Packet losses result from both finite buffer ov erflow and
retransmissions exceeding the maximum limit. The condi-
tional average packet loss conditioned on l is given by
N
loss
(l) =
l −N
of
(l)
p
M
re
+1
e
+ N
of
(l). (24)
Then, the mean of the packet loss rate over time is the prob-
abilistic summation of all possible instantaneous packet loss
rates based on (22)and(24),andthusisgivenby
P
loss
=
∞
l=a
on
/T
p(l)N
loss
(l)
l
. (25)
4.5. Average buffer length and delay
The retransmissions are assumed to be minimal so that each
new on-period arrives with an empty buffer. If an on-period
contains l packets, the buffer length shows the following be-
haviors: (a) increase by one if a retransmission is made, (b)
no change if a transmission or retransmission is successfully,
(c) the number of packets in the buffer may reach a max-
imum value a nd stay at this state until the lth packet ar-
rives, and (d) the number of packets in the buffer then de-
creases from the maximum value to zero. Figure 2(c) shows
the buffer length from t
= 0to23T whichisgivenby
[012345666666666666654321] and illustrates this behavior.
The buffer is empty after the last packet in the buffer is re-
moved until the arrival of next on-p eriod. In each on/off cy-
cle, the buffer length varies similarly.
Assume when the ξth packet arrives, the buffer is getting
full, ξ
≤ l. If there is no overflow, the buffer length condi-
tioned on l can be described by the following func tion:
Q
length
t | l
=
⎧
⎪
⎪
⎪
⎪
⎪
⎪
⎪
⎨
⎪
⎪
⎪
⎪
⎪
⎪
⎪
⎩
t
T
−
q, l − 1 ≥ t
rm,q+1
>t≥ t
rm,q
,
l
− χ, t
rm,χ+1
>t≥ l − 1,
l
−χ−p, t
rm,χ+p+1
>t ≥ t
rm,χ+p
, l −χ−1 ≥p≥1,
0, t
on,c
+ t
off ,c
>t≥ t
rm,l
,
(26)
where x is the smallest integer greater than x. χ is the index
of the last removed packet when packet l arrived and defined
as t
rm,0
= 0. On the other hand, if there are N
of
(l)overflow
packets, then
Q
length
t | l
=
⎧
⎪
⎪
⎪
⎪
⎪
⎪
⎪
⎪
⎪
⎪
⎪
⎨
⎪
⎪
⎪
⎪
⎪
⎪
⎪
⎪
⎪
⎪
⎪
⎩
t
T
−
q, ξ − 1 >t
rm,q+1
>t≥ t
rm,q
,
B, t
rm,χ+N
of
(l)+1
≥ t ≥ ξ − 1,
B
− q, t
rm,χ+N
of
(l)+q+1
>t>t
rm,χ+N
of
(l)+q
,
B
− 1 ≥ q ≥ 1,
0, t
on
+ t
off
>t≥ t
rm,χ+N
of
(l)+B
.
(27)
8 EURASIP Journal on Wireless Communications and Networking
These expressions can be verified by looking at the queue
length at time t, conditioned by l, in the example, where
T
rm,1
= 5, T
rm,2
= 7, T
rm,3
= 11, T
rm,4
= 12, ,and
T
rm,7
= 18, , as shown in Figure 2(c).
However, there are many possible retransmissions and
packet overflow scenarios (ensemble space) that need to be
considered for a given t
on,c
and t
off ,c
,denotedbyt
on,c
(l)and
t
off ,c
(l). We approximate the ensemble average of Q
length
(t|l)
under all of these scenarios by
Q
length
(t | l). In
Q
length
(t | l),
the transition time of each incremental increase in queue
length as in (27) is replaced by its statistical average, which
is determined by the retransmission and overflow statistics.
For example, in
Q
length
(t | l), N
of
, ξ,andξ are used to re-
place N
of
, ξ,andχ,respectively.Thevalueofξ is estimated
using the average number of retransmissions as below:
ξ −
ξ −s
1+E[m](1 + s)
= B =⇒ ξ =
B
1+E[m](1 + s)
− s
E[m](1 + s)
,
(28)
and
χ is estimated by
χ =
χ
max
χ=χ
min
χ
ω
=ω
min
C
n
tr
ω
1 − p
e
ω
p
n
tr
−ω
e
C
χ
ω
1 − p
M
re
+1
e
ω
p
M
re
+1
e
χ−ω
χ
χ
max
χ=χ
min
χ
ω
=ω
min
C
n
tr
ω
1 − p
e
ω
p
n
tr
−ω
e
C
χ
ω
1 − p
M
re
+1
e
ω
p
M
re
+1
e
χ−ω
. (29)
The average queue length conditioned on l is given by
Q
length
(l) =
Q
length
t | l
dt
t
on,c
(l)+t
off ,c
(l)
. (30)
Furthermore, if the on-per iod has l packets, the arrival rate
is assumed to be
λ(l) =
l −N
of
(l)
t
on,c
(l)+t
off ,c
(l)
. (31)
Since l is random variable, we want to determine the average
packet delay over time, denoted as D.Basedon(22)and(30)-
(31), D is given by
D
=
∞
l=a
on
/T
p(l)Q
length
(l)
∞
l=a
on
/T
p(l)λ(l)
. (32)
In the discussion given above, one traffic class is con-
sidered, and the outage probability is assumed known. In
the following, a more practical situation is considered. The
fact that multiclass services are present and the performance
metrics are interdependent, the computation becomes more
complicated. In general, the computation needs to be per-
formed iteratively.
4.6. Lengthened activity factor of non-real-time
service
In order to facilitate further analysis, let us denote the pa-
rameter set vector [T
k
, T
k
, B
k
, c
k
, a
k
, b
k
, Q{(δ
i,k
−μ
i
)/σ
i
}, M
k
]
for the ith mobile as
−−→
U
i,k
,1≤ i ≤ N, k ∈{3, 4},respectively.
Among the vector elements of
−−→
U
i,k
,1≤ i ≤ N, k ∈{3, 4},
Q
{(δ
i,k
− μ
i
)/σ
i
}, which is shown in (10), represents the in-
stantaneously outage probabilities of the web-browsing and
data services for the ith mobile, respectively. The average
lengthened activity factors of web-browsing and data services
within the ith mobile are supposed to be the summation of all
probabilistic activity factors over a long t ime. Let AfFun(
−−→
U
i,k
)
denote instantaneous lengthened activity factor using (16)
with respect to the parameter set
−−→
U
i,k
. Thus, the lengthened
activityfactorsofweb-browsinganddataaregivenby
p
i,k,c
=
→
N
→
V
×AfFun
−−→
U
i,k
. (33)
It is shown in (5), (9), (10), and (33) that the QoS per-
formances are intertwined across both the data link and net-
work layers. That is, the outage probabilities, lengthened ac-
tivity factors, packet loss rates, and delays are interrelated
with each other. Therefore, an iteration process is developed
to obtain the stable outage probabilities (P
out,i,k
,1≤ i ≤ N,
k
∈ V) and the stable lengthened activity factors (p
i,k,c
,
1
≤ i ≤ N, k ∈{3, 4}), satisfying (5), (9), (10), and (33).
The steps of the iteration are given as follows.
(1) Set initial p
i,k,c
to be p
i,k,c
= p
k
,1≤ i ≤ N, k ∈ V.
(2) Calculate S
i,k
, P
out,i,k
,1≤ i ≤ N, k ∈ V, according to
(9)and(10).
(3) Based on (33), the new p
i,k,c
, k ∈{3, 4}, are calculated.
(4) With the new p
i,k,c
, k ∈{3, 4}, iterate steps 2 and 3
until p
i,k,c
and P
out,i,k
converge.
(5) If convergence occurs, the stable values of P
out,i,k
,1≤
i ≤ N, k ∈ V,andp
i,k,c
,1≤ i ≤ N, k ∈{3, 4},are
obtained. If it does not converge, it means that there is
no feasible solution jointly satisfying (5), (9), (10), and
(33).
4.7. Packet level QoS p e rformance at the network layer
Based on the above analytical work of the lengthened activity
factors, the packet loss rate and delay performances of the
Chun Nie et al. 9
Table 1: System parameters.
Parameter type Value Parameter type Value
Shadowing mean μ 0 Number of cells, n 9
Shadowing variance σ
2
σ = 6 dB Thermal noise power η −103.2dBm(4.8 ×10
−14
Watt)
Path loss constant 4
Table 2: Traffic parameter.
Traffic parameter type
Real-time services Non-real-time service
Voice Video Web-browsing Data
Average on-period (second) 10.418 (LBR) 1.5(HBR) 1.62.937
Average off-period (second)
1.50.663 (LBR) 1.5(HBR) 12 25.643
Activity factor (source traffic)
0.40.3867 (LBR) 0.5(HBR) 0.1176 0.1028
Average rate (kbps)
24 122.3 14.122.8
Channel rate (kbps)
60 30 (LBR) 60 (HBR) 120 240
Spreading gain
64 128 (LBR) 64 (HBR) 32 16
Number of spreading codes
1 8 (LBR) 1 (HBR) 11
Buffer size (number of packets)
00 200 400
Convolutional rate
1/21/2 1/21/2
four classes are formulated. Within the ith mobile, let the
packet loss rates and delays for voice, LBR video, HBR video,
web-browsing, and data services be denoted by P
loss,i,k
and
D
i,k
,1≤ i ≤ N, k ∈{1,2l,2h,3,4},respectively.
As voice and video are NRT delay-sensitive services, no
ARQ mechanism is implemented in their packet transmis-
sions. Thus, their packet loss rates are just equal to their
outage probability, which is given by
P
loss,i,k
= P
out,i,k
, k ∈{1, 2l,2h}, (34)
and their average delays are simply their packet transmission
time, which is given by
D
i,k
= T
k
, k ∈{1, 2l,2h}. (35)
On the other hand, the lengthened a ctivity factors, av-
erage packet loss rates, and average delays of web-browsing
and data are based on both their instantaneous outage prob-
abilities and the GBN ARQ mechanism. Let us denote the
average packet loss rates and average delay as P
loss,i,k
and D
i,k
,
1
≤ i ≤ N, k ∈{3, 4}, respectively, which are the average
values over the time. Let PlossFun(
−−→
U
i,k
) and DelayFun(
−−→
U
i,k
)
denote instantaneous packet loss rate and delay using (25)
and (32), respectively, with respect to the parameter set
−−→
U
i,k
.
Therefore, the average packet loss rates of web-browsing and
data services are given by
P
loss,i,k
=
→
N
→
V
×PlossFun
−−→
U
i,k
, (36)
and the average delays of web-browsing and data services are
given by
D
i,k
=
→
N
→
V
×DelayFun
−−→
U
i,k
, (37)
where 1
≤ i ≤ N, k ∈{3, 4},respectively.
5. NUMERICAL RESULTS
In our analytical model, each mobile can support multicon-
nection multiclass traffic. In order to demonstrate the rea-
sonableness of our analyt ical formulation presented in previ-
ous sections, numerical results are presented in this section.
Acellularmobilenetworkwithn square cells is considered.
We assume that the number of mobiles with heterogeneous
classes is identical in each cell and all mobiles are uniformly
distributed. We simulate the network model with SMPL sim-
ulation kernel, a type of discrete event simulator [16]. System
parameters and traffic par ameters are shown in Tables 1 and
2.
Each mobile in our analysis supports up to four diverse
classes simultaneously. Suppose that all mobiles in each cell
can be divided into four groups including different classes.
The class distribution and group size are given in Table 3.In
practice, with 4 different traffic classes, there can be up to 15
different combinations and similar analytical approach can
be applied. We vary the number of users in Group 1 and fix
the number of users in all the other groups. The numerical
results are plotted in Figures 3–14.
Firstly, we can clearly observe that a ll analytical results
show better agreements when the systems are in light and
medium loads (less than 1.3 Mbps) than when they are in
10 EURASIP Journal on Wireless Communications and Networking
Table 3: Number of services in each mobile user.
Group index Group 1 Gr oup 2 Group 3 Gr oup 4
Number of mobiles N
1
= 5 ∼ 23 N
2
= 2 N
3
= 2 N
4
= 5
Classes in each mobile
1voice 1video 1voice+1video 1web+1data
10
1
10
2
10
3
10
4
Packet loss rate/outage probability
5 6 7 8 9 1011121314151617181920212223
Number of users in Group one
Simulation
Theory
Figure 3: Packet loss rate/outage probability of voice services
(Group 1).
heavy load. The deviation during heavy load, that is, when
there are more mobiles in the system, can be explained as
follows. The outage becomes more severe and thus retrans-
missions occur more frequently during heavy load. Our GBN
ARQ analysis is accurate assuming the retransmissions oc-
cur less frequently and the packet error rate is low. If a lot
of retransmissions happen under high load, the on-periods
of web-browsing or data services in the CDMA channel may
overlap, which influences the computation of their length-
ened activity factors, outage probabilities, packet loss rates,
and delays. As all classes in CDMA systems are intertw ined
with each other, the QoS metrics therefore deviate from sim-
ulation results. Therefore, our analytical formulation is more
suitable for light and medium loads when the throughput
of the system is below or around 1.3 Mbps. On the other
hand, under higher load, the packet loss rates and delay
performances have already exceeded their specific require-
ments. For example, the packet loss rates requirements of
these classes should be less than either 10
−2
for voice and
video or 10
−3
for web-browsing and data, which are defined
in [1].
Secondly, we also have some comments on the complex-
ity of the analysis. Our final analytical expressions are rela-
tively complex. This is due to the fact that we jointly con-
sider more realistic traffic models, GBN ARQ, multicell net-
work, and four traffic classes in order to approximate the real
network. These factors complicate the analysis. Despite this,
10
1
10
2
10
3
10
4
Packet loss rate/outage probability
5 6 7 8 9 1011121314151617181920212223
Number of users in Group one
Simulation
Theory
Figure 4: Packet loss rate/outage probability of video services
(Group 2).
the analysis still takes much shorter time to work out the re-
sults than using simulation. For example, it takes more than
24 hours to obtain the simulation results, while the analyti-
cal results can be computed in less than one hour. Therefore,
the analytical solution proves to be much more efficient in
estimating the QoS performances.
6. CALL ADMISSION CONTROL METHOD AND
ADMISSION REGION
In previous literatures, CAC is analyzed with many ap-
proaches in [17, 18]. But these works are not totally QoS-
based and do not address cross-layer CAC in CDMA net-
works. Our contribution is that the analytical formula-
tion in this paper leads to the determination of the cross-
layer admission region (AR) in the uplink of a CDMA sys-
tem. A QoS-based CAC scheme is given here. If the outage
probability, packet loss rate, and delay requirements are de-
fined as δ
out
, δ
loss
,andδ
d
, the AR at the packet level in the
uplink of CDMA systems, denoted by R,isgivenby
R
=
(1,2,3, , i, , N) | P
loss,i,k
≤ δ
loss
, D
i,k
≤ δ
d
, P
out,i,k
≤ δ
out
, SINR
I,K
= γ
∗
K
,
(38)
where 1
≤ i ≤ N, k ∈ V.
Figure 15 shows the CAC scheme in the uplink of CDMA
systems. This CAC scheme a dmits or rejects call admission
Chun Nie et al. 11
10
1
10
2
10
3
10
4
Packet loss rate/outage probability
5 6 7 8 9 1011121314151617181920212223
Number of users in Group one
Simulation
Theory
Figure 5: Packet loss rate/outage probability of voice services
(Group 3).
10
1
10
2
10
3
10
4
Packet loss rate/outage probability
5 6 7 8 9 1011121314151617181920212223
Number of users in Group one
Simulation
Theory
Figure 6: Packet loss rate/outage probability of video services
(Group 3).
requests based on the satisfaction of average SINR require-
ments and outage probability performance at the data link
layer and packet level QoS performances including packet
loss rate and delay at the network layer. In Figure 15, when
a specific set of mobile requests to be admitted into the net-
work, the CAC process is initiated. The CAC first obtains the
power levels for all mobiles. If positive power solutions are
available, the SINR requirements of these mobiles are sat-
isfied at the data link layer. Otherwise, the CAC rejects this
set of mobiles directly due to their unsatisfactory average
SINR. With the positive power solutions, the CAC computes
0.24
0.22
0.2
0.18
0.16
0.14
0.12
0.1
Lengthened activity factor
5 6 7 8 9 1011121314151617181920212223
Number of users in Group one
Simulation
Theory
Figure 7: Lengthened activity factor of web-browsing services
(Group 4).
10
0
10
1
10
2
10
3
10
4
Outage probability
5 6 7 8 9 1011121314151617181920212223
Number of users in Group one
Simulation
Theory
Figure 8: Outage probability of web-browsing services (Group 4).
the outage probabilities of all mobiles and the lengthened
activity factors of NRT services. Iterations are performed
to make both the outage probabilities and the lengthened
activity factors converge. If the iterations cannot reach con-
vergence, feasible solutions are not available and thus this
combination of mobile users should be rejected by CAC. If
the iterations converge, the stable outage probabilities for all
services and the lengthened activity factors for NRT services
are obtained. Next, the packet loss rate and average delay of
each service are calculated. If the obtained outage probabil-
ity, packet loss rate, and delay requirements are simultane-
12 EURASIP Journal on Wireless Communications and Networking
10
0
10
1
10
2
10
3
10
4
10
5
Packet loss rate
5 6 7 8 9 1011121314151617181920212223
Number of users in Group one
Simulation
Theory
Figure 9: Packet loss rate of web-browsing services (Group 4).
600
500
400
300
200
100
0
Delay (millisecond)
5 6 7 8 9 1011121314151617181920212223
Number of users in Group one
Simulation
Theory
Figure 10: Average delay of web-browsing services (Group 4).
ously satisfied, this set of mobiles can be assured of QoS re-
quirements and thus can be admitted into the network by
the CAC scheme. Otherwise, this set of mobiles should b e re-
jected by the CAC scheme. Compared to existing CAC meth-
ods in [17, 18], the main advantage of this CAC scheme is
that it is totally based on the cross-layer QoS satisfaction of all
admitted mobiles in terms of specific SINR, outage probabil-
ity, packet loss rate, and delay requirements. That is, the QoS
requirements of all admitted mobiles are completely satisfied
at both the data link layer and packet level of the network
layer, and the system capacit y is thus maximized. Using the
0.22
0.2
0.18
0.16
0.14
0.12
0.1
Lengthened activity factor
5 6 7 8 9 1011121314151617181920212223
Number of users in Group one
Simulation
Theory
Figure 11: Lengthened activity factor of data services (Group 4).
10
0
10
1
10
2
10
3
10
4
Outage probability
5 6 7 8 9 1011121314151617181920212223
Number of users in Group one
Simulation
Theory
Figure 12: Outage probability of data services (Group 4).
given parameters in Table 1, an example of a 3-dimensional
feasible AR is shown in terms of the number of mobiles in
Figure 16.
In a realistic CDMA system, the BS can utilize dedicated
control channels to do fast power control and guar antee that
each traffic stream is received with the desired power level.
Based on the global information gathered from the network,
the CAC can find out admission region with our analytical
model in advance and save as a table at the BS. During op-
eration, CAC at the BS can simply look up the table to make
CAC decisions.
Chun Nie et al. 13
10
0
10
1
10
2
10
3
10
4
10
5
Packet loss rate
5 6 7 8 9 1011121314151617181920212223
Number of users in Group one
Simulation
Theory
Figure 13: Packet loss rate of data services (Group 4).
1000
900
800
700
600
500
400
300
200
100
0
Delay (millisecond)
5 6 7 8 9 1011121314151617181920212223
Number of users in Group one
Simulation
Theory
Figure 14: Average delay of data services (Group 4).
7. CONCLUSION
We have presented an approximate analytical framework for
the cross-layer QoS in CDMA networks. Four classes of ser-
vices are served within the same mobile and GBN ARQ with
finite buffer size and limited retransmissions is implemented
for NRT traffic with Pareto-on/Pareto-off sources for the first
time. In our analysis, the coupling of packet-level QoS at the
network layer and data-link-layer QoS is investigated. The
numerical results show that our analytical approach can a p-
proximate the simulation results quite well up to medium
traffic load. Based on the cross-layer QoS constraints, a CAC
A set of mobile users
Rejected by call
admission control
To be included into
admission region
Compute outage
probability/
lengthened activity
factors
Is power
distribution
feasible ?
Iterate and
converge ?
Compute outage
probability/packet
loss rate/averege
delay
Fulfill cross-layer
QoS requirements ?
No
Yes
Yes
Yes
Not convergable ?
No
No
Figure 15: Call admission control procedures.
15
10
5
0
Number of mobile users in Group four
0
10
20
30
40
50
60
Number of mobile users in Group one
10
8
6
4
2
0
Number of mobile
users in Group three
Figure 16: Admission region with three groups of users (assume
N
2
= 0).
method is proposed to maximize the system capacity and
leads to the determination of admission region in the up-
link of CDMA systems. Our analytical work can be further
combined with the call level analysis of QoS performances
to provide a joint capacity evaluation at both call and packet
levels in CDMA networks.
14 EURASIP Journal on Wireless Communications and Networking
REFERENCES
[1] 3GPP TS 23.107, “QoS Concept and Architecture,” v5.7.0, De-
cember 2002.
[2] K. S. Gilhousen, I. M. Jacobs, R. Padovani, A. J. Viterbi, L. A.
Weaver Jr., and C. E. Wheatley III, “On the capacity of a cellu-
larCDMAsystem,”IEEE Transactions on Vehicular Technolog y,
vol. 40, no. 2, pp. 303–312, 1991.
[3] D.T.C.Wong,J.W.Mark,K.C.Chua,J.Yao,andY.H.Chew,
“Performance analysis of multiclass services in the uplink of
wideband CDMA,” in Proceedings of the 8th International Con-
ference on Communication Systems (ICCS ’02), vol. 2, pp. 692–
696, Singapore, November 2002.
[4] D.T.C.Wong,J.W.Mark,K.C.Chua,andB.Kannan,“Per-
formance analysis of variable bit rate multiclass services in the
uplink of wideband CDMA,” in Proceedings of IEEE Interna-
tional Conference on Communications, vol. 1, pp. 363–367, An-
chorage, Alaska, USA, 2003.
[5] D.T.C.Wong,J.W.Mark,andK.C.Chua,“Performanceeval-
uation of video services in a multirate DS-CDMA system,” in
Proceedings of the 14th IEEE International Symposium on Per-
sonal, Indoor and Mobile Radio Communications (PIMRC ’03),
vol. 2, pp. 1490–1495, Beijing, China, September 2003.
[6] C.Nie,D.T.C.Wong,andY.H.Chew,“Outageanalysisfor
multi-connection multiclass services in the uplink of wide-
band CDMA cellular mobile networks,” in Proceedings of the
3rd IFIP-TC6 Networking Conference, pp. 1426–1432, Athens,
Greece, May 2004.
[7] J. B. Kim and M. L. Honig, “Resource allocation for multiple
classes of DS-CDMA traffic,” IEEE Transactions on Vehicular
Technology, vol. 49, no. 2, pp. 506–519, 2000.
[8] R. Fantacci and S. Nannicini, “Multiple access protocol
for integration of variable bit rate multimedia trafficin
UMTS/IMT-2000 based on wideband CDMA,” IEEE Journal
on Selected Areas in Communications, vol. 18, no. 8, pp. 1441–
1454, 2000.
[9] 3GPP TR 25.942, “RF system scenarios,” v.5.3.0, June 2004.
[10]B.Maglaris,D.Anastassiou,P.Sen,G.Karlsson,andJ.D.
Robbins, “Performance models of statistical multiplexing in
packet video communications,” IEEE Transactions on Commu-
nications, vol. 36, no. 7, pp. 834–844, 1988.
[11] A. Jamalipour, The Wireless Mobile Internet: Architectures, Pro-
tocols and Services, John Wiley & Sons, Chichester, West Sus-
sex, UK, 2003.
[12] M. Evans, Statistical Distributions,JohnWiley&Sons,New
York, NY, USA, 3rd edition, 1998.
[13] C. Nie, “Packet level quality of service analysis of multiclass
services in a WCDMA mobile network,” M.S. thesis, National
University of Singapore, Kent Ridge, Singapore, 2004.
[14] Y. Hayashida, N. Sugimachi, M. Komatsu, and Y. Yoshida,
“Go-back-N system with limited retransmissions,” in Proceed-
ings of the 8th IEEE Annual International Phoenix Conference
on Computers and Communications, pp. 183–187, Scottsdale,
Ariz, USA, March 1989.
[15] Y. Hayashida, S. Fujii, and Y. Tezuka, “Delay performance of a
continuous ARQ system with copy-transmissions,” in Proceed-
ings of the 7th Annual Joint Conference of the IEEE Computer
and Communications Societies (INFOCOM ’88), pp. 714–721,
New Orleans, La, USA, 1988.
[16] M. H. MacDougall, Simulating Computer Systems: Techniques
and Tools, MIT Press, Cambridge, Mass, USA, 1987.
[17] B J. Hwang and J S. Wu, “Call admission control for a mul-
tiplerateCDMAsystem,”IEICE Transactions on Communica-
tions, vol. E84-B, no. 11, pp. 2932–2945, 2001.
[18] L. Zhang, X. Cheng, and K. R. Subramanian, “Admission
control for integrated video-conferencing/voice/data services
in broadband CDMA networks,” Computer Communications,
vol. 23, no. 5, pp. 499–510, 2000.
Chun Nie received the B.Eng. degree
from Northwestern Polytechnic University,
China, and the M.Eng. degree from the Na-
tional University of Singapore, Singapore,
in 2000 and 2005, respectively, all in electri-
cal engineering. He is currently working to-
wards his Ph.D. degree at the Department of
Electrical and Computer Engineering, Uni-
versity of North Carolina, Charlotte, NC,
USA. His research interests include medium
access control, quality-of-service, cross-layer protocol design, and
resource management in wireless networks.
Yo n g Hu a t C h e w received the B.Eng.,
M.Eng., and Ph.D. degrees in electrical en-
gineering from the National University of
Singapore (NUS), Singapore. He has been
with the Institute for Infocomm Research
(formerly also known as Centre for Wire-
less Communications, NUS, and Institute
for Communications Research), an institute
under the Agency for Science, Technology,
and Research, where he is currently a Senior
Scientist, since 1996. He is also an adjunct Associate Professor in
the Department of Electrical and Computer Engineering, National
University of Singapore. His research interests are in technologies
related to high spectrally efficient wireless communication systems
and radio resource management.
David Tung Chong Wong received the
B.Eng. and M.Eng . degrees from the Na-
tional University of Singapore (NUS) in
1992 and 1994, respectively, and the Ph.D.
degree from the University of Waterloo,
Canada, in 1999, all in electrical engineer-
ing. He is with the Institute for Infocomm
Research, Singapore (formerly Centre for
Wireless Communications, NUS, and Insti-
tute for Communications Research, NUS)
first as a Research Engineer and currently as a Scientist, since 1994.
His research interests are in communications networks, 3 G/4 G,
and ultra-wideband wireless mobile multimedia networks. His ar-
eas of research are in the medium access control, resource alloca-
tion with quality-of-service constraints, traffic policing with het-
erogeneous traffic, and cross-layer design. He is a Senior Member
of the IEEE. He was on the Technical Program Committee of the
IEEE WCNC 2003, IEEE WCNC 2005, IEEE GLOBECOM 2005,
and IEEE ICCS 2006.