Báo cáo hóa học: " A Bayesian Super-Resolution Approach to Demosaicing of Blurred Images" potx
Bạn đang xem bản rút gọn của tài liệu. Xem và tải ngay bản đầy đủ của tài liệu tại đây (4.83 MB, 12 trang )
Hindawi Publishing Corporation
EURASIP Journal on Applied Signal Processing
Volume 2006, Article ID 25072, Pages 1–12
DOI 10.1155/ASP/2006/25072
A Bayesian Super-Resolution Approach to
Demosaicing of Blurred Images
Miguel Vega,
1
Rafael Molina,
2
and Aggelos K. Katsaggelos
3
1
Departamento de Lenguajes y Sistemas Inform
´
aticos, Escuela T
´
ecnica Superior de Ingenier
´
ıa Infom
´
atica, Universidad de Granada,
18071 Granada, Spain
2
Depart amento de Ciencias de la Computaci
´
on e Inteligencia Artificial, Escuela T
´
ecnica Superior de Ingenier
´
ıa Infom
´
atica,
Universidad de Granada, 18071 Granada, Spain
3
Department of Electrical Engineering and Computer Science, Robert R. McCormick School of Engineering and Applied Science,
Northwestern University, Evanston, IL 60208-3118, USA
Received 10 December 2004; Revised 6 May 2005; Accepted 18 May 2005
Most of the available digital color cameras use a single image s ensor with a color filter array (CFA) in acquiring an image. In order
to produce a visible color image, a demosaicing process must be applied, which produces undesirable artifacts. An additional
problem appears when the observed color image is also blurred. This paper addresses the problem of deconvolving color images
observed with a single coupled charged device (CCD) from the super-resolution point of view. Utilizing the Bayesian paradigm,
an estimate of the reconstructed image and the model parameters is generated. The proposed method is tested on real images.
Copyright © 2006 Hindawi Publishing Corporation. All rig hts reserved.
1. INTRODUCTION
Most digital color cameras use a single coupled charge de-
vice (CCD), or a single CMOS sensor, with a color filter ar-
ray (CFA) to acquire color images. Unfortunately, the color
filter generates different spectral responses at every CCD cell.
The most widely used CFA is the Bayer one [1]. It imposes a
spatial pattern of two G cells, one R, and one B cell, as shown
in Figure 1.
Bayer camera pixels convey incomplete color informa-
tion which needs to be extended to produce a visible color
image. Such color processing is known as demosaicing (or
demosaicking). From the pioneering work of Bayer [1]to
nowadays, a lot of work has been devoted to the demosaicing
topic (see [2] for a review). The use of a CFA and the corre-
sponding demosaicing process produce undesirable artifacts,
which are difficult to avoid. Among such artifacts are the zip-
per effect, also known as color fringe, and the appearance of
moir
´
e patterns.
Different interpolation techniques have been applied to
demosaicing. Cok [3] applied bilinear interpolation to the G
channel first, since it is the most populated and is supposed
to apport information about luminance, and then applied bi-
linear interpolation to the chrominance ratios R/GandB/G.
Freeman [4] applied a median filter to the differences be-
tween bilineraly interpolated values of the different channels,
and based on these and the observed channel at every pixel,
the intensities of the two other channels are estimated. An
improvement of this technique was to perform adaptive in-
terpolation considering chrominance gradients, so as to take
into account edges between objects [5]. This technique was
further improved in [6] where steerable inverse diffusion in
color was also applied. In [7], interchannel correlations were
considered in an alternating-projections scheme. Finally in
[8], a new orthogonal wavelet representation of multivalued
images was applied. No much work has been reported on the
problem of deconvolving single-CCD observed color images.
Over the last two decades, research has been devoted to
the problem of reconstructing a high-resolution image from
multiple undersampled, shifted, degraded frames with sub-
pixel displacement errors (see, e.g., [9–17]). Super-resolution
has only been applied recently to demosaicing problems [18–
21]. Unfortunately, again, few results (see [19–21]) have been
reported on the deconvolution of such images. In our previ-
ous work [22, 23], we addressed the high-resolution prob-
lem from complete and also from incomplete observations
within the general framework of frequency-domain multi-
channel signal processing developed in [24]. In this paper,
we formulate the demosaicing problem as a high-resolution
problem from incomplete observations, and therefore we
propose a new way to look at the problem of deconvolution.
The rest of the paper is organized as follows. The prob-
lem formulation is described in Section 2.InSection 3,we
describe the model used to reconstruct each band of the color
2 EURASIP Journal on Applied Signal Processing
GR GRG RGR
BGB GBGBG
GR GRG RGR
BGB GBGBG
GR GRG RGR
BGB GBGBG
GR GRG RGR
BGB GBGBG
M
1
pixels
M
2
pixels
(a)
BBBB
GGGG
GGGGB
GGGG
RRRRGGB
G
RRRRGGB
G
RRRRGG
RRRR
(b)
Figure 1: (a) Pattern of channel observations for a Bayer camera with CFA; (b) observed low-resolution channels (the array in (a) and all
thearraysin(b)areofthesamesize).
RRRR
RRRR
RRRR
RRRR
M
1
pixels
M
2
pixels
D
1,1
RRRR
RRRR
RRRR
RRRR
N
1
= M
1
/2 pixels
N
2
= M
2
/2 pixels
Figure 2: Process to obtain the low-resolution observed R channel.
image and then examine how to iteratively estimate the high-
resolution color image. The consistency of the global distri-
bution on the color image is studied in Section 4. Experimen-
tal results are described in Section 5. Finally, Section 6 con-
cludes the paper.
2. PROBLEM FORMULATION
Consider a Bayer camera with a color filter array (CFA) over
one CCD with M
1
× M
2
pixels, as shown in Figure 1(a).As-
suming that the camer a has three M
1
× M
2
CCDs, one for
each of the R, G, B channels, the observed image is given by
g
=
g
Rt
, g
Gt
, g
Bt
t
,(1)
where t denotes the transpose of a vector or a matrix and each
one of the M
1
× M
2
column vectors g
c
, c ∈{R,G, B}, results
from the lexicographic ordering of the two-dimensional sig-
nal in the R, G, and B channels, respectively.
Due to the presence of the CFA, we do not observe g but
an incomplete subset of it, see Figure 1(b).Letuscharacterize
these observed values in the Bayer camera. Let N
1
= M
1
/2
and N
2
= M
2
/2; then the 1D downsampling matrices D
x
l
and
D
y
l
are defined by
D
x
l
= I
N
1
⊗ e
t
l
, D
y
l
= I
N
2
⊗ e
t
l
,(2)
where I
N
i
is the N
i
×N
i
identity matrix, e
l
is a 2×1 unit vector
whose nonzero element is in the lth position, l
∈{0, 1},and
⊗ denotes the Kronecker product operator. The (N
1
× N
2
) ×
(M
1
× M
2
)2D downsampling matrix is now given by D
l1,l2
=
D
x
l1
⊗ D
y
l2
.
Using the above downsampling matrices, the subimage
of g which has been observed, g
obs
, may be viewed as the in-
complete set of N
1
× N
2
low-resolution images
g
obs
=
g
Rt
1,1
, g
Gt
1,0
, g
Gt
0,1
, g
Bt
0,0
t
,(3)
where
g
R
1,1
= D
1,1
g
R
, g
G
1,0
= D
1,0
g
G
,
g
G
0,1
= D
0,1
g
G
, g
B
0,0
= D
0,0
g
B
.
(4)
As an example, Figure 2 illustrates how g
R
1,1
is obtained.
Note that the origin of coordinates is located in the bottom-
left side of the array. We have one observed N
1
× N
2
low-
resolution image at R, two at G, and one at B channels.
In order to deconvolve the observed image, the image
formation process has to take into account the presence of
blurring. We assume that g in (1)canbewrittenas
g
=
⎛
⎜
⎝
g
R
g
G
g
B
⎞
⎟
⎠
=
⎛
⎜
⎝
Bf
R
Bf
G
Bf
B
⎞
⎟
⎠
+
⎛
⎜
⎝
n
R
n
G
n
B
⎞
⎟
⎠
=
⎛
⎜
⎝
B 00
0 B 0
00B
⎞
⎟
⎠
f + n,(5)
Miguel Vega et al. 3
f
c
H
l
H
h
H
l
H
h
H
l
H
h
W
ll
f
c
W
lh
f
c
W
hl
f
c
W
hh
f
c
Figure 3: Two-level filter bank.
where B is an (M
1
× M
2
) × (M
1
× M
2
) matrix that defines
the systematic blur of the camera, assumed to be known and
approximated by a block circulant matrix, f denotes the real
underlying high-resolution color image we are t rying to es-
timate, and n denotes white independent uncorrelated noise
between and within channels with variance 1/β
c
in channel
c
∈{R, G, B}. See [25] and references therein for a complete
description of the blurring process in color images. Substi-
tuting this equation in (4), we have that the discrete low-
resolution observed images can be written as
g
R
1,1
= D
1,1
Bf
R
+ D
1,1
n
R
, g
G
1,0
= D
1,0
Bf
G
+ D
1,0
n
G
,
g
G
0,1
= D
0,1
Bf
G
+ D
0,1
n
G
, g
B
0,0
= D
0,0
Bf
B
+ D
0,0
n
R
,
(6)
where we have the following distributions for the subsampled
noise:
D
1,1
n
R
∼N
0,
1/β
R
I
N
1
×N
2
, D
1,0
n
G
∼ N
0, (1/β
G
I
N
1
×N
2
)
,
D
0,1
n
G
∼N
0, (1/β
G
I
N
1
×N
2
)
, D
0,0
n
B
∼ N
0,
1/β
B
I
N
1
×N
2
.
(7)
From the above formulation, our goal has become the re-
construction of a complete RGB M
1
×M
2
high-resolution im-
age f from the incomplete set of observations, g
obs
in (3). In
other words, our deconvolution problem has taken the form
of a super-resolution reconstruction one. We can therefore
apply the theory developed in [23, 26], by taking into account
that we are dealing with multichannel images, and therefore
the relationship between channels has to be included in the
deconvolution process [25].
3. BAYESIAN RECONSTRUCTION OF
THE COLOR IMAGE
Let us consider first the reconstruction of channel c assuming
that the observed data g
obs c
and also the real images f
c
and
f
c
,withc
= c and c
= c,areavailable.
In order to apply the Bayesian paradigm to this problem,
we define p
c
(f
c
), p
c
(f
c
|f
c
), p
c
(f
c
|f
c
), and p
c
(g
obs c
|f
c
)and
use the global distribution
p
c
f
c
, f
c
, f
c
, g
obs c
=
p
c
f
c
p
c
f
c
|f
c
p
c
f
c
|f
c
p
c
g
obs c
|f
c
.
(8)
Smoothness within channel c is modelled by the intro-
duction of the following prior distribution for f
c
:
p
f
c
|α
c
|) ∝
α
c
M
1
×M
2
/2
exp
−
1
2
α
c
Cf
c
2
,(9)
where α
c
> 0andC denotes the Laplacian operator.
To defin e p
c
(f
c
|f
c
) and similarly p
c
(f
c
|f
c
), we proceed
as follows. A two-level bank of undecimated separable two-
dimensional filters constructed from a lowpass filter H
l
(with
impulse response h
l
= [121]/4) and a highpass filter H
h
(h
h
= [1−21]/4) is applied to f
c
− f
c
obtaining the approxi-
mation subband W
ll
(f
c
−f
c
), and the horizontal W
lh
(f
c
−f
c
),
vertical W
hl
(f
c
− f
c
), and diagonal W
hh
(f
c
− f
c
)detailsub-
bands [7] (see Figure 3), where
W
uv
= H
u
⊗ H
v
,foruv ∈{ll, lh,hl, hh}. (10)
With these decomposition differences between channels, for
high-frequency components are penalized by the introduc-
tion of the following probability distribution:
p
c
f
c
|f
c
, γ
cc
∝
A
γ
cc
−1/2
× exp
−
1
2
uv∈H B
γ
cc
uv
W
uv
f
c
− f
c
2
,
(11)
where H B
={lh, hl, hh}, γ
cc
uv
measures the similarity of the
uv band of the c and c
channels, γ
cc
={γ
cc
uv
|uv ∈ H B},and
A
γ
cc
=
uv∈H B
γ
cc
uv
W
t
uv
W
uv
. (12)
Before proceeding with the description of the observa-
tion model used in our formulation, we provide a justifica-
tion of the prior model introduced at this point. The model
is based on prior results in the literature. It was observed, for
example, in [7] that for natural color images, there is a high
correlation b etween red, green, and blue channels and that
this correlation is higher for the high-frequency subbands
(lh, hl, hh). The effect of CFA sampling on these subbands
was also examined in [7], w here it was shown that the high-
frequency subbands of the red and blue channels, especially
the lh and hl subbands, are the ones affected the most by the
downsampling process. Based on these observations, con-
straint sets were defined, within the POCS framework, that
forced the high-frequency components of the red and blue
channels to be similar to the hig h-frequency components of
the green channel.
We initially followed the results in [7] within the Bayesian
framework for demosaicing by introducing a prior that
forced red and blue high-frequency components to be sim-
ilar to those of the green channel. Using this prior, the im-
provements of the red and blue channels were in most cases
higher, however, than the improvement corresponding to the
green channel. This led us to introduce a prior, see (8)and
(11), that favors similarity between the high-frequency com-
ponents of all the three channels. The relative weights of the
similarities between different channels are modulated by the
γ
cc
uv
parameters, which are determined automatically by the
proposed method, as explained b elow.
4 EURASIP Journal on Applied Signal Processing
From the model in (6), we have
p
c
g
obs c
|f
c
, β
c
∝
⎧
⎪
⎪
⎪
⎪
⎪
⎪
⎪
⎪
⎪
⎪
⎪
⎪
⎪
⎪
⎪
⎪
⎨
⎪
⎪
⎪
⎪
⎪
⎪
⎪
⎪
⎪
⎪
⎪
⎪
⎪
⎪
⎪
⎪
⎩
β
R
N
1
×N
2
/2
exp
−
β
R
2
g
R
1,1
− D
1,1
Bf
R
2
if c = R,
β
G
N
1
×N
2
exp
−
β
G
2
g
G
1,0
− D
1,0
Bf
G
2
+
g
G
0,1
−D
0,1
Bf
G
2
if c =G,
β
B
N
1
×N
2
/2
exp
−
β
B
2
g
B
0,0
− D
0,0
Bf
B
2
if c = B.
(13)
Note that from the above definitions of the probability
density functions, the distribution in (8) depends on a set of
unknown parameters and has to be properly written as
p
c
f
c
, f
c
, f
c
, g
obs c
|Θ
c
, (14)
where
Θ
c
=
α
c
, γ
cc
, γ
cc
, β
c
. (15)
Having defined the involved distributions and the un-
known parameters, the Bayesian analysis is performed to
estimate the parameter vector Θ
c
and the unknown high-
resolution band f
c
. It is important to remember that we are
assuming that f
c
and f
c
are known.
The process to estimate Θ
c
and f
c
is described by the
following algorithm which corresponds to the so-called ev-
idence analysis within the Bayesian paradigm [27].
Given f
c
and f
c
(1) Find
Θ
c
f
c
, f
c
=
arg max
Θ
c
p
c
f
c
, f
c
, g
obs c
|Θ
c
=
arg max
Θ
c
f
c
p
c
f
c
, f
c
, f
c
, g
obs c
|Θ
c
df
c
(16)
(2) Find an estimate of channel c using
f
c
Θ
c
f
c
, f
c
=
arg max
f
c
p
c
f
c
|f
c
, f
c
, g
obs c
,
Θ
c
f
c
, f
c
(17)
Algorithm 1: Estimation of Θ
c
and f
c
assuming that f
c
and f
c
are
known.
In order to find the hyperparameter vector
Θ
c
and the
reconstruction of channel c, we use the iterative method de-
scribed in [22, 23].
We now proceed to estimate the whole color image from
the incomplete set of observations provided by the single-
CCD camera.
Let us assume that we have initial estimates of the three
channels f
R
(0), f
G
(0), and f
B
(0); then we can improve the
quality of the reconstruction by using the following proce-
dure.
(1) Given f
R
(0), f
G
(0), and f
B
(0), initial estimates of the
bands of the color image and Θ
R
(0), Θ
G
(0), and Θ
B
(0) of the
model parameters
(2) Set k
= 0
(3) Calculate
f
R
(k +1)=
f
R
Θ
R
f
G
(k), f
B
(k)
(18)
by running Algorithm 1 on channel R with f
G
= f
G
(k)and
f
B
= f
B
(k)
(4) Calculate
f
G
(k +1)=
f
G
Θ
G
f
R
(k +1),f
B
(k)
(19)
by running Algorithm 1 on channel G with f
R
= f
R
(k +1)
and f
B
= f
B
(k)
(5) Calculate
f
B
(k +1)=
f
B
Θ
B
f
R
(k +1),f
G
(k +1)
(20)
by running Algorithm 1 on channel B with f
R
= f
R
(k +1)and
f
G
= f
G
(k +1)
(6) Set k
= k + 1 and go to step 3 until a convergence criterion
is met.
Algorithm 2: Reconstruction of the color image.
4. ON THE CONSISTENCY OF THE GLOBAL
DISTRIBUTION ON THE COLOR IMAGE
In this section, we examine the use of one global pr ior distri-
bution on the whole color image instead of using one distri-
bution for each channel.
We could replace the distribution p
c
(f
c
, f
c
, f
c
, g
obs c
)in
(8), tailored for channel c, by the global distribution
p
f
R
, f
G
, f
B
, g
obs
=
p
f
R
, f
G
, f
B
c∈{R,G,B}
p
c
g
obs c
|f
c
,
(21)
with
p
f
R
, f
G
, f
B
∝
exp
−
1
2
c∈{R,G,B}
α
c
Cf
c
2
−
1
2
cc
∈{RG,GB,RB}
uv∈HB
γ
cc
uv
W
uv
f
c
− f
c
2
,
(22)
where W
uv
hasbeendefinedin(10), α
c
measures the smooth-
ness w ithin channel c,andγ
cc
uv
measures the similarity of the
uv band in channels c and c
(see (9)and(11)), respectively.
Note that the difference between the models for each
channel c in (8) and the one in (21) is that we are not al-
lowing in this new model the case γ
cc
uv
= γ
c
c
uv
.
We have also used this approach in the experiments.
This consistent model can easily be implemented by using
Algorithm 2 and forcing γ
cc
uv
= γ
c
c
uv
. The results obtained
were poorer in terms of improvement in the signal-to-noise
Miguel Vega et al. 5
(a) (b) (c) (d)
Figure 4: First image set used in the experiments.
ratio. We conjecture that this is due to the fact that the num-
ber of observations in each channel is not the same, and
therefore each channel has to be responsible for the estima-
tion of the associated hyper parameters.
5. EXPERIMENTAL RESULTS
Experiments were carried out with RGB color images in or-
der to evaluate the performance of the proposed method and
compare it with other existing ones. Although visual inspec-
tion of the restored images is a very important quality mea-
sure, in order to get quantitative image quality comparisons,
the signal-to-noise ratio improvement (Δ
SNR
) for each ch an-
nelisused,givenindBby
Δ
c
SNR
= 10 × log
10
f
c
− g
pad c
2
f
c
−
f
c
2
, (23)
for c
∈{R, G,B},wheref
c
and
f
c
are the original and es-
timated high-resolution images, and g
pad c
is the result of
padding missing values at the incomplete observed image
g
obs c
(3) with zeroes. The mean metric distance ΔE
∗
ab
[28]
in the perceptually uniform CIE-L
∗
a
∗
b
∗
color space, be-
tween restored a nd original images, was also used as a figure
of merit. In transforming from RGB to CIE-L
∗
a
∗
b
∗
color
space, we have used the CIE standard illuminant D65 as ref-
erence white and assumed Rec. 709 RGB primaries (see [29]).
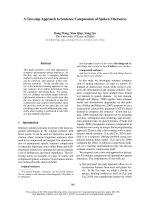
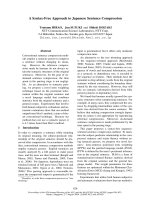
Results obtained for two image sets are reported. The first
image set is formed by four images of size 256
× 384 taken
from [6] a nd shown in Figure 4. Four images of size 640
×480
taken with a 3 CCD color camera (shown in Figure 5) are also
used in the experiments.
In order to test the deconvolution method proposed in
Algorithm 2, the original images were blurred and then sam-
pled applying a Bayer pattern to get the observed images that
were to be reconstructed. Figure 6 illustrates the procedure
used to simulate the observation process with a Bayer cam-
era.
It is interesting to observe how blurring and the appli-
cation of a Bayer pattern interact (see also [21]). Figure 7(a)
shows the reconstruction of one CCD observed out-of-focus
color image while Figure 7(b) shows the reconstruction of
one CCD observed color image (no blur present), using in
both cases zero-order hold interpolation. As it can be ob-
served, Figure 7(b) image suffers from the zipper effect in the
whole image and exhibits a moir
´
e pattern on the wall on the
left part of the image. Figure 7(a) shows how blurring may
cancel these effects even in the absence of a demosaicing step,
at the cost of information loss.
Thereisnotmuchworkreportedonthedeconvolutionof
color images acquired with a single sensor. In order to com-
pare our method with others, we have applied a deconvolu-
tion step to the output of well-know n demosaicing methods.
For this deconvolution step, a simultaneous autoregressive
(SAR) prior model was used on each channel independently.
The underlying idea is that for these methods, the demosaic-
ing step reconstructs, from the incomplete observed g
obs
(3),
the blurred image g that would have been observed with a 3
CCD camera. The degradation model for f is given by (5).
WethenperformedaBayesianrestorationforeveryc chan-
nel with the probability density
p
c
f
c
, g
c
|α
c
, β
c
=
p
c
f
c
|α
c
p
c
g
c
|f
c
, β
c
, (24)
with p
c
(f
c
|α
c
)givenby(9)and(see[27] for details)
p
c
g
c
|f
c
, β
c
∝
β
c
(N
1
×N
2
)/2
exp
−
β
c
2
g
c
− Bf
c
2
. (25)
Let us now examine the experiments. For the first one,
we used an out-of-focus blur with radius R
= 2. The blurring
function is given by
h(r)
∝
⎧
⎨
⎩
1if0≤ r ≤ R,
0ifr>R,
(26)
with normalization needed for conserving the image flux.
6 EURASIP Journal on Applied Signal Processing
(a) (b)
(c) (d)
Figure 5: Second image set used in the experiments.
Blurring
Bayer
pattern
Original image Observed image
Figure 6: Observation process of a blurred image using a Bayer camera.
(a) (b)
Figure 7: (a) Zero-order hold reconstruction with blur present, and (b) without blur.
Miguel Vega et al. 7
(a) (b) (c)
(d) (e) (f)
Figure 8: (a) Details of the original image of Figure 4(a), ( b) blurred image, (c) deconvolution after applying bilinear reconstruction, (d)
deconvolution after applying the method of Laroche and Prescott [5], (e) deconvolution after applying the method of Gunturk et al. [7], and
(f) our method.
Table 1: Out-of-focus deblurring Δ
SNR
(dB).
Original
Bilinear
Laroche and Gunturk Our
image Prescott [5]etal.[7] method
Figure 4(a)
R
18.1 18.0 19.6 21.5
Figure 4(a)
G
16.7 17.0 17.4 19.4
Figure 4(a)
B
16.4 17.4 18.1 19.9
Figure 4(b)
R
20.9 20.8 22.8 24.7
Figure 4(b)
G
20.6 20.8 21.1 23.5
Figure 4(b)
B
20.8 22.1 22.2 24.5
Figure 4(c)
R
19.6 18.8 21.8 24.6
Figure 4(c)
G
18.8 19.1 19.6 22.3
Figure 4(c)
B
17.2 18.4 19.7 21.8
Figure 4(d)
R
18.4 18.0 18.2 22.3
Figure 4(d)
G
17.0 17.1 17.6 20.3
Figure 4(d)
B
16.9 18.2 18.3 20.9
Figure 5(a)
R
21.2 21.8 24.9 25.4
Figure 5(a)
G
20.6 22.4 23.1 23.3
Figure 5(a)
B
19.8 23.1 23.4 23.3
Figure 5(b)
R
21.2 23.3 25.1 25.5
Figure 5(b)
G
21.5 23.2 23.9 24.0
Figure 5(b)
B
21.9 25.2 25.8 25.1
Figure 5(c)
R
22.3 21.8 23.4 26.2
Figure 5(c)
G
22.8 21.8 21.9 25.4
Figure 5(c)
B
22.2 23.3 23.6 27.2
Figure 5(d)
R
18.7 19.8 22.2 24.5
Figure 5(d)
G
18.9 20.2 21.0 23.1
Figure 5(d)
B
18.5 21.4 22.2 24.4
Table 2: Out-of-focus deblurring ΔE
∗
ab
.
Original
Bilinear
Laroche and Gunturk Our
image Prescott [5]etal.[7] method
Figure 4(a) 3.0 3.5 2.8 2.2
Figure 4(b) 1.9 2.4 2.0 1.4
Figure 4(c) 3.3 3.8 2.9 2.2
Figure 4(d) 3.2 3.7 3.2 2.6
Figure 5(a) 2.4 2.3 1.6 1.4
Figure 5(b) 4.5 5.3 5.2 3.6
Figure 5(c) 1.6 2.9 2.9 1.1
Figure 5(d) 8.1 13.4 14.7 7.4
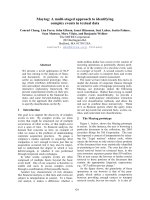
Figure 8 shows the image of Figure 4(a) and its blurred
observation, just before the application of the Bayer pattern.
Figure 8 shows also the reconstruction obtained by bilin-
ear interpolation followed by deconvolution, and deconvo-
lutions of the results of demosaicing the blurred image with
the methods proposed by Laroche and Prescott [5] and Gun-
turk et al. [7]. Figure 8(f) shows the result obtained with the
application of Algorithm 2. Figure 8 shows how demosaic-
ing may introduce the undesirable effects that blurring had
cancelled. This fact is more noticeable for bilinear interpo-
lation but remains in the Laroche and Prescott method [5].
The method of [7]isveryefficient in demosaicing, but our
method gives better results in demosaicing while recovering
8 EURASIP Journal on Applied Signal Processing
(a) (b) (c)
(d) (e) (f)
Figure 9: (a) Details of the original image of Figure 5(a), (b) out-of-focus image, (c) deconvolution after applying bilinear reconstruction,
(d) deconvolution after applying the method of Laroche and Prescott [5], (e) deconvolution after applying the method of Gunturk et al. [7],
and (f) our method.
Table 3: Motion deblurring Δ
SNR
(dB).
Original
Bilinear
Laroche and Gunturk Our
image Prescott [5]etal.[7] method
Figure 4(a)
R
18.1 17.1 17.9 22.8
Figure 4(a)
G
18.4 15.8 15.6 21.1
Figure 4(a)
B
16.3 16.4 16.7 21.2
Figure 4(b)
R
21.0 19.1 19.9 26.4
Figure 4(b)
G
22.6 19.0 18.6 25.6
Figure 4(b)
B
21.0 19.8 19.8 26.3
Figure 4(c)
R
20.1 17.0 19.4 27.0
Figure 4(c)
G
21.1 17.4 17.3 25.3
Figure 4(c)
B
17.5 17.3 18.0 23.8
Figure 4(d)
R
19.0 16.9 17.4 24.9
Figure 4(d)
G
19.3 16.1 15.7 23.6
Figure 4(d)
B
17.0 16.9 16.8 24.0
Figure 5(a)
R
21.0 19.7 22.6 25.6
Figure 5(a)
G
21.7 20.6 20.7 23.8
Figure 5(a)
B
19.6 21.5 21.5 24.0
Figure 5(b)
R
20.7 21.4 22.6 24.6
Figure 5(b)
G
22.0 21.0 21.1 23.5
Figure 5(b)
B
21.4 22.6 22.8 24.6
Figure 5(c)
R
21.6 20.3 23.4 23.7
Figure 5(c)
G
22.4 22.0 21.8 22.7
Figure 5(c)
B
21.4 23.2 23.3 23.8
Figure 5(d)
R
18.2 17.5 20.3 23.3
Figure 5(d)
G
19.9 18.8 18.7 21.9
Figure 5(d)
B
18.0 20.2 20.2 22.9
Table 4: Motion deblurring ΔE
∗
ab
.
Original
Bilinear
Laroche and Gunturk Our
image Prescott [5]etal.[7] method
Figure 4(a) 3.7 4.2 3.1 1.9
Figure 4(b) 2.3 3.0 2.4 1.2
Figure 4(c) 3.8 4.0 3.2 1.9
Figure 4(d) 3.7 4.9 4.5 2.1
Figure 5(a) 3.0 3.4 1.8 1.3
Figure 5(b) 4.9 6.1 6.0 3.3
Figure 5(c) 1.8 2.4 1.6 1.4
Figure 5(d) 8.8 13.2 13.8 6.9
the information lost with blurring, probably at the cost of a
light aliasing effect.
Table 1 compares, in terms of Δ
SNR
, the results obtained
by deconvolved bilinear interpolation and by the above-
mentioned methods to deconvolve single-CCD observed
color images. Ta bl e 2 compares the results obtained in terms
of ΔE
∗
ab
color differences. Figure 9 shows details correspond-
ing to the reconstruction of Figure 5(a),andFigure 10 shows
the reconstructions corresponding to Figure 5(c).Itcanbe
observed that in all cases, the proposed method produces
better reconstructions both in terms of perceptual quality
ΔE
∗
ab
and Δ
c
SNR
values. Figure 11 shows the convergence rate
of Algorithm 2 in the reconstruction of an image from the
first set (see Figure 4(a)).
Miguel Vega et al. 9
(a) (b) (c)
(d) (e) (f)
Figure 10: (a) Original image of Figure 5(c), (b) out-of-focus image, (c) deconvolution after applying bilinear reconstruction, (d) deconvo-
lution after applying the method of Laroche and Prescott [5], (e) deconvolution after applying the method of Gunturk et al. [7], and (f) our
method.
0.1
0.01
0.001
0.0001
1e
− 05
1e
− 06
|| f
c
n
– f
c
n –1
||
2
/|| f
c
n –1
||
2
123455
R
G
B
(a)
0.007
0.006
0.005
0.004
0.003
0.002
0.001
0
α
c
1234 5
R
G
B
(b)
1000
100
10
1
0.1
β
c
12345
R
G
B
(c)
2
1.8
1.6
1.4
1.2
1
0.8
0.6
0.4
0.2
0
γ
cc´
lh
12345
RG at 2.3
RB at 2.3
GB at 2.4
RG at 2.4
RB at 2.5
GB at 2.5
(d)
2
1.8
1.6
1.4
1.2
1
0.8
0.6
0.4
0.2
0
γ
cc´
hl
12345
RG at 2.3
RB at 2.3
GB at 2.4
RG at 2.4
RB at 2.5
GB at 2.5
(e)
2
1.8
1.6
1.4
1.2
1
0.8
0.6
0.4
γ
cc´
hh
12345
RG at 2.3
RB at 2.3
GB at 2.4
RG at 2.4
RB at 2.5
GB at 2.5
(f)
Figure 11: Several plots (a) convergence rate, (b) α
c
,(c)β
c
,(d)γ
cc
lh
,(e)γ
cc
hl
, and (f) γ
cc
hh
versus iterations corresponding to the application of
Algorithm 2 to the reconstruction of the image of Figure 4(a), for out-of-focus blurring.
10 EURASIP Journal on Applied Signal Processing
(a) (b) (c)
(d) (e) (f)
Figure 12: (a) Details of the original image of Figure 4(c) , (b) image blurred with horizontal motion, (c) deconvolution after applying
bilinear reconstruction, (d) deconvolution after applying the method of Laroche and Prescott [5], (e) deconvolution after applying the
method of Gunturk et al. [7], and (f) our method.
In the second experiment, we investigated the behavior of
our method under motion blur. The blurring function used
is given by
h(x, y)
=
⎧
⎪
⎨
⎪
⎩
1
L
if (0
≤ x<L), (y = 0),
0 otherwise,
(27)
L is the displacement by the horizontal motion. A displace-
ment of L
= 3 pixels was used. A Bayer pattern was also ap-
plied to the images, as in the first experiment.
Table 3 compares the Δ
c
SNR
values obtained by the above
mentioned methods to deconvolve single-CCD observed
color images for the different images under consideration.
Table 4 compares the results obtained in terms of ΔE
∗
ab
color
differences. Figures 12 and 13 show details of the images of
Figures 4(d) and 5(b), respectively, their observations, and
their corresponding restorations. Algorithm 2 obtains, in this
case again, better reconstructions than deconvolved bilinear
interpolation and the methods in [5]and[7], based on visual
examination, and in the numeric values in Tables 3 and 4.
In all experiments, the proposed Algorithm 2 was run
using as initial image estimates bilinearly interpolated im-
ages, and the initial values α
c (0)
= 0.001, β
c (0)
= 1000.0,
and γ
cc
(0)
uv
= 2.0(foralluv ∈ HB and c
= c)forall
c
∈{R, G, B}. The convergence criterion utilized was
f
c
(k +1)− f
c
(k)
2
f
c
(k)
2
≤ , (28)
with values for
between 10
−5
and 10
−7
.
It has been very helpful for the elaboration of this exper-
imental section the description in [2] of the method in [5],
and the code for the method in [7] accessible in [30].
6. CONCLUSIONS
In this paper, the deconvolution problem of color images
acquired with a single sensor has b een formulated from a
super-resolution point of view. A new method for estimating
both the reconstructed color images and the model parame-
ters, within the Bayesian framework, was obtained. Based on
the presented experimental results, the new method outper-
forms the application of deconvolution techniques to well-
established demosaicing methods.
Miguel Vega et al. 11
(a) (b) (c)
(d) (e) (f)
Figure 13: (a) Details of the original image of Figure 5(b), (b) image blurred with horizontal motion, (c) deconvolution after applying
bilinear reconstruction, (d) deconvolution after applying the method of Laroche and Prescott [5], (e) deconvolution after applying the
method of Gunturk et al. [7], and (f) our method.
ACKNOWLEDGMENT
This work has been supported by the “Comisi
´
on Nacional de
Ciencia y Tecnolog
´
ıa” under Contract TIC2003-00880.
REFERENCES
[1] B. E. Bayer, “Color imaging array,” 1976, United States Patent
3,971,065.
[2] R. Ramanath, “Interpolation methods for the Bayer color
array,” Ph.D. dissertation, North Carolina State University,
Raleigh, NC, USA, 2000.
[3] D. R. Cok, “Signal processing method and apparatus for pro-
ducing interpolated chrominance values in a sampled color
image signal,” 1987, United States Patent 4,642,678.
[4] T. W. Freeman, “Median filter for reconstructing missing color
samples,” 1988, United States Patent 4,724,395.
[5] C. A. Laroche and M. A. Prescott, “Apparatus and method for
adaptively interpolating a full color image utilizing chromi-
nance gradients,” 1994, United States Patent 5,373,322.
[6] R. kimmel, “Demosaicing: image reconstruction from color
CCD samples,” IEEE Transactions Image Processing, vol. 8,
no. 9, pp. 1221–1228, 1999.
[7] B. K. Gunturk, Y. Altunbasak, and R. M. Mersereau, “Color
plane interpolation using alternating projections,” IEEE Trans-
actions Image Processing, vol. 11, no. 9, pp. 997–1013, 2002.
[8] P. Scheunders, “An orthogonal wavelet representation of mul-
tivalued images,” IEEE Transactions Image Processing, vol. 12,
no. 6, pp. 718–725, 2003.
[9] L.D.Alvarez,R.Molina,andA.K.Katsaggelos,“Highresolu-
tion images from a sequence of low resolution observations,”
in Digital Image Sequence Processing, Compression and Analy-
sis, T. R. Reed, Ed., chapter 9, pp. 233–259, CRC Press, Boca
Raton, Fla, USA, 2004.
[10] M. K. Ng, R. H. Chan, T. F. Chan, and A. M. Yip, “Cosine
transform preconditioners for high resolution image recon-
struction,” Linear Algebra and its Applications, vol. 316, no. 1-
3, pp. 89–104, 2000.
[11] N. Nguyen and P. Milanfar, “A wavelet-based interpolation-
restoration method for superresolution,” Circuits, Systems, and
Signal Processing, vol. 19, no. 4, pp. 321–338, 2000.
[12] N. Nguyen, P. Milanfar, and G. Golub, “A computationally ef-
ficient superresolution image reconstruction algorithm,” IEEE
Transactions Image Processing, vol. 10, no. 4, pp. 573–583,
2001.
[13] M. K. Ng and A. M. Yip, “A fast MAP algorithm for high-
resolution image reconstruction with multisensors,” Multidi-
mensional Systems and Signal Processing, vol. 12, no. 2, pp.
143–164, 2001.
[14] M. G. Kang and S. Chaudhuri, “Super-resolution image recon-
struction,” IEEE Sig nal Processing Magzine,vol.20,no.3,pp.
19–20, 2003.
12 EURASIP Journal on Applied Signal Processing
[15] N. K. Bose, R. H. Chan, and M. K. Ng, “Special issue on hig h-
resolution image reconstruction. I. Guest editorial,” Interna-
tional Journal of Imaging Systems and Technology,vol.14,no.2,
pp. 35–35, 2004.
[16] E. Choi, J. Choi, and M. G. Kang, “Super-resolution ap-
proach to overcome physical limitations of imaging sensors: an
overview,” International Journal of Imaging Systems and Tech-
nology, vol. 14, no. 2, pp. 36–46, 2004.
[17] S. Farsiu, D. Robinson, M. Elad, and P. Milanfar, “Advances
and challenges in super-resolution,” International Journal of
Imaging Systems and Technology, vol. 14, no. 2, pp. 47–57,
2004.
[18] A. Zomet and S. Peleg, “Multi-sensor super-resolution,” in
Proceedings of 6th IEEE Workshop on Applications of Computer
Vision (WACV ’02), pp. 27–31, Orlando, Fla, USA, December
2002.
[19] S. Farsiu, M. Elad, and P. Milanfar, “Multiframe demosaic-
ing and super-resolution from undersampled color images,”
in Computational Imaging II, vol. 5299 of Proceedings of SPIE,
pp. 222–233, San Jose, Calif, USA, January 2004.
[20] T. Gotoh and M. Okutomi, “Direct super-resolution and
registration using raw CFA images,” in Proceedings of IEEE
Computer Society Conference on Computer Vision and Pattern
Recognition (CVPR ’04), vol. 2, pp. 600–607, Washington, DC,
USA, June–July 2004.
[21] S. Farsiu, M. Elad, and P. Milanfar, “Multi-frame demosaic-
ing and super-resolution of color images,” IEEE Transactions
Image Processing, vol. 15, no. 1, pp. 141–159, 2006.
[22] J. Mateos, R. Molina, and A. K. Katsaggelos, “Bayesian high
resolution image reconstruction with incomplete multisensor
low resolution systems,” in Proceedings of IEEE International
Conference on Acoustics, Speech, and Signal Processing (ICASSP
’03), vol. 3, pp. 705–708, Hong Kong, April 2003.
[23] R.Molina,M.Vega,J.Abad,andA.K.Katsaggelos,“Param-
eter estimation in Bayesian high-resolution image reconstruc-
tion with multisensors,” IEEE Transactions Image Processing,
vol. 12, no. 12, pp. 1655–1667, 2003.
[24] A. K. Katsaggelos, K. T. Lay, and N. P. Galatsanos, “A general
framework for frequency domain multi-channel signal pro-
cessing,” IEEE Transactions Image Processing,vol.2,no.3,pp.
417–420, 1993.
[25] R. Molina, J. Mateos, A. K. Katsaggelos, and M. Vega,
“Bayesian multichannel image restoration using compound
Gauss-Markov random fields,” IEEE Transactions Image Pro-
cessing, vol. 12, no. 12, pp. 1642–1654, 2003.
[26] J. Mateos, M. Vega, R. Molina, and A. K. Katsaggelos,
“Bayesian image estimation from an incomplete set of blurred,
undersampled low resolution images,” in Proceedings of 1st
Iberian Conference on Pattern Recognition and Image Analysis
(IbPRIA ’03), vol. 2652 of Lecture Notes in Computer Science,
pp. 538–546, Puerto de Andratx, Mallorca, Spain, June 2003.
[27] R. Molina, A. K. Katsaggelos, and J. Mateos, “Bayesian and reg-
ularization methods for hyperparameter estimation in image
restoration,” IEEE Transactions Image Processing, vol. 8, no. 2,
pp. 231–246, 1999.
[28] Commission Internationale de L’
´
Eclairage, Colorimetry,CIE,
Vienna, Austria, 2nd edition, 1986, publication CIE no. 15.2.
[29] International Telecommunication Union, Basic Parameter Val-
ues for the HDT V Standard for the Studio and for International
Programme Exchange, ITU, Geneva, Switzerland, 1990, ITU-R
Recommendation BT.709.
[30] Y. Altunbasak, 2002, available at: />research/labs/MCCL/research/topic05.html.
Miguel Vega was born 1956 in Spain. He
received his Bachelor Physics degree from
Universidad de Granada (1979) and P h.D.
degree from Universidad de Granada (De-
partmento de F
´
ısica Nuclear, 1984). He is
astaff member (1984–1987) and Direc-
tor (1989–1992) of the Computing Cen-
ter Facility of Universidad de Granada. He
is a Lecturer 1987 till now in the ETS
Ingerier
´
ıa Inform
´
atica of Universidad de
Granada (Departmento de Lenguajes y Sistemas Inform
´
aticos). He
teaches software engineering. His research focuses on image pro-
cessing (multichannel and super-resolution image reconstruction).
He has collaborated at several projects from the Spanish Research
Council.
Rafael Molina was born in 1957. He re-
ceived the degree in mathematics (statis-
tics) in 1979 and the Ph.D. degree in op-
timal design in linear models in 1983. He
became Professor of computer science and
artificial intelligence at the University of
Granada, Granada, Spain, in 2000. His ar-
eas of research interest are image restoration
(applications to astronomy and medicine),
parameter estimation in image restoration,
low-to-high image and video, and blind deconvolution. Dr. Molina
is a Member of SPIE, Royal Statistical Society, and the Asociaci
´
on
Espa
˜
nola de Reconocimiento de Formas y An
´
alisis de Im
´
agenes
(AERFAI).
Aggelos K. Katsaggelos received the
Diploma degree in electrical and mechan-
ical engineering from the Aristotelian
University of Thessaloniki, Greece, in 1979
and the M.S. and Ph.D. degrees both in
electrical engineering from the Georgia
Institute of Technology, in 1981 and 1985,
respectively. He is currently a Professor of
electrical engineering and computer science
at Northwestern University and also the Di-
rector of the Motorola Center for Seamless Communications and
a Member of the academic affiliate staff, Department of Medicine,
at Evanston Hospital. He is the Editor of Digital Image Restoration
(New York, Springer, 1991), coauthor of Rate-Distortion Based
Video Compression (Kluwer, Norwell, 1997), and coeditor of
Recovery Techniques for Image and Video Compression and
Transmission (Kluwer, Norwell, 1998), and the coinventor of
ten international patents. Dr. Katsaggelos is a Member of the
Publication Board of the IEEE Proceedings, and has served as the
Editor-in-Chief of the IEEE Signal Processing Magazine (1997–
2002), He is the recipient of the IEEE Third Millennium Medal
(2000), the IEEE Signal Processing Society Meritorious Service
Award (2001), and an IEEE Signal Processing Society Best Paper
Award (2001).