Báo cáo hóa học: " Towards Inferring Protein Interactions: Challenges and Solutions" ppt
Bạn đang xem bản rút gọn của tài liệu. Xem và tải ngay bản đầy đủ của tài liệu tại đây (3.23 MB, 14 trang )
Hindawi Publishing Corporation
EURASIP Journal on Applied Signal Processing
Volume 2006, Article ID 37349, Pages 1–14
DOI 10.1155/ASP/2006/37349
Towards Inferring Protein Interactions:
Challenges and Solutions
Ya Zhang,1, 2 Hongyuan Zha,3 Chao-Hsien Chu,4 and Xiang Ji5
1 Information
and Telecommunication Technology Center, The University of Kansas, Lawrence, KS 66045, USA
of Electrical Engineering and Computer Science, The University of Kansas, Lawrence, KS 66045, USA
3 Department of Computer Science and Engineering, School of Engineering, Pennsylvania State University,
University Park, PA 16802, USA
4 College of Information Sciences and Technology, Pennsylvania State University, University Park, PA 16802-6823, USA
5 NEC Laboratories America, Inc., Cupertino, CA 95014, USA
2 Department
Received 1 May 2005; Revised 13 October 2005; Accepted 15 December 2005
Discovering interacting proteins has been an essential part of functional genomics. However, existing experimental techniques
only uncover a small portion of any interactome. Furthermore, these data often have a very high false rate. By conceptualizing the
interactions at domain level, we provide a more abstract representation of interactome, which also facilitates the discovery of unobserved protein-protein interactions. Although several domain-based approaches have been proposed to predict protein-protein
interactions, they usually assume that domain interactions are independent on each other for the convenience of computational
modeling. A new framework to predict protein interactions is proposed in this paper, where no assumption is made about domain interactions. Protein interactions may be the result of multiple domain interactions which are dependent on each other. A
conjunctive norm form representation is used to capture the relationships between protein interactions and domain interactions.
The problem of interaction inference is then modeled as a constraint satisfiability problem and solved via linear programing. Experimental results on a combined yeast data set have demonstrated the robustness and the accuracy of the proposed algorithm.
Moreover, we also map some predicted interacting domains to three-dimensional structures of protein complexes to show the
validity of our predictions.
Copyright © 2006 Hindawi Publishing Corporation. All rights reserved.
1.
INTRODUCTION
Proteins usually perform their functions in a collaborative
fashion by interacting with each other. Uncovering the complex structures of protein interaction network is essential for
understanding how proteins in a cell function together. Many
computational efforts have been made to predict interacting proteins. The gene fusion/Rosetta method [1, 2] predicts
a pair of proteins to interact if they are encoded separately
as two distinct genes in one organism and are encoded by
one single gene (fused) in another organism. Several other
algorithms explore the use of protein sequences [3], protein structure [4], phylogenetic profiles [5], protein homology [6], gene neighborhood [7], and gene expression correlation [8] for inferring protein-protein interactions. Those
methods are mostly based on protein sequence homology
or structure homology. For example, Goffard et al. [6] infer
two proteins to interact if they are considered to be, respectively, homologous to a pair of interacting proteins accord-
ing to BLAST search [9]. However, similarity in sequence or
structure does not necessarily guarantee similarity in function. Hence the predictions are generally associated with high
error rates.
Recent advances in proteomics have opened up new opportunities for studying protein interactions. A large volume
of protein interaction data has been generated with highthroughput experimental approaches including yeast twohybrid genetic screens [10, 11] and mass spectrometric analysis [12], making possible genome-wide analysis of protein
interactions. However, these high-throughout experiments
inevitably contain many false positives and false negatives
[13]. For example, two genome-wide yeast interaction data
sets obtained via independent experiments [10, 11, 14] have
less than 4% overlap of the identified interactions. This fact
implies that these high-throughput interactions only represent a small portion of the whole interactome. However, the
large size of such high-throughput data makes it impractical, if not impossible, to experimentally verify individual
2
EURASIP Journal on Applied Signal Processing
d1
d2
p2
d3
d5
p4
d6
d1
d2
d3
d5
d2
d5
d2
d3
d4
Protein-protein interactions
d4
p1
p1
d4
p2
d7
p3
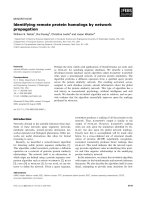
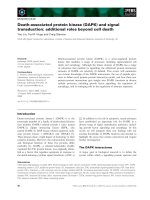
Figure 1: A sketch illustration of how domain interaction contributes to protein interaction. Protein p1 and protein p2 interact
through the binding of domain d1 and domain d2, while the interaction between domain d5 and domain d6 is responsible for the
interaction of protein p2 and protein p3.
interactions. The question—can we infer useful proteinprotein interaction information from those high-throughput
data—arises.
An important factor contributing to protein interactions
is the domain composition of the proteins. Domains are believed to be responsible for protein interactions—proteins
interact through their interacting domains (Figure 1). Because domains are deemed as the building blocks of proteins, an abstract representation of interactome is achieved
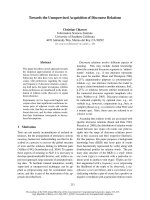
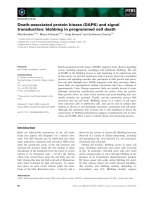
at the domain level (Figure 2). Moreover, this representation
facilitates the discovery of unobserved protein-protein interactions. Several computational approaches were motivated
by this representation and predict protein interactions based
on domain composition of proteins [15–20]: first domaindomain interactions are inferred from high-throughput protein interactions and then the putative domain interactions
are used to predict interacting proteins.
As one of the pioneering studies, an association method
was proposed for inferring over-represented sequencesignature (domain) pairs [19]. Association methods generally assume that co-occurrence of a domain pair in many interacting proteins indicates association—in this case, interaction among the pair of domains. This simple association
method may assign high scores to some domain pairs with
low frequency and the score does not correspond well to the
possibility of interaction. Later Kim et al. [17] improved this
association method by taking into consideration the number of domains in each protein, and Hayashida et al. [16] extended this method to numerical interaction data. The above
association methods are limited in the sense that domaindomain interactions are computed locally, which ignores the
contextual information for each domain, such as the neighbors of the domains.
A graph-theoretical approach, which combines sequence
similarity search with clustering based on interaction patterns and interaction domain information, was proposed in
[20]. The use of domain profile pairs were showed to provide
better predictions than those solely using protein sequences.
However, this method requires a high-quality protein inter-
p3
d5
Domain-domain interaction
Figure 2: Domain-domain interaction provides an abstract representation of protein-protein interaction. Binding of domain d2 to
d5 mediates the interaction between four pairs of proteins: proteins
p1 and p2, proteins p1 and p3, proteins p2 and p4, and proteins p3
and p4.
action map, which is very expensive to obtain in the first
place, to infer protein interactions in another organism.
More recently, several other studies adopted an optimization framework. Deng et al. [15] proposed a probabilistic model for protein interactions and developed a global
method to inferring interacting domains by maximizing the
likelihood of the observed data. Experimental errors were integrated into the likelihood function as two additional parameters (false positive and false negative). The expectation
and maximization (EM) algorithm was used to optimize the
parameters. Hayashida et al. [21] added a notion of interaction “strength” to the probabilistic model, in which the
strength is computed as the ratio of the number of observed
interactions to the number of experiments. The authors tried
to minimize the sum of differences between the computed
strength and the predicted probabilities in training data with
linear programing. One advantage of the method is that constraints can be easily integrated and thus this method can be
easily combined with other existing methods. However, for
the ease of computational modeling, the above probabilistic
models assume that the domain interactions are independent
of each other. This conjecture might be the major source of
errors for these domain-based predictions because proteinprotein interaction could be mediated by multiple domain
interactions and these domain interactions may not be independent.
To overcome the above limitation, we propose here a
new framework of learning without enforcing the independence assumption between domain interactions. The
protein-protein interactions are interpreted as the result
of domain interactions, either dependent or independent.
Hence, our approach is more inclusive than the previous
ones. We express the relationships between protein interactions and domain interactions in conjunctive norm forms.
This representation naturally leads to the formulation of the
interaction inference problem as a satisfiability (SAT) problem. This problem is then solved with linear programing. The
prediction framework is characterized in the following two
aspects. First, the proposed framework makes no assumption on the dependency/independency of domain interactions. Second, when formulating the inference problem as a
SAT problem, prior knowledge about domain interaction or
protein interaction may be easily input into the framework as
additional constraints. The validity of the prediction method
Ya Zhang et al.
3
Uetz et al.
Ito et al.
3277
2422
< 23%
1337
482
855
Proteins
(a)
Uetz et al.
1445
1244
< 4%
201
Ito et al.
4475
4274
Interactions
(b)
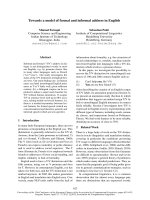
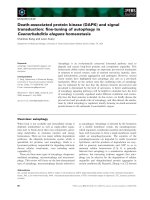
Figure 3: Overlap among the results of two independent large-scale
yeast two-hybrid screens. The Venn diagram indicates the overlap
among the interaction data obtained in two independent experiments [10, 11, 14]. (a) The overlap in terms of proteins. (b) The
overlap in terms of interactions.
is evaluated with yeast protein interactions. Experimental results have demonstrated the robustness and accuracy of the
proposed algorithm.
2.
CHARACTERISTICS OF THE DATA
Although high-throughput experiments have greatly facilitated the study of protein interactions, the high-throughput
data generally contain a large number of false negatives,
creating big challenges in deciphering the interactome. For
example, the genome-wide interaction data for yeast obtained in two independent experiments [10, 11, 14] only have
less than four percentage of overlap for protein interactions
(Figure 3). This lack of overlap between the data sets indicates that the screens to date are far from exhaustive and the
yeast interactome may be much larger than previously estimated. Moreover, the observed protein-protein interaction
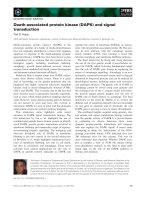
matrix is quite sparse as shown in Figure 4. Most of the proteins are discovered to interact with only one protein. However, Hazbun and Fields [22] estimated that each protein interact with about 5 to 50 proteins. This fact again suggests
that two-hybrid screens reveal a very small portion of the
interactome. It is thus necessary to computationally predict
potential interactions from experimentally identified interacting proteins.
Another significant feature of the data set is that the distribution of domain frequencies is highly skewed. Most domains occur in one or a few proteins and a few domains are
observed frequently in the data set (Figure 5), which leads
to substantially different frequencies among some domains.
The difference in the frequencies could be problematic for
association-based methods for interaction prediction; for example, if domain d1 occurs only once in protein p1 , and domain d2 occurs in all proteins. Although we only observed the
domain pair d12 once, it could still be significant because domain d1 only occurs once. Most association-based methods
do not perform well when the pair of domains have very different frequencies.
3.
INFERRING INTERACTING DOMAIN PAIRS
Our framework of inferring interacting domain pairs is built
upon a widely accepted hypothesis that two proteins interact if and only if at least one pair of domains from the two
proteins interact. Let us denote the set of proteins under investigation as P = { p1 , p2 , . . . , pM } and their corresponding
domains as D = {d1 , d2 , . . . , dN }, where M and N are the
number of proteins and domains. The set of domain pairs
contained in the protein pair pi , p j is then denoted with
Ωi j :
Ωi j =
d1 , d2 | d1 , d2 ∈ pi × p j or p j × pi .
(1)
For any pair of proteins, whether the two proteins interact or not is determined by the interaction of the set of domain pairs contained in the pair of proteins. This relationship may be expressed in conjunctive normal form as
Pi j = ∨dnm ∈Ωi j Dnm ,
(2)
where ∨ means logical “OR”, Pi j is the indicator of whether
proteins pi and p j interact, and Dnm is the indicator of
whether domains dn and dm interact. Both Pi j and Dnm take
binary values with
⎧
⎨1
if proteins pi and p j interact,
Pi j = ⎩
0 otherwise,
⎧
⎨1
Dnm = ⎩
0
(3)
if domains dn and dm interact,
otherwise.
Example 1. Suppose that protein p1 contains domains {d1 ,
d2 } and protein p2 contains domains {d1 , d3 , d5 }. We then
have the set of domain pairs Ω12 = {d11 , d13 , d15 , d21 , d23 ,
d25 }. P12 , the interaction indicator of the protein pair p1 ,
p2 , is expressed in terms of the set of related domain indicators P12 = D11 ∨ D13 ∨ D15 ∨ D21 ∨ D23 ∨ D25 .
The problem of inferring interacting domains from protein interactions is essentially to discover the set of domain
interactions that best fit the protein interaction data. With
the conjunctive norm form of representation, the inference
task essentially is to assign values to domain interaction indicators Dnm (n, m = {1, . . . , N }) and protein interaction indicators Pi j (i, j = {1, . . . , M }) so that all the protein-domain
interaction relationships expressed in (2) are satisfied. This
objective naturally leads the formulation of the interaction
inference problem as a satisfiability problem.
Definition 1. Given a set of p clauses in conjunctive normal
form over q variables, the satisfiability (SAT) problem is to
decide whether there is a truth assignment for the q variables
that satisfies all the clauses.
Due to the high error rates in the interaction data, it is
unlikely to obtain a set of assignment for domain interaction indicators that could simultaneously fit into the whole
interaction data. Therefore, rather than requiring the assignment to accommodate all the protein interactions, we set the
4
EURASIP Journal on Applied Signal Processing
0
0
500
20
Protein ID
Protein ID
1000
1500
2000
40
60
2500
80
3000
3500
100
0
1000
2000
Protein ID
3000
0
20
(a)
40
60
Protein ID
80
100
(b)
4
1200
3.5
3
800
2.5
Frequency
Frequency
1000
600
2
1.5
400
1
200
0.5
0
5 10 15 20 25
Number of interacting partners
(c)
0
40 60
80 100 120
Number of interacting partners
(d)
Figure 4: The interaction matrix is very sparse. Most proteins interact with one or a few proteins. (a) The interaction matrix of a combined
yeast interaction data set obtained by [10, 11, 14]. (b) A submatrix of the interaction matrix in (a). (c), (d) Histograms for the number of
interacting partners of a protein.
objective as to maximize the number of relationships (as expressed in (2)) that are satisfied based on the domain-protein
interaction indicators assigned. This objective coincides with
those of maximum satisfiability (MAX-SAT) problems.
Definition 2. Given a set of p clauses in conjunctive normal form over q variables, the maximum satisfiability (MAXSAT) problem is to obtain a truth assignment for the q variables so that a maximum number of the clauses are satisfied.
SAT and MAX-SAT problems are difficult to solve because of their large search space, and they have been known
to be NP-hard [23]. Although a number of techniques
have been developed to solve SAT and MAX-SAT problems
[24, 25], finding optimal solutions for SAT and MAX-SAT
problems is still an active research topic in artificial intelligence, logic, theory of computation, and many other related
areas. How to optimize the solutions of SAT and MAX-SAT
problems, however, is out of the scope of this paper. Therefore, in this study, linear programing [26], a widely used
techniques for MAX-SAT problems, is used to solve the inference problem. We employed linear programing for the solution of the MAX-SAT problem for several appealing reasons.
First, the running time of linear programing is usually polynomial, while a pure combinatorial algorithm to solve the
same problem usually requires exponential time complexity.
Considering the unique variable in the MAX-SAT problem
is usually quite large, the polynomial solution of linear programing is preferred. Later in this section, we will show two
additional advantages of linear programing solution: ability
to model the strength of the interaction and to easily incorporate prior knowledge.
For the interaction inference problem, we associate an indicator variable Pi j ∈ {0, 1} with each protein pair pi , p j to
Ya Zhang et al.
5
isfied. This objective is equivalent to minimizing the function i j |Pi j − Pi j |, which is the total number of protein pairs
whose protein-domain interaction relationships are unsatisfied based on the domain interaction assignment. To solve
this minimization problem, the following linear program is
formulated:
7000
Number of domains
6000
5000
4000
ij
(∀i, j),
dnm ∈Ωi j
Pi j ∈ {0, 1}
1
2
3
4
5
6
7
8
9
Number of occurences in proteins
(∀n, m).
10
The inequality constraints in (5) are from the constraints in
(4) and they ensure that a protein pair is deemed to be interacting only if at least one of the domain pairs in the protein
pair is considered interacting, as Pi j is either 1 or 0. Equation
(6) may be reformulated as
(a)
30
25
Pi j −
minimize
Pi j =0
20
Pi j
Pi j =1
Dnm ≥ Pi j
subject to
(∀i, j),
dnm ∈Ωi j
15
Pi j ∈ {0, 1}
25
35 45 55 65 75 85
100
Number of occurences in proteins
(∀n, m).
The linear programing problem is NP-hard when the
variables are restricted to integers. A suitable approximation
is to use probabilistic methods. We solve the relaxed linear
program by loosing the integer constraints on the matrixes
D and P in (6). Dnm and Pi j are allowed to assume any real
value in the interval of [0, 1]:
5
15
115
(b)
Figure 5: Histogram for the number of proteins in which each domain occurs. If a domain occurs in a protein multiple times, only
one is counted.
Pi j −
minimize
Pi j =0
Pi j
Pi j =1
Dnm ≥ Pi j
subject to
(∀i, j),
dnm ∈Ωi j
indicate whether or not the proteins are predicted to interact, based on the assignment of domain interaction indicator
matrix D. The goal is to maximize the number of satisfied
protein-domain interaction relationships, that is,
max f =
1 − Pi j − Pi j
ij
subject to Pi j = ∨dnm ∈Ωi j Dnm
(6)
(∀i, j),
Dnm ∈ {0, 1}
10
0
(5)
(∀i, j),
Dnm ∈ {0, 1}
1000
0
Dnm ≥ Pi j
subject to
2000
Number of domains
Pi j − Pi j
minimize
3000
(4)
(∀i, j),
where Dnm ∈ {0, 1} and Pi j ∈ {0, 1} ( for all m, n, and i, j).
Pi j is the interaction indicator for proteins pi and p j according to experimental interaction data. Here, if the interaction
between proteins pi and p j is predicted to be identical to that
provided in the data, then we have Pi j − Pi j = 0; otherwise,
|Pi j − Pi j | = 1. Thus, the above objective function counts
the number of protein-domain interaction relationships sat-
(7)
0 ≤ Pi j ≤ 1 (∀i, j),
0 ≤ Dnm ≤ 1
(∀n, m).
Let Dnm be the value obtained for variable Dnm and Pi j for
Pi j after solving the linear program. These real number values
obtained for Dnm and Pi j represent the probability of picking
the integer value 1 for them. The real-number solutions have
advantages over Boolean solutions for their ability to capture
the probabilities of protein interactions and domain interactions. To convert the interactions into Boolean format, we
only need to select a threshold and quantize the values to 0 or
1 based on the threshold. Another advantage of using linear
programing to solve the MAX-SAT problem is that the formulation as an optimization problem subject to constraints
naturally facilitates the integration of prior knowledge about
interaction as additional constraints.
6
EURASIP Journal on Applied Signal Processing
4.
EXPERIMENTAL RESULTS
To infer the interacting proteins, we use the yeast interaction
data set as prepared in [15], which is a combination of interactions obtained from large-scale yeast two-hybrid screens
on Saccharomyces cerevisiae genome [11, 14]. The data set includes 5719 interactions. The domain definitions of the yeast
proteins are according to Pfam [27]. In total, 2918 Pfam domains are defined on the set of proteins. Proteins without
defined domains are treated as superdomains.
For validation, the MIPS (Munich Information Center
for Protein Sequences) physical interaction pairs [28] are
used to evaluate the predictions. The MIPS data set contains 2575 pairs of interacting proteins but does not include
any pair of noninteracting proteins. We randomly generate a
set of noninteracting protein pairs of size comparable to the
number of the interacting protein pairs. Protein pairs which
do not contain any domain pair in the training set are deleted
because no information about their interaction may be obtained from the training set. This deletion results in a test set
of 2099 interactions.
The GNU Linear Programing Kit1 (version 4.7) is used
for solving linear programs on Unix. In particular, a polynomial time linear programing algorithm using an interior
point method is used to solve the linear programs. Interior
point method is known to be more efficient than the simplex
method. This former method achieves optimization by going through the middle of the solid defined by the problem
rather than around its surface. The prediction algorithm is
mainly implemented in Perl, and the experiments are performed on a SUN Ultra 60 server (450 MHz) with 1 GB
RAM.
The performance of the algorithm is evaluated in terms
of sensitivity (Sen) and specificity (Spe). Sensitivity is the ratio of the correctly predicted interacting protein pairs (t p) to
the total number of interacting protein pairs (t p + f n), while
specificity is the ratio of the correctly predicted interacting
protein pairs (t p) to the number of protein pairs predicted
to be interacting (t p + f p):
tp
,
tp + f n
tp
.
Spe =
tp + f p
Sen =
(8)
4.1. Training
The yeast interaction data set only contains pairs of interacting proteins, which are so-called positive training examples.
We are lack of negative training examples because the yeast
data set provides no information about the noninteracting
proteins. A common approach to obtain negative examples is
to use the set of all pairs of proteins excluding the interacting
proteins as negative training examples. However, several major issues are raised regarding this solution. First, considering
1
(accessed on April 8th, 2005)
high false negatives (≥ 0.64, according to [15]) of the yeast
interaction data set, many interacting protein pairs remain
undiscovered. Using all pairs of proteins excluding the interacting proteins as negative training examples will guarantee
to include all those false negatives. Secondly, the number of
all pairs of proteins is n(n + 1)/2, where n is the number of
proteins in the data set. In the case of the yeast data set, we
have 6359 yeast proteins and 5719 interactions. The number
of all pairs of proteins is in the order of 2 × 10⁷ , four magnitude larger than that of the positive examples. Therefore,
the training examples would be very imbalanced if all pairs
of proteins are used for training. Moreover, using all pairs
of proteins for training demands considerable computational
costs.
Considering the above limitations, we generate a subset
of noninteracting protein pairs by randomly coupling the
proteins which are not observed to interact in the experiments. Now what we need decide is the number of “negative”
examples selected. We express the training data in a parametric form as
Train(t) = |Positive| + |AllPair − Positive| × t,
(9)
where t is a real number (0 < t < 1), | · | represents the size
of the set, and Train(t) is the size of the training data with
parameter t. In the actual experiments, we use the parameter
NegRatio =
|Negative|
|Positive|
(10)
to indicate the number of “negative” examples selected. As
|Positive| is fixed, this ratio is clearly in proportion to the pa-
rameter t. We perform experiments with different values of
NegRatio and report the results in Figure 6. We start with
a training setting of positive examples only, and gradually
include more and more negative examples. Intuitively, including a proper number of negative examples increases the
specificity of the prediction with minimal loss of sensitivity.
Seen from the plots, initially, adding more negative examples
for training results in an increased specificity and a reduced
sensitivity. However, for NegRatio > 10, the specificities tend
to be stable and only slightly fluctuate by random. In the
mean while, the sensitivity still keeps decreasing. This phenomenon may be related to the fact that the number of interacting protein pairs treated as negative examples increases
with the growing number of negative examples. A reasonable
value for NegRatio is 10.
4.2.
Results
As the EM method is considered the best among existing
methods [21], we here compare the performance of our
method with that of the EM method. Our method is referred to as the SAT method thereafter. Setting NegRatio =
{0, 1, . . . , 20}, we test the SAT method and the EM method
on the same sets of interaction data and report their results
in Table 1. For all predictions, the threshold is set to 0.6.
The experimental results show that the EM method generally
predicts at relative high sensitivities while the SAT method
Ya Zhang et al.
7
0.9
0.96
Specificity
Sensitivity
1
0.92
0.88
0.84
0.85
0.8
0.75
0.7
0
2
4
6
8
10
12
14
No. of neg/no. of pos
Threshold = 0.95
Threshold = 0.8
Threshold = 0.6
16
18
20
Threshold = 0.4
Threshold = 0.2
0
2
4
6
8
10
12 14
No. of neg/no. of pos
Threshold = 0.95
Threshold = 0.8
Threshold = 0.6
(a)
16
18
20
Threshold = 0.4
Threshold = 0.2
(b)
Figure 6: The impact of negative training examples on specificity and sensitivity. The x axis indicates the ratio of the number of randomly
selected negative examples to the number of positive examples. The y axis is the sensitivity (a) and specificity (b). The circles, squares,
diamonds, triangles, and pentagrams represent the sensitivity/specificity at different interaction thresholds (0.95, 0.8, 0.6, 0.4, and 0.2, resp.).
Table 1: Performance comparison of the SAT method and the EM
method at different NegRatio. The threshold for the predictions is
set at 0.6. The metrics reported here are sensitivity, specificity, and
F-score.
NegRatio
0
1
2
3
4
5
6
7
8
9
10
11
12
13
14
15
16
17
18
19
20
Sen
0.96
0.939
0.914
0.911
0.911
0.896
0.884
0.882
0.882
0.871
0.87
0.857
0.854
0.846
0.852
0.847
0.844
0.831
0.84
0.84
0.827
SAT
Spe
F-Score
0.755
0.803
0.820
0.843
0.843
0.842
0.853
0.864
0.878
0.871
0.889
0.889
0.889
0.895
0.885
0.901
0.900
0.900
0.902
0.912
0.914
0.845
0.865
0.865
0.876
0.876
0.869
0.869
0.873
0.880
0.871
0.879
0.873
0.871
0.868
0.868
0.873
0.871
0.864
0.870
0.874
0.868
lower sensitivity. To compare the two methods, in addition to
sensitivity and specificity, we introduce F-score which combines the two former metrics to score the prediction,
F-score =
Sen
EM
Spe
F-Score
0.965
0.967
0.967
0.968
0.974
0.958
0.967
0.970
0.973
0.967
0.970
0.962
0.960
0.967
0.959
0.968
0.967
0.967
0.964
0.971
0.959
0.733
0.731
0.729
0.743
0.745
0.738
0.740
0.735
0.743
0.745
0.736
0.741
0.751
0.738
0.751
0.748
0.743
0.742
0.743
0.743
0.744
0.833
0.833
0.831
0.840
0.844
0.834
0.838
0.836
0.843
0.842
0.837
0.837
0.843
0.837
0.842
0.844
0.840
0.840
0.839
0.842
0.838
predicts at relative high specificity. Moreover, the sensitivity
and specificity of the EM method seem to be uncorrelated
to the number of negative examples included in the training
set (see Table 1 and Figure 7). On the other hand, the number of negative examples included has a clear impact on the
performance of SAT approach. Including more negative examples increases the specificity of SAT method at the cost of a
2 Spe × Sen
.
(Spe + Sen)
(11)
We calculate F-score for each training run and the results
are also listed in Table 1. The F-scores of the SAT methods
are higher than those of the EM method (P-value less than
0.0001).
For the purpose of interaction prediction, we are more
interested in discovering interacting proteins rather than
noninteracting proteins. That is, errors in predicted interacting proteins ( f p) are less tolerable than those in predicted
noninteracting proteins ( f n). Thus, specificity is a more important metric than sensitivity. The predictions by the SAT
method generally have higher specificities than those by the
EM method as seen from Figure 7 (different NegRatio while
threshold is set to 0.6) and Figure 8 (different threshold values while NegRatio is set to 10). In this sense, we are more in
favor of the SAT method.
We employ a polynomial time linear programing algorithm using an interior point method (provided by the GNU
Linear Programing Kit) to solve the linear programs. Table 2
and Figure 9 show the running time of the GNU LP program
with different number of variables.
To compare the predictions made by the SAT method and
the EM method, we plot the predicted protein-protein interaction matrixes of the two methods as shown in Figure 10(a)
(NegRatio = 10 and threshold = 0.6). In these plots, each
row and each column represent a protein. A circle means that
the proteins at the corresponding row and column interact
according to SAT prediction. Similarly, a triangle indicates
that the proteins at the corresponding row and column interact according to EM prediction. The protein interactions
in the testing set are indicated by dots. The two methods produce about 75.5% overlaps in their predictions about protein
interaction (either interacting or noninteracting). When this
overlapped portion is compared with the testing interactions
8
EURASIP Journal on Applied Signal Processing
0.95
0.96
Specificity
Sensitivity
1
0.92
0.88
0.84
0.9
0.85
0.8
0.75
0.7
0
2
4
6
8
10
12
14
No. of neg/no. of pos
16
18
20
0
2
4
6
8
10
12 14
No. of neg/no. of pos
16
18
20
EM
SAT
EM
SAT
(a)
(b)
Figure 7: Comparison of how specificity and sensitivity change with different NegRatio for the SAT method and the EM algorithm. The
threshold for the predictions is set at 0.6. The lines with circles represent the performance of the SAT method, while the lines with squares
represent that of the EM method.
×105
1
4.5
0.95
4
3.5
0.9
Time (s)
Specificity
3
0.85
0.8
2.5
2
1.5
0.75
1
0.7
0.5
0.65
0.85
0.9
0.95
1
Sensitivity
SAT
EM
0
0
50
100
150
200
250
Number of variables
Figure 9: Running time of GNU LP program with different number
of variables.
Figure 8: Comparison of specificity and sensitivity of our algorithm
to those of the EM algorithm (NegRatio = 10).
(Figure 10), it results in a slightly higher specificity of 0.899
at a sensitivity of 0.867.
4.3. Structural evidences for the predicted domain
interactions
Biological validation of the predictions is by no means a trivial task. The lack of a golden test set for domain interactions
is the major reason that a statistically significant test is infeasible. Here we use some examples to illustrate some of the
predictions.
Recently, iPfam2 has been built as a resource containing
domain-domain interactions observed in protein data bank
(PDB) entries. For each entry in PDB, Pfam domains are first
2
/>
projected onto the structure. Then, the distances between
each pair of domains are computed to decide whether interactions are formed between these domains. The domain
interactions logged in iPfam include inter-protein or intraprotein ones, while our predictions only cover those between
proteins. Therefore, it is expected that our prediction only
matches to a portion of iPfam interactions. The predicted
domain-domain interactions are compared with those contained in iPfam. Table 3 list some of those domain-domain
interactions.
As there is very limited information on domain interactions available, here we attempt to draw evidences from
structures of interacting proteins or protein complexes to
validate our predictions about interacting domains. First let
us look at the complex structure of the protein cyclin a and
the protein cyclin-dependent kinase 2 (PDB ID 1 f in). According to Pfam, cyclin a contains two copies of PF00069
Ya Zhang et al.
9
Table 2: The running time of GNU LP with different number of variables.
NegRatio
0
1
2
3
4
5
6
7
8
9
10
nnegative
npositive
nvariables
TLP (seconds)
0
5719
22738
1.0
5719
5719
43417
2.0
11438
5719
64030
5.0
17157
5719
83801
7.0
22876
5719
104718
11.0
28595
5719
124775
15.0
34314
5719
143744
21.0
40033
5719
164518
30.0
45752
5719
183948
35.0
51471
5719
204905
48.0
57190
5719
223661
55.0
NegRatio
11
12
13
14
15
16
17
18
19
20
nnegative
npositive
nvariables
TLP (seconds)
62909
5719
243500
70.0
68628
5719
261383
79.0
74347
5719
282568
95.0
80066
5719
301274
107.0
85785
5719
319929
130.0
91504
5719
339958
148.0
97223
5719
358401
164.0
102942
5719
375141
181.0
108661
5719
396173
209.0
114380
5719
412924
238.0
0
0
500
500
1000
1000
1500
1500
2000
2000
2500
2500
3000
3000
3500
3500
0
500 1000 1500 2000 2500 3000 3500
0
500 1000 1500 2000 2500 3000 3500
nz = 1846
nz = 1400
(a)
(b)
0
500
1000
1500
2000
2500
3000
3500
0
500 1000 1500 2000 2500 3000 3500
nz = 1400
(c)
Figure 10: The degree of overlap among testing protein interactions, predicted interactions by SAT approach and EM approach. The
NegRatio and threshold of the prediction are set to 10 and 0.6, respectively. (a) Overlap of predicted protein interactions by SAT methods (circles) and those by EM methods (triangles). (b) Overlap of predicted protein interactions by SAT methods (circles) and the testing set
(dots). (c) Overlap of predicted protein interactions by EM methods (triangles) and the testing set (dots).
10
EURASIP Journal on Applied Signal Processing
Table 3: Examples of predicted domain-domain interactions that matches the predictions by iPfam.
Domain 1
PF02984
PF00023
PF00786
PF02115
PF02629
PF01842
PF00227
PF00491
PF00631
PF00503
PF00389
PF00291
PF01466
PF00069 (Pkinase)
Domain 2
PF00069
PF00069
PF00069
PF00071
PF00389
PF00389
PF00227
PF00491
PF00400
PF00400
PF00137
PF00585
PF00646
Domain 1
PF00134
PF00378
PF00043
PF02826
PF00581
PF00995
PF00227
PF00675
PF00091
PF01111
PF00389
PF00389
PF01466
Domain 2
PF00069
PF00378
PF02798
PF00389
PF00581
PF00804
PF00389
PF00675
PF00389
PF00069
PF00004
PF00400
PF00888
PF00069 (Pkinase)
PF00134 (C yclin N)
PF02984 (Pkinase)
PF00134 (C yclin N)
PF02984 (C yclin C)
PF00134 (C yclin N)
PF02984 (Pkinase)
PF00069 (Pkinase)
(a)
(b)
(c)
Figure 11: The 3-D structure of cyclin a—cyclin-dependent kinase 2 complex (PDB ID 1 f in). The structure shows how cyclin-dependent
kinase 2 binds to cyclin a. The Pfam domains are graphed on the structure and labelled in color. Two PF00069 (Pkinase) domains are marked
in red and purple, respectively. Two PF00134 (C yclin N) domains are colored in blue and yellow, respectively. The protein segments in cyan
and orange are PF02984 (C yclin C) domains. (a), (b) The complex structure is captured from different angles to show how the domains
contact with each other. (c) Part of the structure is shown to indicate how the three domains contact with each other.
(Pkinase) domains, while cyclin-dependent kinase 2 contains
two copies of PF00134 (C yclin N) domains and two copies
of PF02984 (C yclin C) domains. We graph these domains
on the PDB structure (see Figure 11). The complex structure is captured from different angles to show how the domains contact with each other. As shown in the structure, the
PF02984 (C yclin C) domain and the PF00134 (C yclin N)
domain both interact with the PF00069 (Pkinase) domain.
Moreover, according to our prediction, DPF02984,PF00069 =
0.58, and DPF00134,PF00069 = 1. From Figure 11(c), we can see
that the area of contact between PF00134 and FP00069 is
actually larger than that between PF02984 and PF00069. It
seems that our algorithm is able to successfully predict not
only the domain interactions but also the relative strength of
the domain interactions.
Another evidence supporting our prediction that the
PF00023 (Ank) domain interacts with the PF00069 (Pkinase)
domain is obtained from the three-dimensional (3-D) structure of the P18(Ink4C)-Cdk6-K-Cyclin ternary complex (PDB
ID 1g3n) (see Figure 12). As indicated by its name, the
complex contains three proteins: cyclin-dependent kinase
6 (cdk6), cyclin-dependent kinase 6 inhibitor (P18(Ink4C)),
and V-Cyclin (K-Cyclin) (grey). According to Pfam, cyclindependent kinase 6 contains Pkinase domains, while cyclindependent kinase 6 inhibitor contains Ank domains. Two additional examples are shown in Figure 13, where the complexes structure of rac-rhogdi shows the interactions between
the Pfam domains, PF02115 (Rho GDI) and PF00071 (Ras)
(Figure 13(a)), and the interaction between the Pfam domains, PF00043 (GST C) and PF02798 (GST N), is illustrated through the structure of the human glutathione stransferase p1-1 in complex with ethacrynic acid-glutathione
conjugate (Figure 13(b)).
4.4.
Biological significance of the predictions
Table 4 lists the novel interacting protein pairs discovered
with our methods. The prediction about the interaction between ADR1 and ZAP1 is very significant because ADR1
and ZAP1 are zinc-responsive transcription factors. It is very
likely that the two proteins bind together in response to
the presence of zinc and other related stimulates. Another
Ya Zhang et al.
11
PF02115 (Rho GDI)
PF00069 (Pkinase)
PF00023 (Ank)
PF00023 (Ank)
PF00071 (Ras)
(a)
(b)
(a)
PF00043 (GST C)
PF02798 (GST N)
(c)
(d)
PF02798 (GST N)
Figure 12: The 3-D structure of a P18(Ink4C)-Cdk6-K-Cyclin ternary complex (PDB ID 1g3n). The complex contains three proteins: cyclin-dependent kinase 6 (cdk6), cyclin-dependent kinase 6 inhibitor (P18(Ink4C)), and V-Cyclin (K-Cyclin). The Pfam domains
are graphed on the structure and labelled in color. Two PF00069
(Pkinase) domains are marked in red and pink, respectively. Ten
copies of PF00023 (Ank) domains are marked with other colors except grey. The complex structure is captured from different angles
to show how the domains contact with each other.
significant prediction we made is the interaction between
protein PAP1, an amino acid permease, and protein SEC17,
which is a peripheral membrane protein required for vesicular transport. The rationale after their interaction is that
when the amino acid permease PAP1 uptakes amino acids,
it may need to bind to SEC17 to transport the amino acids to
other cellular compartment.
Our prediction of protein-protein interactions is associated with very low cost and it helps biologists to select important protein pairs out of numerous candidates without
experimentation. Based on the prediction, biologists can assign priorities to the proteins or domains to be experimented
on. Moreover, the prediction may also be used to assign functions to unknown proteins. For example, the uncharacterized
protein, YMR291W, was predicted to interact with HSP104.
Since interacting proteins are usually involved in the same
cellular processes, we may predict that YMR291W is involved
in the response to stresses.
5.
DISCUSSIONS AND CONCLUSIONS
Inferring protein interaction is a very challenging problem
due to the high level of noise in the interaction data and
limited information about the protein interactions. Existing domain-based methods tend to oversimplify the problem by introducing the assumption that the domain interactions are independent from each other. In our study, the
protein-protein interactions are interpreted as the result of
PF00043 (GST C)
(b)
Figure 13: (a) The 3-D structure of a rac-rhogdi complex. The
complex contains ras-Related C3 Botulinum Toxin Substrate 2
(P21-Rac2) and rho GDP-Dissociation Inhibitor 2 (rho Gdi 2, rhoGdi beta, Ly-Gdi). The Pfam domains are graphed on the structure and labelled in color. The PF00071 (Ras) domain is marked in
red. The PF02115 (Rho GDI) domain is colored in blue. (b) The
3-D structure of the human glutathione s-transferase p1-1 in complex with ethacrynic acid-glutathione conjugate. Two copies of the
PF02798 (GST N) domains are marked in red and blue, respectively. Two copies of the PF00043 (GST C) domains are colored in
purple and green, respectively.
domain interactions which are not necessarily independent
of each other. The relationships between protein interactions
and domain interactions are expressed in conjunctive norm
forms, which enables us to formulate the problem of interaction inference as a satisfiability (SAT) problem. The inference problem is then relaxed and solved with linear programing. The prediction framework is characterized in the following two aspects. First, the proposed framework makes no
assumption on the dependency of domain interactions and
is a more natural way of modeling the relationship between
protein-protein interactions and domain-domain interactions. Secondly, when formulating the inference problem as
a MAX-SAT problem, prior knowledge about domain interaction or protein interaction may be easily input into the
framework as additional constraints. The validity of the prediction method is evaluated with yeast protein interactions.
Our method achieves a sensitivity of 87.0% and a specificity
of 88.9% at the threshold 0.6 (NegRatio = 10) on a combined
yeast data set. Compared with the MLE-EM method, our
method is able to predict at a higher specificity while maintaining a reasonable sensitivity. Attempts were made to validate our prediction on domain interactions by inspecting the
12
EURASIP Journal on Applied Signal Processing
Table 4: Examples of the discovered novel interacting protein pairs.
Interactor I
Function
Interactor II
Function
ZAP1
Zinc-regulated transcription factor, binds to
zinc-responsive promoter elements to induce
transcription of certain genes in the presence of zinc
PAP1
Amino acid permease involved in the uptake of
cysteine, leucine, isoleucine, and valine
SEC17
Peripheral membrane protein required for vesicular
transport between ER and Golgi and for the “priming”
step in homotypic vacuole fusion, part of the cis-SNARE
complex
LSM1
Component of small nuclear
ribonucleoprotein complexes involved in
mRNA decapping and decay
MUD1
U1 snRNP A protein, homolog of human U1-A; involved
in nuclear mRNA splicing
CLN1
role in cell cycle START
PKH1
Pkb-activating kinase homologue; Ser/Thr protein kinase
SMK1
Mitogen-activated protein kinase required for
spore morphogenesis that is expressed as a
middle sporulation-specific gene
SWE1
Protein kinase that regulates the G2/M transition by
inhibition of Cdc28p kinase activity
DUN1
Cell-cycle checkpoint serine-threonine
kinase required for DNA damage-induced
transcription of certain target genes,
phosphorylation of Rad55p and Sml1p, and
transient G2/M arrest after DNA damage;
also regulates postreplicative DNA repair
TIF35
Subunit of the core complex of translation
initiation factor 3(eIF3), which is essential for
translation
BOI1
Protein implicated in polar growth; interacts
with bud-emergence protein Bem1p
TIF35
Subunit of the core complex of translation initiation
factor 3(eIF3), which is essential for translation
TIF34
Subunit of the core complex of translation
initiation factor 3(eIF3), which is essential
for translation
WTM2
WD repeat containing transcriptional modulator 2;
transcriptional modulator
GPA1
GTP-binding alpha subunit of the
heterotrimeric G protein that couples to
pheromone receptors; negatively regulates
the mating pathway by sequestering
G(beta)gamma and by triggering an
adaptive response; activates the pathway via
Scp160p
PAC1
Protein involved in nuclear migration, part of the
dynein/dynactin pathway; targets dynein to
microtubule tips, which is necessary for sliding of
microtubules along bud cortex
PRP3
Splicing factor, component of the U4/U6-U5
snRNP complex
TPK3
Involved in nutrient control of cell growth and division;
cAMP-dependent protein kinase catalytic subunit
ARO8
Aromatic aminotransferase, expression is
regulated by general control of amino acid
biosynthesis
SRP1
Cell wall mannoprotein of the Srp1p/Tip1p family of
serine-alanine-rich proteins
AHP1
Thiol-specific peroxiredoxin, reduces
hydroperoxides to protect against oxidative
damage; function in vivo requires covalent
conjugation to Urm1p
SRP1
Cell wall mannoprotein of the Srp1p/Tip1p family of
serine-alanine-rich proteins; expression is downregulated
at acidic pH and induced by cold shock and anaerobiosis;
abundance is increased in cells cultured without shaking
CUS2
Protein that binds to U2 snRNA and Prp11p,
may be involved in U2 snRNA folding
SAP190
Protein that forms a complex with the Sit4p protein
phosphatase and is required for its function
HSP104
Heat shock protein that is responsive to
stresses including heat, ethanol, and sodium
arsenite
YMR291W
ORF, uncharacterized
ADR1
Zinc-finger transcription factor involved in
regulation of ADH2 and peroxisomal genes
positions of the domains in some protein complexes based on
their structure information deposited in PDB. Our method
correctly predicted the interactions among domains. Further
more, the scores assigned to each pair of domains also correspond to the strength of the interaction.
Although our method achieved relatively high sensitivity and specificity. The sensitivity is still low. The reason
for the relatively low sensitivity is that the protein-protein
interactions provided for the training (the combined data
set) only represent a very small fraction of the potential
Ya Zhang et al.
protein-protein interactions due to high false-negative associated with high-throughput methods. As proper training instances are necessary for prediction methods to perform well,
it is quite reasonable for our method to achieve a sensitivity
around 87%. With the accumulation of high-throughput interaction data, we may be able to include more instance in the
training data and improve the sensitivity of the prediction.
One limitation shared by all domain-based interaction
inference methods is that domain composition is considered
as the solely determining factor for interactions. However,
the presence of a pair of interacting domain in a pair of
proteins is only a necessary but not sufficient for two proteins to interact. Whether two proteins interact or not may
also depends on their expression level, their subcellular location, and many other factors. Proteins are observed to interact with different partners in fulfilling different cellular functions. For example, the 14-3-3 domain interacts with Cdc25
tyrosine phosphatase during cell cycle regulation, while it
interacts c-Raf Ser/Thr kinase when it functions for signal
transduction. Hence, protein interactions cannot be studied
in an isolated fashion. A system biology approach, which focuses on the interplay between all components of the cell,
may be central to the understanding of protein interactions.
The domain-based approaches to infer protein-protein
interactions usually do not differentiate interaction domains and catalytic domains. However, the interaction domains are more likely to mediate protein interaction. Interaction domains are believed to be more likely to mediate specific protein-protein interactions. Unique characteristics have been revealed about interaction domains in terms
of their lengths, structures, and frequency in genomes [29].
Moreover, proteins containing the same interaction domains
are often observed to have very diverse functions. For example, SH2 domain containing proteins perform functions that
include regulation of protein/lipid phosphorylation, phospholipid metabolism, transcriptional regulation, cytoskeletal organization, and control of Ras-like GTPases. However,
our current understanding of interaction domains is still limited to a few well-studied ones such as SH2 domains. An
automatic method may be developed to identify interaction
domains in proteins. This result may then be used to help
the further identification of interacting domains and proteins and improve the accuracy of protein interaction prediction.
ACKNOWLEDGMENTS
The authors are thankful to Dr. Stephen R. Holbrook, Dr.
Chris Ding, and Dr. Xue-Wen Chen for their insightful discussions and comments on the manuscript. The authors
would also like to thank the anonymous reviewers and editors for their helpful comments.
REFERENCES
[1] A. J. Enright, I. Iliopoulos, N. C. Kyrpides, and C. A. Ouzounis, “Protein interaction maps for complete genomes based
on gene fusion events,” Nature, vol. 402, no. 6757, pp. 86–90,
1999.
13
[2] E. M. Marcotte, M. Pellegrini, H.-L. Ng, D. W. Rice, T. O.
Yeates, and D. Eisenberg, “Detecting protein function and
protein-protein interactions from genome sequences,” Science,
vol. 285, no. 5428, pp. 751–753, 1999.
[3] J. R. Bock and D. A. Gough, “Predicting protein-protein interactions from primary structure,” Bioinformatics, vol. 17, no. 5,
pp. 455–460, 2001.
[4] J. Park, M. Lappe, and S. A. Teichmann, “Mapping protein
family interactions: intramolecular and intermolecular protein family interaction repertories in the pdb and yeast,” Journal of Molecular Biology, vol. 307, pp. 929–938, 2001.
[5] M. Pellegrini, E. M. Marcotte, M. J. Thompson, D. Eisenberg,
and T. O. Yeates, “Assigning protein fucntions by comparative
genome analysis: protein phylogenetic profiles,” Proceedings of
the National Academy of Sciences of the United States of America, vol. 96, no. 8, pp. 4285–4288, 1999.
[6] N. Goffard, V. Garcia, F. Iragne, A. Groppi, and A. de Daruvar,
“Ippred: server for proteins interactions inference,” Bioinformatics, vol. 19, pp. 903–904, 2003.
[7] T. Dandekar, B. Snel, M. Huynen, and P. Bork, “Conservation
of gene order: a fingerprint of proteins that physically interact,” Trends in Biochemical Sciences, vol. 23, pp. 324–328, 1998.
[8] M. B. Eisen, P. T. Spellman, P. O. Brown, and D. Botstein,
“Cluster analysis and display of genome-wide expression patterns,” Proceedings of the National Academy of Sciences of the
United States of America, vol. 95, pp. 14863–14868, 1998.
[9] S. F. Altschul, W. Gish, W. Miller, E. W. Myers, and D. J. Lipman, “Basic local alignment search tool,” Journal of Molecular
Biology, vol. 215, pp. 403–410, 1990.
[10] T. Ito, T. Chiba, R. Ozawa, M. Yoshida, M. Hattori, and
Y. Sakaki, “A comprehensive two hybrid analysis to explore
the yeast protein interactome,” Proceedings of the National
Academy of Sciences of the United States of America, vol. 98,
no. 8, pp. 4569–4574, 2001.
[11] P. Uetz, L. Giot, G. Cagney, et al., “A comprehensive analysis of protein-protein interactions in saccharomyces cerevisiae,”
Nature, vol. 403, no. 6770, pp. 623–627, 2000.
[12] Y. Ho, A. Gruhler, A. Heilbut, et al., “Systematic identification of protein complexes in saccharomyces cerevisiae by mass
spectrometry,” Nature, vol. 415, pp. 180–183, 2002.
[13] R. Mrowka, A. Patzak, and H. Herze, “Is there a bias in proteome research?” Genome Research, vol. 11, no. 12, pp. 1971–
1973, 2001.
[14] T. Ito, K. Tashiro, S. Muta, et al., “Toward a protein-protein
interaction map of the budding yeast: a comprehensive system
to examine two-hybrid interactions in all possible combinations between the yeast proteins,” Proceedings of the National
Academy of Sciences of the United States of America, vol. 97,
no. 3, pp. 1143–1147, 2000.
[15] M. Deng, S. Mehta, F. Sun, and T. Chen, “Inferring domaindomain interactions from protein-protein interactions,” in
Proceedings of the 6th Annual International Conference on Computational Biology (RECOMB ’02), pp. 117–126, Washington,
DC, USA, April 2002.
[16] M. Hayashida, N. Ueda, and T. Akutsu, “A simple method for
interring strengths of protein-protein interactions,” Genome
Informatics, vol. 15, no. 1, pp. 56–68, 2004.
[17] W. K. Kim, J. Park, and J. K. Suh, “Large scale statistical prediction of protein-protein interaction by potentially interacting domain (pid) pair,” Genome Informatics, vol. 13, pp. 42–50,
2002.
14
[18] S. K. Ng, Z. Zhang, and S. H. Tan, “Integrative approach
for computationally inferring protein domain interactions,”
Bioinformatics, vol. 19, no. 8, pp. 923–929, 2003.
[19] E. Sprinzak and H. Margalit, “Correlated sequence-signatures
as markers of protein-protein interaction,” Journal of Molecular Biology, vol. 311, no. 4, pp. 681–692, 2001.
[20] J. Wojcik and V. Schă chter, Protein-protein interaction map
a
inference using interacting domain prole pairs, Bioinformatics, vol. 17, suppl. 1, pp. S296–S305, 2001.
[21] M. Hayashida, N. Ueda, and T. Akutsu, “Interring strengths of
protein-protein interactions from experimental data using linear programming,” Bioinformatics, vol. 19, suppl. 2, pp. ii58–
ii65, 2003.
[22] T. R. Hazbun and S. Fields, “Networking proteins in yeast,”
Proceedings of the National Academy of Sciences of the United
States of America, vol. 98, no. 8, pp. 4277–4278, 2001.
[23] D. Du, J. Gu, and P. Pardalos, Satisfiability Problem: Theory and
Application, vol. 35 of DIMACS Series in Discrete Mathematics,
American Mathematical Society, Providence, RI, USA, 1997.
[24] J. Gramm, E. A. Hirsch, R. Niedermeier, and P. Rossmanith,
“New worst-case upper bounds for max-2-sat with application
to maxcut,” Discrete Applied Mathematics, vol. 130, no. 2, pp.
139–155, 2003.
[25] H. Zhang and H. Shen, “Exact algorithms for maxsat,” Electronic Notes in Theoretical Computer Science, vol. 86, no. 1, pp.
1–14, 2003.
[26] J. Hooker, “Resolution and the integrality of satisfiability
problems,” Mathematical Programming, vol. 74, pp. 1–10,
1996.
[27] A. Bateman, L. Coin, R. Durbin, et al., “The pfam protein families database,” Nucleic Acids Research, vol. 32, pp. D138–D141,
2004.
[28] H. W. Mewes, D. Frishman, C. Gruber, et al., “MIPS: a
database for genomes and protein sequences,” Nucleic Acids
Research, vol. 28, no. 1, pp. 37–40, 2000.
[29] T. Pawsona, M. Rainaa, and P. Nasha, “Interaction domains:
from simple binding events to complex cellular behavior,”
FEBS Letters, vol. 513, pp. 2–10, 2002.
Ya Zhang is an Assistant Professor in
the Department of Electrical Engineering
and Computer Science at the University
of Kansas. She received her B.S. degree
from Tsinghua University, China, in 2000,
and the Ph.D. degree in Information Sciences and Technology from the Pennsylvania State University in 2005. Her research
interests include bioinformatics, computational biology, machine learning, data mining, statistical learning, text mining, and system biology.
Hongyuan Zha received the B.S. degree
in mathematics from Fudan University,
Shanghai, in 1984, and the Ph.D. degree in
scientific computing from Stanford University in 1993. He is a Professor in the Department of Computer Science and Engineering
at Pennsylvania State University, where he
has worked since 1992. His research interests include scientific computing and
machine learning, especially statistical and
computational methods for nonlinear dimension reduction.
EURASIP Journal on Applied Signal Processing
Chao-Hsien Chu is an Associate Professor
of information sciences and technology and
the Executive Director of the Center for
Information Assurance at the Pennsylvania
State University, University Park, PA (USA).
He was previously on the faculty at Iowa
State University (USA) and Baruch College
(USA), and a Visiting Professor at the University of Tsukuba (Japan) and Hebei University of Technology (China). He is currently on leave to the Singapore Management University (Singapore) (2005–2006). He received a Ph.D. in business administration from Penn State University. His current research interests are
in communication networks design, information assurance and security (especially in wireless security, intrusion detection, and cyber forensics), and intelligent technologies (fuzzy logic, neural network, genetic algorithms, etc.) for data mining (e.g., bioinformatics and privacy preserving) and systems management. His research
papers have been published in Decision Sciences, the IEEE Transactions on Evolutionary Computation, IIE Transactions, Decision
Support Systems, European Journal of Operational Research, Electronic Commerce Research, Expert Systems with Applications, International Journal of Mobile Communications, Journal of Operations Management, International Journal of Production Research,
among others. He is currently on the editorial review board for a
number of journals.
Xiang Ji received his B.S. degree from the
University of Science and Technology of
China in 1999 and his Ph.D. degree in computer science from The Pennsylvania State
University in 2004. He has joined the NEC
Labs. America as a Research Staff Member
on intelligent information system research
since 2004. His research interests include
data mining, machine learning, and bioinformatics.