Báo cáo hóa học: "A Framework for Advanced Video Traces: Evaluating Visual Quality for Video Transmission Over Lossy Network" pptx
Bạn đang xem bản rút gọn của tài liệu. Xem và tải ngay bản đầy đủ của tài liệu tại đây (1.22 MB, 21 trang )
Hindawi Publishing Corporation
EURASIP Journal on Applied Signal Processing
Volume 2006, Article ID 42083, Pages 1–21
DOI 10.1155/ASP/2006/42083
A Framework for Advanced Video Traces: Evaluating Visual
Quality for Video Transmission Over Lossy Networks
Osama A. Lotfallah,
1
Martin Reisslein,
2
and Sethuraman Panchanathan
1
1
Department of Computer Science and Engineering, Arizona State University, Tempe, AZ 85287, USA
2
Department of Electrical Eng ineering, Arizona State University, Tempe, AZ 85287-5706, USA
Received 11 March 2005; Revised 1 August 2005; Accepted 4 October 2005
Conventional video traces (which characterize the video encoding frame sizes in bits and frame quality in PSNR) are limited
to evaluating loss-free video transmission. To evaluate robust video transmission schemes for lossy network transport, generally
experiments with actual video are required. To circumvent the need for experiments with actual videos, we propose in this paper
an advanced video trace framework. The two main components of this framework are (i) advanced video traces which combine
the conventional video traces with a parsimonious set of visual content descriptors, and (ii) quality prediction schemes that based
on the visual content descriptors provide an accurate prediction of the quality of the reconstructed video after lossy network
transport. We conduct extensive evaluations using a perceptual video quality metric as well as the PSNR in which we compare the
visual quality predicted based on the advanced video traces with the visual quality determined from experiments with actual video.
We find that the advanced video trace methodology accurately predicts the quality of the reconstructed video after frame losses.
Copyright © 2006 Osama A. Lotfallah et al. This is an open access article distributed under the Creative Commons Attribution
License, which permits unrestricted use, distribution, and reproduction in any medium, provided the original work is properly
cited.
1. INTRODUCTION
The increasing popularity of video streaming over wireless
networks and the Internet require the development and eval-
uation of video transport protocols that are robust to losses
during the network transport. In general, the video can be
representedinthreedifferent forms in these development
and evaluation efforts using (1) the actual video bit stream,
(2) a video trace, and (3) a mathematical model of the video.
The video bit stream allows for transmission experiments
from which the visual quality of the video that is recon-
structed at the decoder after lossy network transport can be
evaluated. On the downside, experiments with actual video
require access to and experience in using video codecs. In
addition, the copyright limits the exchange of long v ideo test
sequences, which are required to achieve statistically sound
evaluations, among networking researchers. Video models
attempt to capture the v ideo traffic character istics in a par-
simonious mathematical model and are still an ongoing re-
search area; see for instance [1, 2].
Conventional video traces characterize the video encod-
ing, that is, they contain the size (in bits) of each encoded
video frame and the corresponding visual quality (measured
in PSNR) as well as some auxiliary information, such as
frame type (I, P, or B) and timing information for the frame
play-out. These video traces are available from public video
trace libraries [3, 4] and are widely used among networking
researchers to test novel transport protocols for video, for ex-
ample, network resource management mechanisms [5, 6], as
they allow for simulating the operation of networking and
communications protocols without requiring actual videos.
Instead of transmitting the actual bits representing the en-
coded video, only the number of bits is fed into the simula-
tions.
One major limitation of the existing video traces (and
also the existing video traffic models) is that for evaluation
of lossy network transport they can only provide the bit
or frame loss probabilities, that is, the long run fraction of
video encoding bits or video frames that miss their decod-
ing deadline at the receiver. These loss probabilities provide
only very limited insight into the visual quality of the recon-
structed video at the decoder, mainly because the predictive
coding schemes, employed by the video coding standards,
propagate the impact of loss in a given frame to subsequent
frames. The propagation of loss to subsequent frames results
generally in nonlinear relationships between bit or frame
losses a nd the reconstructed qualities. As a consequence, ex-
periments to date with actual video are necessary to accu-
rately examine the video quality after lossy network trans-
port.
2 EURASIP Journal on Applied Signal Processing
The purpose of this paper is to develop an advanced
video trace framework that overcomes the outlined limita-
tion of the existing video traces and allows for accurate pre-
diction of the visual quality of the reconstructed video af-
ter lossy network transport without experiments with actual
video. The main underlying motivation for our work is that
visual content plays an important role in estimating the qual-
ity of the reconstructed video after suffering losses during
network transport. Roughly speaking, video sequences with
little or no motion activity between successive frames ex-
perience relatively minor quality degradation due to losses
since the losses can generally be effectively concealed. On the
other hand, video sequences with high motion activity be-
tween successive frames suffer relatively more severe quality
degradations since loss concealment is generally less effective
for these high-activity videos. In addition, the propagation
of losses to subsequent frames depends on the visual content
variations between the frames. To capture these effects, we
identify a parsimonious set of visual content descriptors that
can be added to the existing video traces to form advanced
video traces. We develop quality predictors that based on the
advanced video traces predict the quality of the reconstructed
video after lossy network transport.
The paper is organized as follows. In the following sub-
section, we review related work. Section 2 presents an out-
line of the proposed advanced video trace framework and
asummaryofaspecificadvancedvideotraceandqual-
ity prediction scheme for frame level quality prediction.
Section 3 discusses the mathematical foundations of the pro-
posed advanced video traces and quality predictors for de-
coders that conceal losses by copying. We conduct formal
analysis and simulation experiments to identify content de-
scriptors that correlate well with the quality of the recon-
structed video. Based on this analysis, we specify advanced
video traces and quality predictors for three levels of qual-
ity prediction, namely frame, group-of-pictures (GoP), and
shot. In Section 4, we provide the mathematical foundations
for decoders that conceal losses by freezing and specify video
traces and quality predictors for GoP and shot levels qual-
ity prediction. In Section 5, the performance of the quality
predictors is evaluated with a perceptual video quality met-
ric [7], while in Section 6, the two best performing quality
predictors are evaluated using the conventional PSNR met-
ric. Concluding remarks are presented in Section 6.
1.1. Related work
Existing quality prediction schemes are typically based on
the rate-loss-distortion model [8], where the reconstructed
quality is estimated after applying an error concealment tech-
nique. Lost macroblocks are concealed by copying from the
previous frame [9]. A statistical analysis of the channel dis-
tortion on intra- and inter-macroblocks is conducted and
the difference between the original frame and the concealed
frame is a pproximated as a linear relationship of the differ-
ence between the original frames. This r a te-loss-distortion
model does not account for commonly used B-frame mac-
roblocks. Additionally, the training of such a model can
be prohibitively expensive if this model is used for long
video traces. In [10], the reconstructed quality due to packet
(or frame) losses is predicted by analyzing the macroblock
modes of the received bitstream. The quality prediction can
be further improved by extracting lower-level features from
the received bitstream such as the motion vectors. However,
this quality prediction scheme depends on the availability of
the received bitstream, which is exactly what we try to over-
come in this paper, so that networking researchers without
access to or experience in working with actual video streams
can meaningfully examine lossy video transmission mecha-
nisms. The visibility of packet losses in MPEG-2 video se-
quences is investigated in [11], where the test video sequences
are affected by multiple channel loss scenarios and human
subjects are used to determine the visibility of the losses.
The visibility of channel losses is correlated with the vi-
sual content of the missing packets. Correctly received pack-
ets are used to estimate the visual content of the missing
packets. However, the visual impact of (i.e., the quality degra-
dation due to) visible packet loss is not investigated. The im-
pact of the burst length on the reconstructed quality is mod-
eledandanalyzedin[12]. The propagation of loss to subse-
quent frames is affected by the correlation between the con-
secutive frames. The total distortion is calculated by mod-
eling the loss propagation as a geometric attenuation factor
and modeling the intra-refreshment as a linear attenuation
factor. This model is mainly focused on the loss burst length
and does not account for I-frame losses or B-frame losses.
In [13], a quality metric is proposed assuming that channel
losses result in a degraded frame rate at the decoder. Sub-
jective evaluations are used to predict this quality metric. A
nonlinear curve fitting is applied to the results of these sub-
jective evaluations. However, this quality metric is suitable
only for low bit rate coding and cannot account for channel
losses that result in an additional spatial quality deg radation
of the reconstructed video (i.e., not only temporal degrada-
tion).
We also note that in [14], video traces have been used
for studying rate adaptation schemes that consider the qual-
ity of the rate-regulated videos. The quality of the regulated
videos is assigned a discrete perceptual value, according to
the amount of the rate regulation. The quality assignment
is based on empirical thresholds that do not analyze the ef-
fect of a frame loss on subsequent frames. The propagation
of loss to subsequent frames, however, results in nonlinear
relationships between losses and the reconstructed qualities,
which we examine in this work. In [15], multiple video cod-
ing and networking factors were introduced to simplify the
determination of this nonlinear relationship from a network
and user perspective.
2. OVERVIEW OF ADVANCED VIDEO TRACES
In this section, we give an overview of the proposed advanced
video trace framework and a specific quality prediction
method within the framework. The presented method ex-
ploits motion information descriptors for predicting the re-
constructed video quality after losses during network trans-
port.
Osama A. Lotfallah et al. 3
Original video
sequence
Video
encoding
Conv entional
video trace
Visual content
analysis
Visual descriptors
Advanced
video trace
Quality
predictor
Reconstructed quality
Loss pattern
Network
simulator
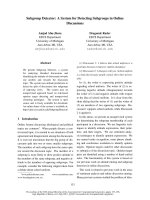
Figure 1: Proposed advanced video trace framework. The conventional video trace characterizing the video encoding (frame size and frame
quality of encoded frames) is combined with visual descriptors to form an advanced video trace. Based on the advanced video trace, the
proposed quality prediction schemes give accurate predictions of the decoded video quality after lossy network transport without requiring
experiments with actual video.
2.1. Advanced video trace framework
The two main components of the proposed framework,
which is illustrated in Figure 1, are (i) the advanced video
trace and (ii) the quality predictor. The advanced trace is
formed by combining the conventional video trace which
characterizes the video encoding (through frame size in bits
and frame quality in PSNR) with visual content descriptors
that are obtained from the original video sequence. The two
main challenges are (i) to extract a parsimonious set of visual
content descriptors that allow for accurate quality predic-
tion, that is, have a high correlation with the reconstructed
visual quality after losses, and (ii) to develop simple and ef-
ficient quality prediction schemes which based on the ad-
vanced video trace give accurate quality predictions. In order
to facilitate quality predictions at various levels and degrees
of precision, the visual content descriptors are organized into
ahierarchy,namely,frameleveldescriptors,GoPlevelde-
scriptors, and shot level descriptors. Correspondingly there
are quality predictors for e ach level of the hierarchy.
2.2. Overview of motion information based quality
prediction method
In this subsection, we give a summary of the proposed qual-
ity prediction method based on the motion information. We
present the specific components of this method within the
framework illustrated in Figure 1. The rationale and the anal-
ysis leading to the presented method are given in Section 3.
2.2.1. Basic terminology and definitions
Before we present the method, we introduce the required
basic terminology and definitions, which are also summa-
rized in Ta ble 1.WeletF(t, i) denote the value of the lu-
minance component at pixel location i, i
= 1, , N (as-
suming that all frame pixels are represented as a single ar-
ray consisting of N elements), of video fr ame t. Throughout,
we let K denote the number of P-frames between successive
I-frames and let L denote the difference in the frame index
between successive P-frames (and between I-frame and first
P-frame in the GoP as well as between the last P-frame in
the GoP and the next I-frame); note that correspondingly
there are L
− 1 B-frames between successive P-frames. We let
D(t, i)
=|F(t, i) − F(t − 1, i)| denote the absolute differenc e
between frame t and the preceding frame t
− 1atlocation
i. Following [ 16], we define the motion information M(t)of
frame t as
M(t)
=
1
N
N
i=1
D(t, i) − D(t)
2
,(1)
where
D(t) = (1/N)
N
i
=1
D(t, i) is the average absolute dif-
ference between frames t and t
− 1. We define the aggregated
motion information between reference frames, that is, be-
tween I- and P-frames, as
μ(t)
=
L−1
j=0
M(t − j). (2)
For a B-frame, we let v
f
(t, i) be an indicator variable, which
is set to one if pixel i is encoded using forward motion es-
timation, is set to 0.5 if interpolative motion estimation is
used, and is set to zero otherwise. Similarly, we set v
b
(t, i)
to one if backward motion estimation is used, set v
b
(t, i)to
0.5 if interpolative motion estimation is used, and set v
b
(t, i)
to zero otherwise. We let V
f
(t) = (1/N)
N
i
=1
v
f
(t, i)de-
note the ratio of forward-motion-estimated pixels to the to-
tal number of pixels in frame t, and analogously denote by
V
b
(t) = (1/N)
N
i=1
v
b
(t, i) the ratio of backward-motion-
estimated pixels to the total number of pixels.
For a video shot, which is defined as a sequence of frames
captured by a single camera in a single continuous action in
space and time, we denote the intensity of the motion activity
by θ. The motion activity θ ranges from 1 for a low level of
motion to 5 for a high level of motion, and correlates well
with the human perception of the level of motion in the video
shot [17].
4 EURASIP Journal on Applied Signal Processing
Table 1: Summary of basic notations.
Variable Definition
L Distance between successive P-frames, that is, L–1 B frames between successive P frames
K Number of P-frames in GoP
R Number of affected P-frames in GoP as a result of a P-frame loss
N Number of pixels in a video frame
F(t, i) Luminance value at pixel location i in original frame t
F(t, i) Luminance value at pixel location i in encoded frame t
F(t, i) Luminance value at pixel location i in reconstructed frame t (after applying loss concealment)
A(t, i) Forward motion estimation at pixel location i in P-frame t
v
f
(t, i) Forward motion estimation at pixel location i in B-frame t
v
b
(t, i) Backward motion estimation at pixel location i in B-frame t
e(t, i) Residual error (after motion compensation) accumulated at pixel location i in frame t
Δ(t)
The average absolute difference between encoded luminance values
F(t, i)
and reconstructed luminance values
F(t, i) averaged over all pixels in frame t
M(t) Amount of motion information between frame t and frame t
− 1
μ(t)
Aggregate motion information between P-frame t a nd its reference frame t–L for frame level
analysis of decoders that conceal losses by copying from previous reference (in encoding order) frame
γ(t)
Aggregated motion information between P-frame t and the next I-frame for frame level analysis
of decoders that conceal losses by freezing the reference frame until next I-frame
μ Motion information μ(t) averaged over the underlying GoP
γ Motion information γ(t) averaged over the underlying GoP
2.2.2. Advanced video trace entries
For each video frame t, we add three parameter values to the
existing video traces.
(1) The motion information M(t)offramet, which is cal-
culated using (1).
(2) The ratio of forward motion estimation V
f
(t) in the
frame, which is added only for B-frames. We approx-
imate the ratio of backward motion estimation V
b
(t),
as the compliment of the ratio of forward motion es-
timation, that is, V
b
(t) ≈ 1–V
f
(t), which reduces the
number of added parameters.
(3) The motion activity level θ of the video shot.
2.2.3. Quality prediction from motion information
Depending on (i) the concealment technique employed at
the decoder and (ii) the quality prediction level of inter-
est, different prediction methods are used. We focus in this
summary on the concealment by “copying” (concealment by
“freezing” is covered in Section 4) and the frame level pre-
diction (GoP and shot levels predictions are covered in Sub-
sections 3.4 and 3.5). For the loss concealment by copying
and the frame level quality prediction, we further distinguish
between the lost frame itself and the frames that reference
the lost frame, which we refer to as the affected frames. With
the loss concealment by copying, the lost frame itself is re-
constructed by copying the entire frame from the closest ref-
erence frame. For an affected fr a me that references the lost
frame, the motion estimation of the affected frame is applied
with respect to the reconstruction of the lost frame, as elab-
orated in Section 3.
For the lost frame t itself, we estimate the quality degra-
dation Q(t) with a logarithmic or linear function of the mo-
tion information if frame t is a B-frame, respectively, of the
aggregate motion information μ(t)ifframet is a P-frame,
that is,
Q(t)
= a
B
0
× M(t)+b
B
0
, Q(t) = a
P
0
× M(t)+b
P
0
,
Q(t)
= a
B
0
× ln
M(t)
+ b
B
0
, Q(t)= a
P
0
× ln
M(t)
+b
P
0
.
(3)
(A refined estimation for lost B-frames considers the aggre-
gated motion information between the lost B-frame and the
closest reference frame, see Section 3 .) Standard best-fitting
curve techniques are used to estimate the functional param-
eters a
B
0
, b
B
0
, a
P
0
,andb
P
0
by extracting training data from the
underlying video programs.
Osama A. Lotfallah et al. 5
If the lost frame t is a P-frame, the quality degradation
Q(t + nL)ofaP-framet + nL, n
= 1, , K − 1, is predicted
as
Q(t + nL)
= a
P
n
× μ(t)+b
P
n
,
Q(t + nL)
= a
P
n
× ln
μ(t)
+ b
P
n
,
(4)
using again standard curve fitting techniques.
Finally, for predicting the quality deg radation Q(t + m)
ofaB-framet + m, m
=−(L − 1), − 1, 1, , L − 1, L +
1, ,2L
− 1, 2L +1, ,2L+ L − 1, ,(K − 1)L +1, ,(K −
1)L + L − 1, that references a lost P-frame t, we distinguish
three cases.
Case 1. The B-frame precedes the lost P-frame and references
the lost P-frame using backward motion extimation. In this
case, we define the aggregate motion information of the af-
fected B-frame t + m as
μ(t + m)
= μ(t)V
b
(t + m). (5)
Case 2. The B-frame succeeds the lost P-frame and both the
P-frames used for forward and backward motion estimation
are affected by the P-frame loss, in which case
μ(t + m)
= μ(t), (6)
that is, the aggregate motion information of the affected B-
frame is equal to the aggregate motion information of the
lost P-frame.
Case 3. The B-frame succeeds the lost P-frame and is back-
ward motion predicted with repect to the following I-frame,
in which case
μ(t + m)
= μ(t)V
f
(t + m). (7)
In all three cases, linear or logarithmic standard curve fit-
ting characterized by the funtional parameters a
B
m
, b
B
m
is used
to estimate the quality degradation from the aggregate mo-
tion information of the affected B-frame.
In summary, for each video in the video trace library, we
obtain a set of functional approximations represented by the
triplets (ϕ
P
n
, a
P
n
, b
P
n
), n = 0, 1, , K − 1, and (ϕ
B
m
, a
B
m
, a
B
m
),
m
=−(L − 1), − 1, 0,1, , L − 1,L +1, ,2L − 1, 2L +
1, ,2L+L
−1, ,(K−1)L+1, ,(K −1)L+L−1, whereby
ϕ
P
n
, ϕ
B
m
= “lin” if the linear functional approximation is used
and ϕ
P
n
, ϕ
B
m
= “ l og” if the logarithmic functional approxima-
tion is used.
With this prediction method, which is based on the anal-
ysis presented in the following section, we can predict the
quality degradation due to frame loss with relatively high ac-
curacy (as demonstrated in Sec tions 5 and 6) using only the
parsimonious set of parameters detailed in Subsection 2.2.1
and the functional approximation triplets detailed above.
3. ANALYSIS OF QUALITY DEGRADATION WITH
LOSS CONCEALMENT BY COPYING
In this section, we identify for decoders with loss conceal-
ment by copying the visual content descriptors that allow
for accurate prediction of the quality degradation due to a
frame loss in a GoP. (Concealment by freezing is consid-
ered in Section 4.) Toward this end, we analyze the propa-
gation of errors due to the loss of a frame to subsequent P-
frames and B-frames in the GoP. For simplicity, we focus in
this first study on advanced video traces on a single com-
plete frame loss per GoP. Single frame loss per GoP can be
used to model wireless communication systems that use in-
terleaving to randomize the fading effects. In addition, sin-
gle frame loss can be seen with multiple descriptions coding,
where video frames are distributed over multiple indepen-
dent video servers/transmission paths. We leave the develop-
ment and evaluation of advanced video traces that accom-
modate partial frame loss or multiple frame losses per GoP
to future work.
In this section, we first summarize the basic notations
used in our formal analysis in Table 1 and outline the setup of
the simulations used to complement the analysis in the fol-
lowing subsection. In Subsection 3.2, we illustrate the impact
of frame losses and motivate the ensuing analysis. In the sub-
sequent Subsections 3.3, 3.4,and3.5, we consider the pre-
diction of the quality degradation due to the frame loss at
the frame, GoP, and shot levels, respectively. For each level,
we analyze the quality degradation, identify visual content
descriptors to be included in the advanced video traces, and
develop a quality prediction scheme.
3.1. Simulation setup
For the illustrative simulations in this section, we use the
first 10 minutes of the Jurassic Park I movie. The movie had
been segmented in video shots using automatic shot detec-
tion techniques, which have been extensively studied and for
which simple algorithms are available [18].Thisenablesusto
code the first frame in every shot as an intraframe. The shot
detection techniques produced 95 video shots with a range
of motion activity levels. For each video shot, 10 human sub-
jects estimated the perceived motion activity level, according
to the guidelines presented in [19]. The motion activity level
θ was then computed as the average of the 10 human esti-
mates. The QCIF (176
× 144) video format was used, with a
frame rate of 30 fps, and the GoP structure IBBPBBPBBPBB,
that is, we set K
= 3andL = 3. The video shots were
coded using an MPEG-4 codec with a quantization scale of
4. (Any other quantization scale could have been used with-
out changing the conclusions from the following illustrative
simulations.) For our illustrative simulations, we measure
the image quality using a perceptual metric, namely, VQM
[7], which has been shown to correlate well with the hu-
man visual perception. (In our extensive performance evalu-
ation of the proposed advanced video trace framework both
VQM and the PSNR are considered.) The VQM metric com-
putes the magnitude of the visible difference between two
video sequences, whereby larger visible degradations result
in larger VQM values. The metric is based on the discrete co-
sine transform, and incorporates aspects of early visual pro-
cessing, spatial and temporal filtering, contrast masking, and
probability summation.
6 EURASIP Journal on Applied Signal Processing
I-frame loss
100806040200
Frame number
0
2
4
6
8
10
12
14
16
VQM
Shot 48
Shot 55
(a)
1st P-frame loss
100806040200
Frame number
0
2
4
6
8
10
12
14
16
VQM
Shot 48
Shot 55
(b)
2nd P-frame loss
100806040200
Frame number
0
2
4
6
8
10
12
14
16
VQM
Shot 48
Shot 55
(c)
1st B-frame loss
100806040200
Frame number
0
2
4
6
8
10
12
14
VQM
Shot 48
Shot 55
(d)
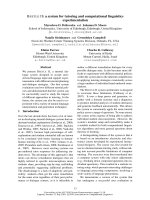
Figure 2: Quality degradation due to a frame loss in the underlying GoP for low motion activity level (shot 48) and moderately high motion
activity level (shot 55) video.
3.2. Impact of frame loss
To illustrate the effect of a single frame loss in a GoP, which
we focus on in this first study on advanced video traces,
Figure 2 shows the quality degradation due to var ious frame
loss scenarios, namely, I-frame loss, 1st P-frame loss in the
underlying GoP, 2nd P-frame loss in the underlying GoP,
and 1st B-frame loss between reference f rames. Frame losses
were concealed by copying from the previous (in decoding
order) reference frame. We show the quality degradation for
shot 48, which has a low motion activity level of 1, and for
shot 55 which has moderately high motion activity level of
3. As expected, the results demonstrate that I-frame and P-
frame losses propagate to all subsequent frames (until the
next loss-free I-frame), while B-fra me losses do not propa-
gate. Note that Figure 2(b) shows the VQM values for the re-
constructed video frames when the 1st P-frame in the GoP
is lost, whereas Figure 2(c) shows the VQM values for the re-
constructed frames when the 2nd P frame in the GoP is lost.
As we observe, the VQM values due to losing the 2nd P-frame
can generally be higher or lower than the VQM values due to
losing the 1st P-frame. The visual content and the efficiency
of the concealment scheme play a key role in determining the
VQM values. Importantly, we also observe that a frame loss
results in smaller quality degradations for low motion activ-
ity le vel video.
As illustrated in Figure 2, the quality degradation due to
channel losses is highly correlated with the visual content of
the affected frames. The challenge is to identify a representa-
tion of the visual content that captures both the spatial and
the temporal variations between consecutive frames, in order
to allow for accurate prediction of the quality degradation.
The motion information descriptor M(t)of[16], as g iven
in (1), is a promising basis for such a representation and is
therefore used as the starting point for our considerations.
3.3. Quality degradation at frame level
3.3.1. Quality degradation of lost frame
We initially focus on the impact of a lost frame t on the re-
constructed quality of frame t itself; the impact on frames
Osama A. Lotfallah et al. 7
I-loss
80706050403020100
Motion information
0
2
4
6
8
10
12
14
VQM
(a)
I-loss
80706050403020100
Motion information
0
2
4
6
8
10
12
14
VQM
(b)
I-loss
80706050403020100
Motion information
0
2
4
6
8
10
12
14
VQM
(c)
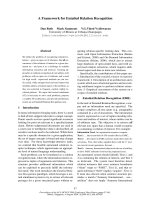
Figure 3: The relationship between the aggregate motion informa-
tion of the lost frame t and the quality degradation Q(t) of the re-
constructed frame.
that are coded with reference to the lost frame is considered
in the following subsections. We conducted simulations of
channellossesaffecting I-frames (I-loss), P-frames (P-loss),
and B-frames (B-loss). For both a lost I-frame t and a lost
P-frame t, we examine the correlation between the aggregate
Table 2: The correlation between motion information and quality
degradation for lost frame.
Frame type Pearson correlation Spearman correlation
I 0.903 0.941
P 0.910 0.938
B 0.958 0.968
motion information μ(t) from the preceding reference frame
t–L to the lost frame t,asgivenby(2), and the quality degra-
dation Q(t) of the reconstructed frame (w hich is frame t–L
for concealment by copying).
For a lost B-frame t+m, m
= 1, , L−1, whereby frame t
is the preceding reference frame, we examine the correlation
between the aggregate motion information from the closest
reference frame to the lost frame and the quality degradation
of the lost frame t + m.Inparticular,ifm
≤ (L − 1)/2we
consider the aggregate motion information
m
j
=1
M(t + j),
and if m>(L
− 1)/2 we consider
L
j=m+1
M(t + j). (This ag-
gregate motion information is slightly refined over the basic
approximation given in (3). The basic approximation always
conceals a lost B-frame by copying from the preceding frame,
which may also be a B-frame. The preceding B-frame, how-
ever, may have been immediately flushed out of the decoder
memory and may hence not be available for reference. The
refined aggregate motion information approach presented
here does not require reference to the preceding B-frame.)
Figure 3 shows the quality degradation Q(t)(measured
using VQM) as a function of the aggregate motion informa-
tion for the different frame types. The results demonstrate
that the correlation between the aggregate motion informa-
tion and the quality degradation is high, which suggests that
the aggregate motion information descriptor is effective in
predicting the quality degradation of the lost frame.
For further v alidation, the correlation between the pro-
posed aggregate motion information descriptors and the
quality degradation Q(t) (measured using VQM) was calcu-
lated using the Pearson correlation as well as the nonpara-
metric Spearman correlation [20, 21]. Table 2 gives the cor-
relation coefficients between the aggregate motion informa-
tion and the corresponding quality degradation (i.e., the cor-
relation between x-axis and y-axis of Figure 3). The highest
correlation coefficients are achieved for the B-frames since in
the considered GoP with L
− 1 = 2B-framesbetweensuc-
cessive P-frames, a lost B-frame can be concealed by copy-
ing from the neighboring reference frame, whereas a P- or
I-frame loss requires copying from a reference frame that is
three frames away.
Overall, the correlation coefficients indicate that the mo-
tion information descriptor is a relatively good estimator of
the quality degradation of the underlying lost frame, and
hence, the quality degradation of the lost frame itself is pre-
dicted with high accuracy by the functional approximation
givenin(3). Intuitively, note that in the case of little or no
motion, the concealment scheme by copying is close to per-
fect, that is, there is only very minor quality degradation.
8 EURASIP Journal on Applied Signal Processing
The motion information M(t) reflects this situation by being
close to zero; and the functional approximation of the qual-
ity degradation also gives a value close to zero. In the case
of camera panning, the close-to-constant motion informa-
tion M(t) reflects the fact that a frame loss results in approx-
imately the same quality degradation at any point in time in
the panning sequence.
3.3.2. Analysis of loss propagation to subsequent frames for
concealment by copying
Reference frame (I-fr a me or P-frame) losses affect not only
the quality of the reconstructed lost frame but also the qual-
ity of reconstructed subsequent frames, even if these sub-
sequent frames are correctly received. We analyze this loss
propagation to subsequent frames in this and the following
subsection. Since I-frame losses very severely degrade the re-
constructed video qualities, v ideo transmission schemes typ-
ically prioritize I-frames to ensure the lossless transmission
of this frame type. We will therefore focus on analyzing the
impact of a P-frame loss in a GoP on the quality of the sub-
sequent frames in the GoP.
In this subsection, we present a mathematical analysis of
the impact of a single P-frame loss in a GoP. We consider ini-
tially a decoder that conceals a frame loss by copying from
the previous reference frame (frame freezing is considered in
Section 4). The basic operation of the concealment by copy-
ing from the previous reference frame in the context of the
frame loss propagation to subsequent frames is as follows.
Suppose the I-frame at the beginning of the GoP is correctly
received and the first P-frame in the GoP is lost. Then the sec-
ond P-frame is decoded with respect to the I-frame (instead
of being decoded with respect to the first P-frame). More
specifically, the motion compensation information carried in
the second P-frame (which is the residual error between the
second and first P-frames) is “added” on to the I-frame. This
results in an error since the residual error between the first
P-frame and the I-frame is not available for the decoding.
This decoding error further propagates to the subsequent P-
frames as well as B-frames in the GoP.
To for m alize these concepts, we introduce the following
notation. We let t denote the position in time of the lost P-
frame and recall that there are L
− 1 B-frames between two
reference frames a nd K P-frames in a GoP. We index the I-
frame and the P-frames in the GoP with respect to the posi-
tion of the lost P-frame by t + nL, and let R, R
≤ K − 1, de-
note the number of subsequent P-frames affected by the loss
of P-frame t. In the above example, where the first P-frame
in the GoP is lost, as also illustrated in Figure 4, the I-frame
is indexed by t
− L, the second P-frame by t + L,andR = 2
P-frames are affected by the loss of the first P-frame. We de-
note the luminance values in the original frame as F(t, i), in
the loss-free frame after decoding as
F(t, i),andintherecon-
structed frame as
F(t, i). Our goal is to estimate the average
absolute frame difference between
F(t, i)and
F(t, i), which
we denote by Δ( t). We denote i
0
, i
1
, i
2
, for the trajectory of
pixel i
0
in the lost P-frame (with index t+0L) passing through
the subsequent P-frames with indices t +1L, t +2L,
IBBPBBPBBPBBI
F(t
− L, i) F(t, i) F(t + L, i) F(t +2L, i)
Figure 4: The GoP structure and loss model w ith a distance of L =
3 frames between successive P-frames and loss of the 1st P-frame.
3.3.2.1 Analysis of quality degradation of
subsequent P-frames
The pixels of a P-frame are usually motion-estimated from
the pixels of the reference frame (which can be a preceding
I-frame or P-frame). For example, the pixel at position i
n
in
P-frame t + nL is estimated from the pixel at position i
n−1
in
the reference frame t +(n
− 1)L, using the motion vectors of
frame t+nL. Perfect motion estimation is only guaranteed for
still image video, hence a residual error (denoted as e(t, i
n
))
is added to the referred pixel. In addition, some pixels of the
current frame may be intra-coded without referring to other
pixels. Formally, we can express the encoded pixel value at
position i
n
of a P-frame at time instance t + nL as
F
t + nL, i
n
=
A
t + nL, i
n
F
t +(n − 1)L, i
n−1
+ e
t + nL, i
n
, n = 1, 2, , R,
(8)
where A(t + nL, i
n
) is a Boolean function of the forward mo-
tion vector and is set to 0 if the pixel is intra-coded. This
equation can be applied recursively from a subsequent P-
frame backwards until reaching the lost frame t, with lumi-
nance values denoted by
F(t, i
0
). The resulting relationship
between the encoded values of the P-frame pixels at time
t + nL and the values of the pixels in the lost frame is
F
t + nL, i
n
=
F
t, i
0
n−1
j=0
A
t +(n − j)L, i
n− j
+
n−1
k=0
e
t +(n − k)L, i
n−k
k−1
j=0
A
t +(n − j)L, i
n− j
.
(9)
This exact analysis is rather complex and would require a
verbose content description, which in turn could provide a
rather exact estimation of the quality degradation. A verbose
content description, however, would result in complex ver-
bose advanced video traces, which would be difficult to em-
ploy by networking researchers and practitioners in evalua-
tions of video transport mechanisms. Our objec tive is to find
a parsimonious content description that captures the main
content features to allow for an approximate prediction of
Osama A. Lotfallah et al. 9
the quality degradation. We examine therefore the following
approximate recursion:
F
t + nL, i
n
≈
F
t +(n − 1)L, i
n−1
+ e
t + nL, i
n
. (10)
The error between the approximated and exact pixel value
can be represented as:
ζ
t + nL, i
k
=
⎧
⎪
⎨
⎪
⎩
F
t + nL, i
k
if A
t + nL, i
k
=
0
0 otherwise.
(11)
This approximation error in the frame representation is neg-
ligible for P-frames, in which few blocks are intra-coded.
Generally, the number of intra-coded blocks monotonically
increases as the motion intensity of the video sequence in-
creases. Hence, the approximation error in frame represen-
tation monotonically increases as the motion intensity level
increases. In the special case of shot boundaries, all the blocks
are intra-coded. In order to avoid a high prediction error
at shot boundaries, we introduce an I-frame at each shot
boundary regardless of the GoP structure.
After applying the approximate recursion, we obtain
F
t + nL, i
n
≈
F
t, i
0
+
n−1
j=0
e
t +(n − j)L, i
n− j
. (12)
Recall that the P-frame loss (at time instance t)isconcealed
by copying from the previous reference frame (at time in-
stance t–L), so that the reconstructed P-frames (at time in-
stances t + nL) can be expressed using the approximate re-
cursion as
F
t + nL, i
n
≈
F
t − L, i
0
+
n−1
j=0
e
t +(n − j)L, i
n− j
.
(13)
Thus, the average absolute differences between the recon-
structed P-frames and the loss-free P-frames are given by
Δ(t + nL)
=
1
N
N
i
n
=1
F
t + nL, i
n
−
F
t + nL, i
n
=
1
N
N
i
0
=1
F
t, i
0
−
F
t − L, i
0
.
(14)
The above analysis suggests that there is a high correlation
between the aggregate motion infor mation μ(t), given by
(2) of the lost P-frame, and the quality degradation, given
by (11), of the reconstructed P-frames. The aggregate mo-
tion information μ(t) is calculated between the lost P-frame
and its preceding reference frame, which are exactly the two
frames that govern the difference between the reconstructed
frames and the loss-free frames according to (11).
Figure 5 illustrates the relationship between the quality
degradation of reconstructed P-frames measured in terms of
the VQM metric and the aggregate motion information μ(t)
for the video sequences of the Jurassic Park movie for a GoP
Frame location:
IBBPBBP
BBPBB
IBBPBBPBBP
BB
1009080706050403020100
Motion information
0
2
4
6
8
10
12
14
VQM
(a)
Frame location:
IBBPBBPBBP
BB
1009080706050403020100
Motion information
0
2
4
6
8
10
12
14
VQM
(b)
Figure 5: The relationship between the quality degradations Q(t +
3) and Q(t + 6) and the aggregate motion information μ(t) (the lost
frame is indicated in italic font, while the considered affected frame
is underlined).
with L = 3andK = 3. The quality degradation of the P-
frame at time instance t + 3 and the quality degradation of
the P-frame at time instance t +6areconsidered.ThePear-
son correlation coefficients for these relationships (between
x-axis and y-axis data in Figure 5) are 0.893 and 0.864, re-
spectively, which supports the suitability of motion informa-
tion descriptors for estimating the P-frame quality degrada-
tion.
3.3.2.2 Analysis of quality degradation of
subsequent B-frames
For the analysis of the loss propagation to B-frames, we aug-
ment the notation introduced in the preceding subsection by
letting t + m denote the position in time (index) of the con-
sidered B-frame. The pixels of B-frames are usually motion-
estimated from two reference frames. For example, the pixel
at position k
m
in the frame with index t + m may be esti-
mated from a pixel at position i
n−1
in the previous reference
frame with index t and from a pixel at position i
n
in the next
10 EURASIP Journal on Applied Signal Processing
reference frame with index t + L. Forward motion vectors are
used to refer to the previous reference frame, while backward
motion vectors are used to refer to t he next reference frame.
Due to the imperfections of the motion estimation, a resid-
ual error e(t, k) is needed. The luminance value of the pixel
at position k
m
of a B -frame at time instance t +m can thus be
expressed as
F
t + m, k
m
=
v
f
t + m, k
m
F
t +(n − 1)L, i
n−1
+ v
b
t + m, k
m
F
t + nL, i
n
+ e
t + m, k
m
,
(15)
where m
=−(L − 1),−(L − 2), , −1, 1, 2, ,(L − 1), L +
1, ,2L
−1, 2L+1, 2L+ L− 1, (K −1)L+1, ,(K −
1)L + L − 1, n =(m/L),andv
f
(t, k)andv
b
(t, k) are the
indicator variables of forward and backward motion predic-
tion as defined in Subsection 2.2.
There are three different cases to consider.
Case 1. The pixels of the considered B-frame are referenc-
ing the error-free frame by forward motion vectors and the
lost P-frame with backward motion vectors. Using the ap-
proximation of P-frame pixels (12), the B-frame pixels can
be represented as
F
t + m, k
m
= v
f
t + m, k
m
F
t − L, i
−1
+ v
b
t + m, k
m
F
t, i
0
+ e
t + m, k
m
.
(16)
The lost P-frame at time instance t is concealed by copying
from the previous reference frame at time instance t–L.The
reconstructed B-frames can thus be expressed as
F
t + m, k
m
=
v
f
t + m, k
m
F
t − L, i
−1
+ v
b
t + m, k
m
F
t − L, i
0
+ e
t + m, k
m
.
(17)
Hence,theaverageabsolutedifference between the recon-
structed B-frame and the loss-free B-frame is given by
Δ(t + m)
=
1
N
N
k
m
=1
v
b
t + m, k
m
F
t, i
0
−
F
t − L, i
0
.
(18)
Case 2. The pixels of the considered B-frame are motion-
estimated from reference frames, both of which are affected
by the P-frame loss. Using the approximation of the P-frame
pixels (12), the B-fr ame pixels can be represented as
F
t + m, k
m
=
v
f
t + m, k
m
F
t, i
0
+
n−2
j=0
e
t +(n − j)L, i
n− j
+ v
b
t + m, k
m
F
t, i
0
+
n−1
j=0
e
t +(n − j)L, i
n− j
+ e
t + m, k
m
.
(19)
The vector (i
n−1
, i
n−2
, , i
0
) represents the trajectory of pixel
k
m
using backward motion estimation until reaching the lost
P-frame, while the vector (i
n−2
, i
n−3
, , i
0
) represents the
trajectory of pixel k
m
using forward motion estimation un-
til reaching the lost P-frame. P-frame losses are concealed by
copying from the previous reference frame, so that the recon-
structed B-frame can be expressed as
F
t + m, k
m
=
v
f
t + m, k
m
F
t − L, i
0
+
n−2
j=0
e
t +(n − j)L, i
n− j
+ v
b
t + m, k
m
F
t − L, i
0
+
n−1
j=0
e
t +(n − j)L, i
n− j
+ e
t + m, k
m
.
(20)
Thus,theaverageabsolutedifference between the recon-
structed B-frame and the loss-free B-frame is given by
Δ(t + m)
=
1
N
N
k
m
=1
v
b
t + m, k
m
+ v
f
t + m, k
m
×
F
t, i
0
−
F
t − L, i
0
.
(21)
Case 3. The pixels of the considered B-frame are referencing
the error-free frame (i.e., I-frame of next GoP) by backward
motion vectors and to the lost P-frame using forward motion
vectors. Using the approximation of the P-frame pixels (12),
the B-frame pixels c an be represented as
F
t + m, k
m
=
v
f
t + m, k
m
F
t + RL, i
R
+ v
b
t + m, k
m
F
t +(R +1)L, i
R+1
+ e
t + m, k
m
,
F
t + m, k
m
=
v
f
t + m, k
m
F
t, i
0
+
R−1
j=0
e
t +(R − j)L, i
R− j
+ v
b
t + m, k
m
F
t +(R +1)L, i
R+1
+ e
t + m, k
m
,
(22)
where R is the number of affected (subsequent) P-frames that
are affected by the P-frame loss at time instance t and
F(t +
(R +1)L, i) is the I-frame of the next GoP.
The reconstructed B-frames can be expressed as
F
t + m, k
m
=
v
f
t + m, k
m
F
t − L, i
0
+
R−1
j=0
e
t +(R − j)L, i
R− j
+ v
b
t + m, k
m
F
t +(R +1)L, i
R+1
+ e
t + m, k
m
.
(23)
Osama A. Lotfallah et al. 11
Thus,theaverageabsolutedifference between the recon-
structed B-frame and the loss-free B-frame is given by
Δ(t + m)
=
1
N
N
k
m
=1
v
f
t + m, k
m
F
t, i
0
−
F
t − L, i
0
.
(24)
The preceding analysis suggests that the following aggregate
motion information descriptors achieve a high correlation
with the quality degradation of the B-frames.
Case1: μ(t + m)
=
L−1
j=0
M(t − j)
1
N
N
k
m
=1
v
b
t + m, k
m
.
Case2: μ(t + m)
=
L−1
j=0
M(t − j)
1
N
×
N
k
m
=1
v
b
t + m, k
m
+ v
f
t + m, k
m
.
Case3: μ(t + m)
=
L−1
j=0
M(t − j)
1
N
N
k
m
=1
v
f
t + m, k
m
.
(25)
The first summation term in these equations represents
the aggregate motion information μ(t) between the lost P-
frame and its preceding reference frame (see (2)). The second
summation term represents the ratio of the backward motion
estimation V
b
(t + m), the ratio of non-intra-coding (which
we approximate as one in the proposed prediction method),
and the ratio of forward motion estimation V
f
(t + m) in the
B-frame, respectively, as summarized in (5)–(7).
Figure 6 shows the correlation between the aggregate
motion information μ(t + m) and the quality degradation
of B-frames for the loss scenario presented in Figure 4.
The Pearson correlation coefficients for these relationships
(shown in Figure 6) are 0.899, 0.925, 0.905, and 0.895, re-
spectively, which indicates the ability of the motion informa-
tion descriptors to estimate the reconstructed qualities of the
affected B-frames.
3.4. Quality degradation at GoP level
The frame level predictor requires a predictor for each frame
in the GoP. This fine-grained level of quality prediction may
be overly detailed for practical evaluations and be complex
for some video communication schemes. Another quality
predictor can be applied at the GoP level, whereby the qual-
ity degradation is estimated for the entire GoP. When a frame
loss occurs in a GoP, a summarization of the motion infor-
mation across all affected frames of the GoP is computed.
This can be accomplished by using (2), (5), (6), and (7), and
averaging over all ((R +2)L
− 1) frames that suffer a quality
degradation due to a P-frame loss at time instance t:
μ
=
1
(R +2)L − 1
RL−1
n=−(L−1)
μ(t + n). (26)
To see this, recall that R P-frames are affected by the loss due
to error propagation from the lost P-frame, for a total of R+1
P-frames with quality degradations. Also, recall that (L
−1) B-
frames are coded between P-frames for a total of (R+2)(L
−1)
affected B-frames.
Figure 7 shows the average quality degradation (mea-
sured using the VQM metric) for the GoP, where the x-
axis represents the summarization of the motion informa-
tion μ. Three illustrative simulations were conducted, cor-
responding to 1st P-frame loss, 2nd P-frame loss, and 3rd
P-frame loss. Similarly to the functional approximations of
Subsection 2.2.2, the quality degradation of the GoP can be
approximated by a linear or logarithmic function of the av-
eraged aggregate motion infor mation μ. The functional ap-
proximations can be represented by the t riplets (ϕ
GoP
r
, a
GoP
r
,
b
GoP
r
), r = 1, , K.
3.5. Quality degradation at shot level
The next coarser level in the logical granularity of a video
sequence after the GoP level is the shot level, w hich can pro-
vide networking researchers with a rough approximation of
the reconstructed quality. For the shot level analysis, we em-
ploy the motion activity level θ, which correlates well with
the human perception of the motion intensity in the shot.
Table 3 shows the average quality degradation (per af-
fected frame in the entire video shot) using the VQM metric
for various shot activity levels, for 3 different types of P-frame
losses (1st P-frame loss, 2nd P-frame loss, or 3rd P-frame
loss). Frame losses in shots with high motion activity levels
result in more severe quality degradation, compared to the
relatively mild degradation of shots with low motion activ ity
levels. Tabl e 3 also illustrates that the average quality degra-
dation of a shot depends on the position of the lost frame.
For example, the average quality degradation when losing the
2nd P-frame is 3.84, while the average quality degradation
when losing the 3rd P-frame is 3.45. Therefore, when a video
shot experiences a P-frame loss, the quality degradation can
be determined (using Ta ble 3) based on the location of the
P-frame loss as well as the motion activit y level of the video
shot. For each video in the video trace library, a table that
follows the template of Table 3 can be used to approximate
the quality degradation in the video shot.
4. ANALYSIS OF QUALITY DEGRADATION WITH
LOSS CONCEALMENT BY FREEZING
In this section, we consider a decoder that conceals lost
frames by freezing the last correctly received frame, until a
correct I-frame is received. If a P-frame at time instance t
is lost, the reference frame from time instance t–L is dis-
played at all time instances t + n,wheren
=−(L − 1), −(L −
2), ,0,1,2, In other words, all received frames at time
instances t + n are not decoded but replaced with the ref-
erence frame at time instance t–L. This technique of loss
concealment, while simple, results typically in quite signif-
icant temporal quality degradation, in contrast to the rela-
tively moderate temporal and spatial quality degradation of
the loss concealment by copying considered in the previous
12 EURASIP Journal on Applied Signal Processing
Frame location:
··BBPBB··
6050403020100
Motion information
0
2
4
6
8
10
12
VQM
(a)
Frame location:
··BBPBB··
6050403020100
Motion information
0
2
4
6
8
10
12
VQM
(b)
Frame location:
··BBPBB··
6050403020100
Motion information
0
2
4
6
8
10
12
VQM
(c)
Frame location:
··BBPBB··
6050403020100
Motion information
0
2
4
6
8
10
12
VQM
(d)
Figure 6: The relationship between the quality degradations Q(t − 2), Q(t − 1), Q(t +1), and Q(t + 2), and the aggregate motion information
μ(t
−2), μ(t−1), μ(t+1), and μ(t+2), respectively (the lost frame is indicated in italic font, while the considered affected frame is underlined).
section. For the GoP structure in Figure 4, for instance, if
the 2nd P-frame is lost during transmission, 8 frames will be
frozen. Human viewers perceive such quality degradation as
jerkiness in the normal flow of the motion. We use a percep-
tual metric, namely, VQM, to estimate this motion jerkiness
in our illustrative experiments since a perceptual metric is
better suited than the conventional PSNR metric for measur-
ing this quality degradation. In the following, we present the
method for calculating the composite motion information
for the frozen frames.
Assuming that the P-frame at time instance t is lost dur-
ing the video transmission and that there are R affected P-
frames t + L, , t + RL in the GoP before the next I-frame,
the reference frame at time instance t–L is frozen for a total
of RL +2L
− 1 frames. The difference between the error-free
frames and the frozen frames can be calculated as
Δ(t + n)
=
1
N
N
i=1
F(t + n, i) −
F(t − L, i)
(27)
for n
=−(L − 1), −(L − 2), ,0,1,2, , RL + L − 1.
This equation demonstrates that the quality degradation
for this type of decoder can be estimated from the motion in-
formation between the error-free frame t + n and the frozen
frame t – L.Thiseffect is captured with the aggregate motion
information descriptor
γ(t + n)
=
n
k=−(L−1)
M(t + k). (28)
The degree of temporal quality degradation depends on the
length of the sequence of frozen frames as well as the amount
of lost motion information. Therefore, estimating the quality
degradation for each individual frozen frame is not useful.
Instead, we consider a GoP level predictor and a shot level
predictor.
4.1. Quality degradation at GoP level
The GoP level predictor estimates the quality degradation
based on the γ(t + n) motion information averaged over all
the frozen frames, namely, based on the average aggregate
Osama A. Lotfallah et al. 13
Frame location:
IBBPBBPBBPBB
6050403020100
Motion information
0
1
2
3
4
5
6
7
8
9
10
VQM
(a) 11 degraded frames
Frame location:
IBBPBBPBBPBB
6050403020100
Motion information
0
1
2
3
4
5
6
7
8
9
10
VQM
(b) 8 degraded frames
Frame location:
IBBPBBPBBPBB
6050403020100
Motion information
0
1
2
3
4
5
6
7
8
9
10
VQM
(c) 5 degraded frames
Figure 7: The relationship between the average quality degradation
in the GoP and the average aggregate motion information μ using
concealment by copying (the lost frame is indicated in italic font).
motion information
γ
=
1
RL +2L − 1
RL+L−1
i=−(L−1)
γ(t + n). (29)
Table 3: The average quality degradation (per affected frame) for
each motion activity level for shots from Jurassic Park with conceal-
ment by copying.
Activity Video 1st P-frame 2nd P-frame 3rd P-frame
level shots # loss loss loss
1 12 1.670 1.558 1.354
2 24 2.967 2.813 2.443
3 45 4.459 4.425 3.989
4 12 5.359 5.461 5.199
5 2 7.264 7.451 5.968
All shots 95 3.896 3.844 3.455
The quality degradation can be approximated as a linear or
logarithmic function of γ.
Figure 8 shows the relationship between the average qual-
ity degradation of the underlying GoP, and the average aggre-
gate motion information descriptor for different P-fra me loss
scenarios. The Pearson correlation coefficients for these rela-
tionships are 0.929 for freezing the 2nd P-frame, and 0.938
for freezing the 3rd P frame. According to the GoP structure
shown in Figure 4, the 1st P-frame loss results in the freez-
ing of 11 frames of the GoP, and therefore reduces the frame
rate from 30 fps to 2.5 fps. This is very annoying to human
perception and it is not considered in our study.
4.2. Quality degradation at shot level
Table 4 shows the average quality degradation (per affected
frame) for video shots of various motion activity levels. We
consider the quality degradation due to losing the 2nd P-
frame, and the quality degradation due to losing the 3rd P-
frame.
Freezing lost frames for shots of high motion activity
levels results in more severe quality degradation, compared
to shots of low motion activity levels. In addition, the aver-
age quality degradation is affected by the position of the lost
frame. Comparing with Tab le 3, we observe that the qual-
ity degradation due to losing the 2nd P-frame is 3.84 for de-
coders that conceal frame losses by copying, while the qual-
ity degradation due to losing the 2nd P-frame is 5.45 for
decoders that conceal frame losses by freezing. For this qual-
ity predictor, when a video shot experiences a P-frame loss,
the quality degradation is determined (using Table 4)based
on the location of the P-frame loss as well as the motion ac-
tivity level of the video shot.
5. EVALUATION OF QUALITY PREDICTION USING
VQM METRIC
In this and the following section, we conduct an extensive
performance evaluation of the various quality predictors, de-
rivedinSections3 and 4. The video quality is measured
with the VQM metric in this section and with PSNR in
the following section. The accuracy of the quality predictor
(which is implemented using the advanced video traces) is
14 EURASIP Journal on Applied Signal Processing
Frame location:
IBBPBBPBBPBB
6050403020100
Motion information
0
2
4
6
8
10
12
14
VQM
(a)
Frame location:
IBBPBBPBBPBB
6050403020100
Motion information
0
2
4
6
8
10
12
14
VQM
(b)
Figure 8: The relationship between the average quality degradation
Q(t) in the GoP and the average aggregate motion information γ
using concealment by frame freezing (the lost frame is indicated in
italic font).
compared with the actual quality degra dation, determined
from experiments with the ac tual video bit streams. The
video test sequences used in the evaluation in this section
are extracted from the Jurassic Park I movieasdetailedin
Subsection 3.1.InSubsection 5.1 we consider error conceal-
ment by copying from the previous reference frame (as an-
alyzed in Section 3) and in Subsection 5.2 we consider error
concealment by frame freezing (as analyzed in Section 4).
5.1. Evaluation of quality prediction for
loss concealment by copying
P-frame losses are the most common type of frame losses that
have a significant impact on the reconstructed quality. We
have therefore conducted three different evaluations, corre-
sponding to 1st P-frame loss, 2nd P-frame loss, and 3rd P-
frame loss.
Table 4: The average quality degradation for each shot activit y level
(freezing).
Activity level 2nd P-frame freezing 3rd P-frame freezing
1 2.389 1.936
2 4.115 3.306
3 6.252 5.239
4 7.562 6.748
5 9.524 7.914
All shots 5.450 4.573
Jurassic Park
140120100806040200
Frame number
0
2
4
6
8
10
12
14
16
18
VQM
Rec. (shot 48)
Est. (shot 48)
Rec. (shot 55)
Est. (shot 55)
Figure 9: Comparison between actual reconstructed quality and es-
timated quality per each frame (2nd P-frame is lost in each GoP) for
concealment by copying.
5.1.1. Prediction at frame level
Figure 9 shows a comparison between the proposed scheme
for frame level quality prediction (est.) (see Subsections 2.2.3
and 3.3) and the actual reconstructed quality (rec.) due to
the loss of the 2nd P-frame. We observe from the figure that
the proposed frame level prediction scheme provides overall
a relatively good approximation of the actual quality degra-
dation. The accuracy of the frame level predictor is exam-
ined in further detail in Table 5, which gives the average
(over the entire video sequence) of the absolute difference
between the actual reconstructed quality and the predicted
quality. The frame level predictor can achieve an accuracy
of about
±0.65 for predicting the quality degradation of los-
ing the 2nd P-frame, where the average actual quality degra-
dation is about 3.844 (see Table 3) using the VQM metric.
We observe that better accuracy is achieved when video shots
have a lower motion activity level. For high motion activity
videos, the motion information is typically high. As we ob-
serve from Figures 5 and 6, the quality degradation values
are scattered over a wider range for high motion information
values. Hence, approximating the quality degradation of this
high motion information by a single value results in larger
prediction errors.
Osama A. Lotfallah et al. 15
Table 5: The absolute difference (in VQM) between actual recon-
structed quality and estimated quality using frame level analysis for
concealment by copying.
Activity
1st P-frame loss 2nd P-frame loss 3rd P-frame loss
level
1 0.434 0.361 0.315
2 0.600 0.578 0.469
3 0.859 0.807 0.764
4 1.252 1.326 1.309
5 1.871 1.948 1.948
All shots 0.696 0.650 0.607
Jurassic Park
191715131197531
GoP number
0
2
4
6
8
10
12
14
VQM
Rec. (shot 48)
Est. (shot 48)
Rec. (shot 55)
Est. (shot 55)
Figure 10: Comparison between actual reconstructed quality and
estimated quality per each GoP (2nd P-frame is lost in each GoP)
for concealment by copying.
The position of the lost frame has a significant impact on
the accuracy of the quality prediction. For example, the ac-
curacy of the quality predictor increases when fewer frames
are affected. In particular, when losing the 1st P-frame the
accuracy of the quality prediction is around
±0.6963, while
it is around
±0.6073 w hen losing the 3rd P-frame. The activ-
ity levels 4 and 5 do not follow this general trend of increas-
ing prediction accuracy with fewer affected frames, which is
primarily due to the small number of shots of activity lev-
els 4 and 5 in the test video (see Table 3) and the result-
ing small statistical validity. The more extensive evaluations
in Section 6 confirm the increasing prediction accuracy with
decreasing the number of affectedframesforallactivitylevels
(see in particular Tables 11, 12,and13).
5.1.2. Prediction at GoP level
Figure 10 shows the performance of the GoP level predictor
(see Subsection 3 .4), compared to the actual quality degrada-
tion. The performance over two video shots of motion activ-
ity level 1 (shot 48), and of motion ac tivity level 3 (shot 55)
is shown. Ta ble 6 shows the average absolute difference be-
tween the GoP quality predictor that uses the advanced video
traces and the actual quality degradation. Similarly to the
Table 6: The absolute difference (in VQM) between actual recon-
structed quality and estimated quality using GoP level analysis for
concealment by copying.
Activity
1st P-frame loss 2nd P-frame loss 3rd P-frame loss
level
1 0.418 0.369 0.363
2 0.568 0.542 0.477
3 0.761 0.676 0.699
4 1.055 1.231 1.386
5 1.660 1.876 1.683
All shots 0.643 0.607 0.606
frame level predictor, Table 6 shows that better accuracy is
achieved when shots are of lower motion activity level. Com-
paring the results shown in Tables 5 and 6, we observe that
more accurate estimates of the quality degradation are pro-
vided by GoP level predictors. T his is because the frame level
predictor estimates the quality degradation for each frame
type and for each frame position in the GoP, which results
in an accumulated estimation error for the entire GoP. On
the other hand, the GoP level predictor estimates the quality
degradation for a GoP by a single approximation. In the case
of 1st P-frame loss (where 11 frames are affected by the frame
loss and hence 11 approximations are used for the frame level
predictor), the accuracy of the GoP level predictor is about
0.643, while the accuracy of the frame level predictor is about
0.696. However, in the case of 3rd P-frame loss (where only
5framesareaffected by the frame loss), the reduction of the
estimation error with the GoP level predictor is marginal.
5.1.3. Prediction at shot level
Figure 11(a) shows the performance of the shot level pre-
dictor (see Subsection 3.5) compared to the actual qual-
ity degradation, when the 2nd P-frame in each GoP is lost
during video transmission. Figure 11(b) shows the motion
activity level for each video shot. Table 7 shows the accu-
racy of the shot level predictor. Similarly to frame level and
GoP level predictors, improvements in predicting the quality
degradation are achieved with shots of lower motion activity
level. In general, the accuracy of the shot level predictor is im-
proved when a frame loss is located close to the subsequent
correctly received I-frame, because it does not affect many
subsequent frames. Comparing the results of Tables 5, 6,and
7, the quality prediction using shot level analysis does not
provide any added accuracy compared to the quality predic-
tion using frame level analysis, or the quality prediction us-
ing GoP level analysis. The quality prediction using the GoP
level analysis is the best, in terms of the accuracy of the qual-
ity degradation estimate, and the speed of the calculation.
5.2. Evaluation of quality prediction for
loss concealment by freezing
Two different evaluations were conducted, corresponding to
2nd P-frame loss and 3rd P-frame loss.
16 EURASIP Journal on Applied Signal Processing
Table 7: The absolute difference (in VQM) between actual recon-
structed quality and estimated quality using shot level analysis for
concealment by copying.
Activity
1st P-frame loss 2nd P-frame loss 3rd P-frame loss
level
1 0.719 0.619 0.586
2 1.216 1.187 1.092
3 1.647 1.597 1.529
4 1.976 2.015 2.356
5 2.638 2.070 2.204
All shots 1.482 1.431 1.417
Jurassic Park
222018161412108642
Shot number
0
2
4
6
8
10
12
VQM
Rec.
Est.
(a)
Jurassic Park
222018161412108642
Shot number
1
2
3
4
5
Activity level
(b)
Figure 11: (a) Comparison between actual reconstructed quality
and estimated quality per each shot (2nd P-frame is lost in each
GoP); and (b) motion activity level of the video shots.
5.2.1. Prediction at GoP level
Figure 12 shows the performance of the GoP level predictor
(see Su bsection 4.1), compared to the actual quality degra-
dation, when the 2nd P-frame is lost during video transmis-
sion. The performance over two video shots of motion activ-
ity level 1 (shot 48) and of motion activity level 3 (shot 55)
is shown. Ta ble 8 shows the average absolute difference be-
Table 8: The absolute difference (in VQM) between actual recon-
structed quality and estimated quality using GoP level analysis for
concealment by freezing.
Activity level 2nd P-frame freezing 3rd P-frame freezing
1 0.542 0.537
2 0.640 0.541
3 0.847 0.772
4 1.278 1.324
5 1.624 1.639
All shots 0.740 0.698
Jurassic Park
191715131197531
GoP number
0
2
4
6
8
10
12
14
16
VQM
Rec. (shot 48)
Rec. (shot 55)
Est. (shot 48)
Est. (shot 55)
Figure 12: Comparison between actual reconstructed quality and
estimated quality per each GoP (2nd P-frame is lost in each GoP)
for concealment by freezing.
tween the GoP quality predictor and the actual quality degra-
dation. In the case of losing the 3rd P-frame, where the aver-
age quality degradation for this type of decoder is 4.573 (see
Table 4), the accuracy of the GoP qualit y predictor is about
±0.698 using the VQM metric. When the 2nd P-frame is lost,
the accuracy of the GoP level predictor for decoders that con-
ceal losses by copying is 0.6, while the accuracy of GoP level
predictor for decoders that conceal losses by freezing is 0.74
(compare Tab le 6 to Table 8). These results suggest that (1)
decoders that conceal losses by copying provide better re-
constructed quality (compare the results of Tables 3 and 4),
and (2) quality predictions derived from the advanced video
traces are better for decoders that conceal losses by copying.
5.2.2. Prediction at shot level
Figure 13 shows the performance of the shot level predictor
(see Subsection 4 .2) compared to the actual quality degrada-
tion, when the 2nd P-frame in each GoP is lost during video
transmission. Tabl e 9 shows the accuracy of the shot level
predictor. We observe that better accuracy is always achieved
when shots are of lower motion activity levels. In genera l, the
accuracy of shot level predictor is better when fewer frames
Osama A. Lotfallah et al. 17
Jurassic Park
222018161412108642
Shot number
0
2
4
6
8
10
12
14
16
VQM
Rec.
Est.
Figure 13: Comparison between actual reconstructed quality and
estimated quality per each shot (2nd P-frame is lost in each GoP)
for concealment by freezing.
are affected by the channel loss. Comparing the results of
Tables 8 and 9, we observe that the accuracy of quality pre-
diction using shot level analysis is significantly lower than the
accuracy of quality prediction using GoP level analysis.
6. EVALUATION OF QUALITY PREDICTION
USING PSNR METRIC
According to the results obtained with the VQM metric in
Section 5, the quality prediction for the error concealment
by copying and the GoP level quality predictor appear to be
the most promising. In this section, we follow up on the ex-
ploratory evaluations with the VQM metric by conducting
an extensive evaluation of the frame level and GoP level pre-
dictors using the PSNR as the quality metric of the recon-
structed video. We use the quality predictors analyzed in Sub-
sections 3.3 and 3.4 for decoders that conceal packet losses by
copying from the previous reference frame.
For the extensive evaluations reported in this section, we
randomly selected 956 video shots of various durations, ex-
tracted from 5 different video programs (Terminator, Star
Wars, Lady and Tramp, Tonight Show, and Football with Com-
mercial). The shots were detected and their motion activ-
ity levels were determined using the procedure outlined in
Subsection 3.1. Tabl e 10 shows the motion characteristics of
the selected video shots. Shots of motion activity level 5 are
rare in these video programs and have typically short dur a-
tion. For television broadcasts and kids programs, shots of
motion activity level 2 are common; see results of Tonight
Show and Lady and Tramp. However, for sports events and
movie productions, shots of motion activ ity level 3 are com-
mon; see results of Star Wars, Terminator,andFootball
WC.
For these 5 video programs, the advanced video traces
are composed of (i) the frame size in bits, (ii) the quality of
the encoded video (which corresponds to the video quality
of loss-free transmission) in PSNR, (iii) the motion infor-
mation descriptor M(t) between successive frames, which is
calculated using (1), (iv) the ratio of forward motion estima-
Table 9: The absolute difference (in VQM) between actual recon-
structed qualit y and estimated quality using shot level analysis.
Activity level 2nd P-frame freezing 3rd P-frame freezing
1 0.934 0.727
2 1.552 1.329
3 2.08 1.891
4 2.440 2.355
5 1.927 2.256
All shots 1.842 1.666
tion V
f
(t), and (v) the motion activity level θ of the under-
lying video shot. These video tr aces are used by the quality
predictors to estimate the quality degradation due to frame
losses.
6.1. Frame level predictor for concealment by copying
The quality predictor presented in Subsection 3.3 is used to
estimate the reconstructed qualities when the video trans-
mission suffers a P-frame loss. We have conducted three dif-
ferent evaluations for 1st P-frame loss, 2nd P-frame loss, and
3rd P-frame loss. Tables 11 , 12,and13 show (i) the mean ac-
tual quality reduction in dB, that is, the average difference be-
tween the PSNR quality of the encoded video and the PSNR
quality of the actual reconstructed video, and (ii) the mean
absolute prediction error in dB, that is, the average absolute
difference between the actual quality reduction in dB and the
predicted quality reduction for the frame level quality pre-
dictor for each motion activity level, and for the whole video
sequence. (We note that for the PSNR metric the quality
degradation Q is defined as Q
= (encoded quality − actual re-
constructed quality)/encoded qualit y for the analysis in Sec-
tions 2–4; for ease of comprehension we report here the qual-
ity reduction
= encoded quality − actual reconstructed qual-
ity.) We observe that the proposed quality predictor gives a
relatively good approximation of the actual quality degrada-
tion. We observe from Table 13, for instance, that for the Ter-
minator movie, where the actual quality reduction is about
9.4 dB when losing the 3rd P-frame, the frame level quality
predictor estimates the reconstructed qualities with an accu-
racy of
±1.4 dB around the actual value.
We observe that the accuracy of this quality predictor
is generally monotonically decreasing as the motion activity
level increases. Due to the small number of shots of motion
activity level 5, the results for activity level 5 have only very
limited statistical validity. For some video shots of motion
activity level 1, the quality predictor does not effectively es-
timate the reconstructed qualities. In these video shots, the
actual quality reduction (in dB) is larger than the estimated
quality reduction. This is mainly because for shots of low
motion activit y levels, the actual quality reduction measured
in PSNR tends to be higher than the actual quality reduction
perceived by humans and predicted with our methodology.
Indeed, comparing Tables 5 and 11, we observe that when
the perceptual quality metric is used, which more closely
18 EURASIP Journal on Applied Signal Processing
Table 10: The characteristics of the video test sequences.
Video sequence
Number of shots Total number Duration of shots per Total duration
per activity level of shots activity level (seconds) (minutes)
1234 5 1 2 3 4 5
Star Wars 10 52 89 44 5 200 22 200 427 244 29 15.37
Terminator 14 70 98 18 1 201 34 147 491 148 6.7 13.77
Football
WC 14 68 90 27 2 201 8.4 123 177 53 6.3 6.14
Tonight Show 15 89 42 6 1 153 30 642 186 29 4.4 14.85
Lady and Tramp 19 87 73 22 0 201 76 293 531 201 0 18.35
Table 11: The mean actual quality reduction and the mean absolute prediction error (in PSNR) between actual reconstructed quality and
estimated quality using frame level analysis when the 1st P-frame is lost.
Video sequence
The mean quality reduction per activity level The mean absolute prediction error per activity level
12 3 4 5 Allshots 12345 Allshots
Star Wars 5.52 7.99 8.40 12.60 11.24 9.44 2.55 1.85 2.08 2.38 2.62 2.14
Terminator 4.09 9.21 11.12 12.54 11.35 10.75 1.57 1.91 2.03 2.38 3.28 2.06
Football
WC 4.72 7.29 10.87 13.81 19.25 10.10 3.41 2.23 2.37 2.98 1.80 2.43
Tonight Show 6.25 8.06 10.02 12.92 19.88 8.62 1.84 1.78 2.27 2.10 4.09 1.91
Lady and Tramp 6.31 8.41 9.10 10.15 — 8.92 1.73 1.98 2.04 2.10 — 2.01
models the human perception, the prediction accuracy of
our methodology for shots of motion activity 1 is higher than
for the other shot activity levels. The average accuracy for
video programs such as Tonight Show is better than that for
other video progr ams because of its statistical distr ibution of
the motion activity levels; see Tabl e 10. Similarly to the re-
sults of Section 5, the accuracy of the prediction is improved
if the number of affected frames is smaller.
6.2. GoP level predictor for concealment by copying
Tables 14, 15,and16 show the quality prediction error of the
GoP level quality predictor from Subsection 3 .4 for each mo-
tion activity level, and for the whole video sequence. Com-
paring these prediction errors with the average actual quality
reductions reported in Tables 11, 12,and13 demonstrates
that the GoP level predictor achieves very good prediction
accuracy. Similarly to the observations for the frame level
predictor, the accuracy of the GoP quality predictor gener-
ally monotonically improves as the motion activity level de-
creases. For some video shots, the quality predictor cannot
effectively estimate the reconstructed qualities for some mo-
tion activity levels, since the number of video shots of the
motion activity level is underrepresented in the training set
which is used to generate the functional approximations of
the quality degradation. In addition, the PSNR metric is not
suitable for measuring the quality degradation for shots of
low motion activity levels, which in turn degrades the accu-
racy of the GoP level quality predictor. Similarly to the results
of Section 5, substantial improvements in the accuracy of es-
timating the actual quality degradation are achieved if the
GoP level predictor is adopted compared to the frame level
predictor. Comparing Tables 11 and 14, for instance, a 1 dB
improvement in estimating the quality reduction is achieved
for the Star Wars movie, in the case of 1st P-frame loss.
7. CONCLUSION
A framework for advanced video traces has been proposed,
which enables the evaluation of video transmission over lossy
packet networks, without requiring the actual videos. The
advanced video t races include—aside from the frame size (in
bits) and PSNR contained in conventional video traces—a
parsimonious set of visual content descriptors that can be
arranged in a hierarchal manner. In this paper, we focused
on motion-related content descriptors. Quality predictors
that utilize these content descriptors to estimate the quality
degradation have been proposed. Our extensive simulations
demonstrate that the GoP level quality predictors typically
estimate the actual quality degradation with an accuracy of
about
±1 dB. The performance of the proposed quality pre-
dictors can be improved by using a perceptual quality metric
such as VQM instead of the traditional PSNR. The proposed
advanced video trace framework is flexible enough to be used
with various packet transmission scenarios, multiple meth-
ods of loss concealment, different granularities of the video
sequence (frame level, GoP level, shot level), and a different
degree of accuracy in estimating the reconstructed qualities.
To the best of our knowledge the advanced video traces, pro-
posed in this paper, represent the first comprehensive eval-
uation scheme that permits communication a nd networking
researchers and engineers without access to actual videos to
meaningfully examine the performance of lossy video trans-
port schemes.
There are many exciting avenues for future work on ad-
vanced video traces. One direction is to develop advanced
Osama A. Lotfallah et al. 19
Table 12: The mean actual quality degradation and the mean absolute prediction error (in PSNR) between actual reconstructed quality and
estimated quality using frame level analysis when the 2nd P-frame is lost.
Video sequence
The mean quality reduction per activity level The mean absolute prediction error per activity level
12 3 4 5 Allshots 12345 Allshots
Star Wars 4.62 7.60 7.96 12.04 10.34 8.96 2.13 1.66 1.83 2.05 2.40 1.88
Terminator 3.96 9.00 10.85 12.39 12.49 10.52 1.44 1.69 1.79 2.19 2.56 1.83
Football
WC 2.57 7.01 10.30 13.95 18.98 9.70 2.01 2.06 2.17 2.87 1.79 2.22
Tonight Show 6.01 7.88 9.97 12.80 19.49 8.47 1.61 1.43 1.91 1.83 3.26 1.56
Lady and Tramp 6.01 8.12 8.93 9.91 — 8.69 1.42 1.71 1.83 1.89 — 1.78
Table 13: The mean actual quality degradation and the mean absolute prediction error (in PSNR) between actual reconstructed quality and
estimated quality using frame level analysis when the 3rd P-frame is lost.
Video sequence
The mean quality reducion per activity level The mean absolute prediction error per activity level
123 4 5 Allshots 12345 Allshots
Star Wars 3.52 6.80 6.92 10.73 9.66 7.91 1.57 1.35 1.42 1.62 1.87 1.47
Terminator 3.01 7.85 9.73 11.25 11.21 9.40 1.02 1.24 1.41 1.68 3.22 1.42
Football
WC 1.64 5.95 9.07 12.47 18.42 8.51 3.38 1.82 1.89 2.57 1.39 1.99
Tonight Show 5.11 7.05 9.10 12.12 18.46 7.63 0.95 0.81 1.33 1.26 3.11 0.95
Lady and Tramp 4.84 7.18 8.00 8.98 — 7.74 0.99 1.27 1.37 1.40 — 1.32
Table 14: The mean absolute prediction error (in PSNR) between
actual reconstructed quality and estimated quality using GoP level
analysis when the 1st P-frame is lost.
Video sequence
The mean absolute prediction
error per activity level
12345Allshots
Star Wars 1.79 0.95 1.12 1.27 1.55 1.15
Terminator 0.59 0.82 1.07 1.35 2.02 1.06
Football
WC 2.59 1.23 1.40 2.05 1.12 1.46
Tonight Show 0.97 0.83 1.27 1.22 2.80 0.95
Lady and Tramp 0.59 0.80 0.89 1.03 — 0.87
Table 15: The mean absolute prediction error (in PSNR) between
actual reconstructed quality and estimated quality using GoP level
analysis when the 2nd P-frame is lost.
Video sequence
The mean absolute prediction
error per activity level
12345Allshots
Star Wars 1.61 0.86 1.02 1.15 1.46 1.05
Terminator 0.56 0.83 1.02 1.31 1.73 1.03
Football
WC 1.60 1.20 1.29 1.92 1.22 1.35
Tonight Show 1.02 0.75 1.16 1.09 2.67 0.86
Lady and Tramp 0.59 0.76 0.87 0.95 — 0.84
traces that allow for the prediction of the reconstructed video
quality when multiple fr a mes are lost within a GoP. Another
direction is to examine how the quality predictors can be
improved by incorporating color-related content descriptors
such as the color layout descriptors (frame level, GoP level,
Table 16: The mean absolute prediction error (in PSNR) between
actual reconstructed quality and estimated quality using GoP level
analysis when the 3rd P-frame is lost.
Video sequence
The mean absolute prediction
error per activity level
12345Allshots
Star Wars 1.21 0.96 1.07 1.11 1.30 1.07
Terminator 0.63 0.83 1.05 1.21 2.09 1.03
Football
WC 1.02 1.13 1.23 1.73 0.69 1.26
Tonight Show 0.88 0.72 1.10 1.01 2.57 0.82
Lady and Tramp 0.80 0.80 0.83 0.88 — 0.83
and shot level) as well as the camer a movement descrip-
tors, which characterize the zoom-in, zoom-out, panning,
and tilting operations.
ACKNOWLEDGMENTS
This work was supported in part by the National Science
Foundation through Grant ANI-0136774. Any opinions,
findings, and conclusions or recommendations expressed in
this material are those of the authors and do not necessarily
reflect the views of the National Science Foundation.
REFERENCES
[1] R. Narasimha and R. Rao, “Modeling variable bit rate video on
wired and wireless networks using discrete-time self-similar
systems,” in Proceedings of IEEE International Conference on
Personal Wireless Communications (ICPWC ’02), pp. 290–294,
New Delhi, India, December 2002.
20 EURASIP Journal on Applied Signal Processing
[2] A. Bhattacharya, A. G. Parlos, and A. F. Atiya, “Prediction of
MPEG-coded video source traffic using recurrent neural net-
works,” IEEE Transactions on Signal Processing, vol. 51, no. 8,
pp. 2177–2190, 2003.
[3] F. H. P. Fitzek and M. Reisslein, “MPEG-4 and H.263 video
traces for network performance evaluation,” IEEE Network,
vol. 15, no. 6, pp. 40–54, 2001.
[4] P. Seeling, M. Reisslein, and B. Kulapala, “Network perfor-
mance evaluation using frame size and quality traces of single-
layer and two-layer video: a tutorial,” IEEE Communications
Surveys and Tutorials, vol. 6, no. 3, pp. 58–78, 2004.
[5] S. Valaee and J C. Gregoire, “Resource allocation for video
streaming in wireless environment,” in Proceedings of the
5th International Symposium on Wireless Personal Multimedia
Communications (WPMC ’02), vol. 3, pp. 1103–1107, Hon-
olulu, Hawaii, USA, October 2002.
[6] A. Kanjanavapastit and H. Mehrpour, “Packet reservation
multiple access for multimedia traffic,” in Proceedings of 10th
IEEE International Conference on Networks (ICON ’02),pp.
162–166, Singapore, 2002.
[7] A. B. Watson, J. Hu, and J. F. McGowan III, “Digital video
quality metric based on human vision,” Journal of Electronic
Imaging, vol. 10, no. 1, pp. 20–29, 2001.
[8] Z. He and C. W. Chen, “End-to-end video quality analysis and
modeling for video streaming over IP network,” in Proceed-
ings of IEEE International Conference on Multimedia and Expo
(ICME ’02), vol. 1, pp. 853–856, Lausanne, Switzerland, 2002.
[9] Y. Wang and Q F. Zhu, “Error control and concealment
for video communication: a review,” Proceedings of the IEEE,
vol. 86, no. 5, pp. 974–997, 1998.
[10] A. R. Reibman, V. A. Vaishampayan, and Y. Sermadevi, “Qual-
ity monitoring of video over a packet network,” IEEE Transac-
tions on Multimedia, vol. 6, no. 2, pp. 327–334, 2004.
[11] S. Kanumur i , P. Cosman, and A. R. Reibman, “A generalized
linear model for MPEG-2 packet-loss visibility,” in Proceedings
of 14th International Packet Video Workshop (PV ’04), Irvine,
Calif, USA, December 2004.
[12] Y. J. Liang, J. G. Apostolopoulos, and B. Girod, “Analysis of
packet loss for compressed video: does burst-length matter?”
in Proceedings of IEEE International Conference on Acoustics,
Speech, and Signal Processing (ICASSP ’03), vol. 5, pp. 684–687,
Hong Kong, April 2003.
[13] M. Masry and S. S. Hemami, “Perceived quality metrics for
low bit rate compressed video,” in Proceedings of IEEE Inter-
national Conference on Image Processing (ICIP ’02), vol. 3, pp.
49–52, Rochester, NY, USA, 2002.
[14] N. G. Duffield, K. K. Ramakr ishnan, and A. R. Reibman, “Is-
sues of quality and multiplexing when smoothing rate adap-
tive video,” IEEE Transactions on Multimedia, vol. 1, no. 4, pp.
352–364, 1999.
[15] O. Verscheure, X. Garcia, G. Karlsson, and J P. Hubaux,
“User-oriented QoS in packet video delivery,” IEEE Network,
vol. 12, no. 6, pp. 12–21, 1998.
[16] ITU-T Recommendation P.910, “Subjective video quality as-
sessment methods for multimedia applications ”, Recommen-
dations of the ITU, Telecommunication Standardization Sec-
tor, approved in September 1999.
[17] S. Jeannin and A. Divakaran, “MPEG-7 visual motion descrip-
tors,” IEEE Transactions on Circuits and Systems for Video Tech-
nology, vol. 11, no. 6, pp. 720–724, 2001.
[18] J. S. Boreczky and L. A. Rowe, “Comparison of video shot
boundary detection techniques,” in Storage and Retrieval for
Still Images and Video Databases IV, vol. 2664 of Proceedings of
SPIE, San Jose, Calif, USA, pp. 170–179, 1996.
[19] K. A. Peker and A. Divakaran, “Framework for measurement
of the intensity of motion activity of video segments,” Journal
of Visual Communication and Image Representation, vol. 15,
no. 3, pp. 265–284, 2004.
[20] R. V. Hogg and A. T. Craig, Introduction to Mathematical
Statistics, Macmillan, New York, NY, USA, 5th edition, 1995.
[21] E. L. Lehmann and H. J. M. D’Abrera, Nonparametr ics: Statis-
tical Methods Based on Ranks, Prentice-Hall, Englewood Cliffs,
NJ, USA, rev. edition, 1998.
Osama A. Lotfallah is a Postdoctoral Re-
search Associate in the Department of
Computer Science and Engineering of Ari-
zona State University since January 2005.
He received his B.S. and Master’s degrees
from the School of Computer Engineering
at Cairo University, Egypt, in July 1997 and
July 2001, respectively. During his Master’s
study, he was working as Teacher Assistant
in the Computer Science Department of
Cairo University. He received his Ph.D. degree in electrical en-
gineering from Arizona State University, in December 2004, un-
der the supervision of Prof Sethuraman Panchanathan. He was
actively involved in the teaching and research activities in the
field of digital signal processing. He was also an active Member
of the Video Traces Research Group of Arizona State University
(). His research interest is in the fields of
advanced video coding, digital video processing, visual content ex-
traction, and video streaming, with a focus on adaptive video trans-
mission schemes. He has two provisional USA patents in the field
of content-aware video streaming. He is a regular reviewer of many
international conferences in the field of visual communication as
well as periodical journal and magazines in the field of multimedia
and signal processing.
Martin Reisslein is an Associate Professor
in the Department of Electrical Engineering
at Arizona State University (ASU), Tempe.
He received the Dipl Ing. (FH) degree from
the Fachhochschule Dieburg, Germany, in
1994, and the MSE degree from the Univer-
sity of Pennsylvania, Philadelphia, in 1996.
He received his Ph.D. in systems engineer-
ing from the University of Pennsylvania in
1998. During the academic year 1994–1995,
he visited the University of Pennsylvania as a Fulbright scholar.
From July 1998 through October 2000, he was a Scientist with
the German National Research Center for Information Technology
(GMD FOKUS), Berlin, and a Lecturer at the Technical University
Berlin. From October 2000 through August 2005, he was an Assis-
tant Professor at ASU. He is the Editor-in-Chief of the IEEE Com-
munications Surveys and Tutorials and has served on the Techni-
cal Program Committees of IEEE Infocom and IEEE Globecom.
He maintains an extensive library of video traces for network per-
formance evaluation, including frame size traces of MPEG-4 and
H.263 encoded video, at . He is corecipient
of the Best Paper Award of t he SPIE Photonics East 2000—Terabit
Optical Networking Conference. His research interests are in the
areas of Internet quality of service, video traffic characterization,
wireless networking, and optical networking.
Osama A. Lotfallah et al. 21
Sethuraman Panchanathan is a Professor
and Chair of the Computer Science and En-
gineering Department as well as the Interim
Director of the Department of Biomedical
Informatics (BM), Director of the Institute
for Computing & Information Sciences &
Engineering, and Director of the Research
Center on Ubiquitous Computing (CUbiC)
at Arizona State University, Tempe, Arizona.
He has published over 200 papers in refer-
eed journals and conferences. He has been a Chair of many con-
ferences, program committee member of numerous conferences,
organizer of special sessions in several conferences, and an invited
panel member of special sessions. He has presented several invited
talks in conferences, universities, and industry. He is a Fellow of
the IEEE and SPIE. He is an Associate Editor of the IEEE Trans-
actions on Multimedia, IEEE Transactions on Circuits and Systems
for Video Technology, Area Editor of the Journal of Visual Commu-
nications and Image Representation, and an Associate Editor of the
Journal of Electronic Imaging. He has guest edited special issues in
the Journal of Visual Communication and Image Representation,
Canadian Journal of Electrical and Computer Engineering , and the
IEEE Transactions on Circuits and Systems for Video Technology.