Báo cáo hóa học: " FPGA-Based Reconfigurable Measurement Instruments with Functionality Defined by User" potx
Bạn đang xem bản rút gọn của tài liệu. Xem và tải ngay bản đầy đủ của tài liệu tại đây (3.43 MB, 14 trang )
Hindawi Publishing Corporation
EURASIP Journal on Applied Signal Processing
Volume 2006, Article ID 84340, Pages 1–14
DOI 10.1155/ASP/2006/84340
FPGA-Based Reconfigurable Measurement Instruments with
Functionality Defined by User
Guo-Ruey Tsai and Min-Chuan Lin
Department of Electronics Engineering, Kun-Shan University of Technology, Taiwan
Received 2 October 2004; Revised 5 March 2005; Accepted 25 May 2005
Using the field-programmable gate array (FPGA) with embedded software-core processor and/or digital signal processor cores,
we are able to construct a hardware kernel for measurement instruments, which can fit common electronic measurement and
test requirements. We call this approach the software-defined instrumentation (SDI). By properly configuring, we have used the
hardware kernel to implement an n-channel arbitrary waveform generator with various add-on functions, a wideband and pre-
cise network analyzer, a high-speed signal digitizer, and a real-time sweep spectrum analyzer. With adaptively reconfiguring the
hardware kernel, SDI concept can easily respond to the rapidly changing user-application-specified needs in measurement and test
markets.
Copyright © 2006 Hindawi Publishing Corporation. All rights reserved.
1. INTRODUCTION
As the power of FPGA increases [1, 2], we find ourselves
with the ability to design, simulate, analyze, and even emu-
late the more complex devices with application-specified em-
bedded processor and/or digital signal processor cores. From
the viewp oint of SDI concept [3], the process of measure-
ment has been reduced only to signal excitation, captures,
conditioning, processing, and output display as illustrated in
Figure 1 [4]. Figure 2 illustrates that the traditional instru-
mentation technique depends on digital signal processor, mi-
croprocessor unit, virtual inst ruments, application-specified
integrated circuit (ASIC), or FPGA, which are in charge of
the responsibility of sig nal conditioning and signal process-
ing.
The instrument market is fragmented because instru-
ments are specialized in hardware to serve thousands of
slightly divergent test applications. In fact, the traditional
classification of measurement instruments (such as volt-
meter, frequency counter, function generator, oscilloscope,
signal analyzer, etc.) has become blurred, and to some ex-
tent can be replaced with a single set of reconfigurable hard-
ware, called hardware kernel. The hardware kernel can be re-
configured by software to implement a specified measure-
ment instrument. With such a software-defined architec-
ture concept applied to the circuit level, we have two ad-
vantages. First, it can dramatically reduce the number of
hardware components in all mixed-signal designs. This then
possibly means a much smaller chip size for system-on-chip
implementation. Second, it can provide automatic adjust-
ment or compensation for circuit component variations
due to temperature dependence, aging, manufacturing tol-
erances, and so forth.
Current high-performance FPGA is richly equipped w ith
built-in on-chip SRAM, which includes block RAM and dis-
tributed RAM. Therefore, either logic circuits using table-
lookup algorithm or embedded processor in system-on-
chip application could utilize the on-chip SRAM to improve
the speed degrading due to external chips’ interconnection
and then enhance the entire system performance. Under a
single-hardware-core architecture, all the implemented in-
struments are meant only to adjust the instrumental func-
tions in software way and apply them to their specified ap-
plication fields. In Section 2, we illustr ate the system archi-
tecture of the proposed hardware kernel first. In Section 3,
we introduce five kinds of possible instrument design al-
gorithms by SDI philosophy: multichannel arbitrary func-
tion generator, DC transfer curve tracer, transient response
analyzer, steady-state network analyzer, and real-time spec-
trum analyzer. In Sections 4, 5, 6,and7,wewilldemon-
strate the practical implementation of four signal process-
ing devices: an n-channel arbitrary waveform generator with
various add-on functions [5], a wideband and precise phase
detector [6], high-speed signal sampler by multiple-path al-
gorithm [7], and all-digital real-time spectr um analyzer [8].
In Section 8, a flexible re-configuration methodology of this
SDI system is presented. Finally, we have come into a conclu-
sion.
2 EURASIP Journal on Applied Signal Processing
Physical
quantities
Sensor
transducer
Excitation
Signal
Signal
conditioning
Transmission
or display
Output
Signal
processing
Figure 1: Measurements technique by SDI.
Physical
quantities
Sensor
transducer
Excitation
Signal
Transmission
or display
Output
ASIC
MPU
DSP
FPGA
VIs
Figure 2: Instrumentation technique.
2. HARDWARE KERNEL FOR THE RECONFIGURABLE
INSTRUMENTS
Figure 3 illustrates the proposed hardware kernel architec-
ture. Besides FPGA, we need other ASIC chips to process ana-
log signals. In order to measure time, frequency, and phase
responses of the device under test (DUT), we need the fol-
lowing function modules: digital-to-analog converter, wave-
form amplifier, analog-to-digital converter, waveform sharp-
ener,phasedetector,hardwarepeak/troughdetector,andhu-
man input devices (HIDs).
The original stimulus signal generated by FPGA is in dig-
ital form. For analog exciting signal requirement, it must be
converted by digital-to-analog converter, filtered and shaped
by low-pass-filter, and amplified or attenuated by amplifier
or DC offset. The amplitude of the exciting signal can be
adjusted through automatic gain control which is achieved
by FPGA-generating programmable gain-adjustment (PGA)
signal.
We also need signal capture and digitization modules.
The output signals from DUT can be digital or analog. The
latter needs to be captured and digitized by analog-to-digital
converter. To meet the input signal limitations to analog-to-
digital converter, the sig nal gain of output analog signals still
needs to be controlled by the PGA signal which is generated
by FPGA.
We need to detect the inevitable phase drift between in-
put and output signals from DUT. By waveform sharpening
circuit, we can transform the periodical analog signal into
square wave. The phase difference can be drawn out from the
duty cycle of the square wave. The duty cycle is calculated
by the FPGA or ASIC chip. The process of phase detection is
shown as Figure 4.
To calculate sine wave excitation and response amplifi-
cation factor, we need peak extraction circuit to detect two
peak-to-peak values and get the quotient between them.
From the data array, the embedded processor in FPGA can
take out the peak values (maximum or minimum) for fur-
ther processing.
All human interface devices (HID) for manipulation and
test data presentation are basic interfaces for each instru-
ment. The proposed hardware kernel includes the follow-
ing HIDs: push wheel switch, led, text LCD, graphic display
STN/LCD or color TFT/LCD, keyboard, touch panel, even
oscilloscope signal driver.
The flash RAM can be used to store sine, Log, or other
mathematic function lookup tables for exciting signal gener-
ation, and ease fast data operations.
This system can be operated in on-line mode and the per-
sonal computer (PC) can control and communicate with it.
Without the PC, this system is also a stand-alone device off-
line operated by panel components and displayed to liquid
crystal display (LCD). We have designed the panel controller
and LCD controller using the embedded processor.
For on-line operations, we can design a PC development
platform with powerful graphic unit interface (GUI) and
mathematic functions package, which can be suppor ted from
Matlab or LabVIEW. On the other hand, the hardware kernel
should have some on-line operation interfaces, such as USB,
SPI, or UART to communicate with the PC.
3. RECONFIGURABLE INSTRUMENTS
With the complete hardware kernel architecture, we can con-
figure FPGA to match the necessary function specifications
for various measurement environments and requirements.
Here we introduce five types of SDI design algorithms for
specified applications.
3.1. Arbitrary waveform generator
Utilizing direct digital synthesizer (DDS) [2, 9–11]algo-
rithm, we can generate any periodic function with arbi-
trary frequency, amplitude, and waveform. As illustrated in
Figure 5, the function waveforms are preloaded into flash
RAM, and will be directly loaded into the built-in RAM in
FPGA when powered up. The waveform frequency can be set
up to half the system clock. Using 32-bit phase accumulator
can achieve a frequency resolution of 0.02 Hz. The embed-
ded 8
− bit processor in FPGA is in charge of the control
of HIDs and setting calculation of frequency and amplitude.
Arranged as Figure 6, we reorganize the DDS data processing
path and generate two channels of FM, PM, FSK, or PSK sig-
nals. Section 4 will describe an n-channel arbitrary waveform
generator with various add-on functions in detail.
3.2. DC transfer function analyzer
We use a transfer function analyzer to analyze the trans-
fer function between input and output signals, and we can
observe the linearit y characteristics of the measured sen-
sor/transducer. The input/output transfer curve measure-
ment is essential for characterizing DUTs with electronic
circuits. Arranging the FPGA software design flow as in
Figure 7, we can configure the proposed hardware kernel into
a DC transfer function analyzer.
G R. Tsai a nd M C. Lin 3
PC
USB
UART
SPI
FPGA
Oscilloscope
I/F (D/A)
Text LCD &
push wheel SW
Graphic LCD &
touch screen
Flash
RAM
Stimulus signal
PGA
PGA
Peak
detector
A/D
Waveform
process
(Amp/Atten)
Phase
detector
pulse (PD)
Waveform
process(D/A)
(Amp/Atten)
Signal in
Signal out
Device under
test
(DUT)
Figure 3: Hardware kernel for the reconfigurable instr uments.
S1
S2
Zero crossing
(comparator)
I1
I2
Phase detector
(RS discriminator)
P0
Figure 4: Phase detection
3.3. Steady-state network analyzer
For the hardware kernel as in Figure 3, when using DDS tech-
nique to generate sweep sine wave, and retrieving the phase
and peak response of the DUT, we can collect the tabular data
of the system frequency response. The frequency response
spectrum can be constructed by calculating the tabular data
in logarithm by the embedded processor and put into dis-
play on the color graphic LCD. We also can upload the data
array to a PC for further processing. Section 5 will describe
a wideband and precise network analyzer based on FPGA in
detail.
3.4. Transient-state analyzer
When the proposed arbitrary function generator generates
synchronized periodic signal as the required exciting sig-
nal which is fed into the DUT, we wil l get the time re-
sponse output w h ich needs further transient analysis, as
shown in Figure 8. To overcome the lower sampling rate of
the analog-to-digital converter, a multipass algorithm is pro-
posed. Section 6 will describe a multipass algorithm digitizer
based on FPGA in detail.
We can have n-time the effective sampling rate. When
the exciting signal is designed and presented as a periodically
variable duty-cycle square wave, a step response analyzer is
built up. If an FFT algorithm is built into the FPGA, the hard-
ware kernel will be configured as a software-based spectrum
analyzer.
3.5. Real-time spectrum analyzer
Figure 9 illustrates a real-time sweep spectrum analyzer us-
ing a fixed IF fi lter and a sweeping local oscillator (LO).
The mixer output contains the input signal, the LO signal,
the sum and difference between these two signals, and var-
ious other frequency components. If we know the LO fre-
quency exactly, then by sending these frequency components
through a narrow IF filter, we can identify both the amplitude
and the frequency of the unknown input signal. Whenever
any of these components falls within the IF filter bandwidth,
an AC voltage, which is related to the input signal’s ampli-
tude, i s produced. This AC voltage is converted to a DC volt-
age by an envelope detector, and the result is displayed on the
y-axis of the screen.
By HDL coding or schematic entry, we can implement
the mixer, narrow IF filter, envelope detector, voltage-control
oscillator (VCO), and other processing algorithms into the
same FPGA chip. Section 7 will describe an FPGA-based de-
sign of real-time sweep spectrum analyzer in detail. The next
section describes the developed n-channel arbitrary wave-
form generator with various add-on functions.
4. n-CHANNEL ARBITRARY WAVEFORM GENERATOR
WITH VARIOUS ADD-ON FUNCTIONS [5]
4.1. DDS waveform generator
DDS is the most popular technique to synthesize AC in-
centive signals for instrumentation, measurement, and dig-
ital communications. Generating synthesized waveforms by
DDS technique has the following benefits: high frequency
resolution, precise frequency control, and low complexity.
Figure 10 shows the simplified DDS block diagram [9].
Utilizing conventional table-lookup algorithm for DDS,
we need not generate both sine and cosine functions and can
realize desired functions with smaller memory table size. We
4 EURASIP Journal on Applied Signal Processing
PC DAC
Internal bus
I/F
controller
(USB/SPI)
Embedded
CPU
DDS
SRAM
(build-in)
Panel
controller
LCD
controller
Flash
controller
SRAM
controller
Panel LCD Flash
FPGA
Figure 5: System architecture for arbitrary n-channel function generator.
Modulatution
sensitivity
(kf)
Frequency
control
word
Frequency modulation signal
(FM)
Phase modulation signal
(PM)
Frequency
register
Phase
register
Phase accumulator
Output
D/A
+
LPF
Waveform
table
Figure 6: On-chip FM/PM modulation.
Tablet graphic
display
Yes
Vi > final Vi <
= Vi+V
step
A/D
digitization
No
D/A outputVi <
= initial
Figure 7: DC transfer function measurement.
can implement all the necessary digital logic circuits and the
lookup memory in the same FPGA chip so that a better per-
formance can be achieved by avoiding interchip connections
[3, 10]. To generate the required analog signals, commercial
digital-to-analog converters (DAC) can be adopted. Lowpass
filters (LPF) a re required to filter out high frequency noise.
The entire instrument system includes a PC platform,
USB controller, FPGA waveform synthesizer, and DAC/LPF
output buffer, as shown in Figure 11. The PC is the sys-
tem development platform, responsible for arbitrary func-
tion waveform editing, previewing, encoding, lookup data
downloading, and the coding and decoding of USB com-
mands. The multiple operation windows and GUI applica-
tion programs are coded by Visual Basic language.
The USB controller will deal with the messages inter-
change between PC platform and FPGA chip. The Cypress
EZ-USB controller is utilized to communicate the PC with
the FPGA. It provides some DLL files, which can be called
and linked by Visual Basic, Visual C languages, and/or Lab-
VIEW programs in the PC platform, and simplifies the de-
sign for both messages interchange and transmission control
of GUI windows. Besides the parallel interface, we can also
use the SPI or I
2
C techniques to communicate between USB
controller and FPGA to save the pins resource of the FPGA.
By the plug-n-play property of USB interface, a PC can be
used to develop many AWG instruments simultaneously.
4.2. FPGA realization
The FPGA is used to synthesize the specified function wave-
form. We adopt Xilinx Spartan II XC2S200PQ208 which
G R. Tsai a nd M C. Lin 5
PC
FPGA
USB
UART
SPI
Oscilloscope
I/F (D/A)
Graphic LCD &
touch screen
Waveform
process
(RC, compatator)
Waveform
process (D/A)
(Amp/Atten)
Arbitrary
stimulus signal
PGA
Multipass timing control
PGA
Bitstream
Signal in
Signal out
Device under
test
(DUT)
Figure 8: Transient state analyzer.
LO
IF
Envelope detector
CRT
Sweep generator
Figure 9: Real-time sweep spectrum analyzer.
Frequency
control
Clock
Phase
accumulator
Waveform
map in
SRAM
Digital-to-
analog
converter
Output
Figure 10: Simplified block diagram of the direct digital synthe-
sizer.
affords on-chip true single-port blocked synchronous RAM.
The total available memory size is 56 kbit. The FPGA chip
is configured into four main parts: hand-shaking controller
between USB and FPGA, SRAM (block RAM), SRAM con-
troller, and remaining control logic. The SRAM is utilized
for both built-in and downlo adable lookup tables. The built-
in lookup table can also be reserved for specified wave-
forms output directly or built-in self-test purpose for the
instrument itself. Together with n DACs, we can reconfigure
the SRAM capacity into n parts for n-channel analog signal
outputs. In this case, we have up to 56 channel outputs us-
ing 1 kbit per channel. On the PC platform, you can down-
load each channel w aveform one by one. Adopting 50 MHz
clock frequency and 32-bit phase accumulator word length,
we have a 0.01164 Hz frequency resolution.
4.3. Function performance
After integrating all the interfacing software, firmware, and
hardware, the instrument can afford typical fundamental
waveforms output, such as sinusoidal, square, and triangle
functions. We can also edit any mathematical equations in
the edit window and output their waveforms. Typical modu-
lated waveforms, such as AM, FM, and others, can be edited
and stored into the waveform banks in advance. You can
choose anyone you like from the waveform banks and freely
output to any desired channel. The instrument also provides
piecewise linear function output with multiple data points
periodically. Choosing FPGA with larger on-chip SRAM ca-
pacity for lookup table usage, we can flexibly expand the out-
put channel numbers or improve the waveform resolution.
With the programmability in the PC development platform,
we can output the waveforms to individual channels inde-
pendently, or generate a mixed waveform, which is a linear
combination among several other channels.
Furthermore, we can produce a series of n-channel wave-
forms, which show some group-related functions for special
application purposes. Figure 12 shows the typical output re-
sults of the instrument. Figures 13(a) and 13(b) show two
clear frequency spectrums for 1 kHz sinusoidal waveforms
produced by this instrument and Agilent 33120A signal gen-
erator individually. We have nearly the same waveform qual-
ity.
6 EURASIP Journal on Applied Signal Processing
USB
USB
controller
SPI/I2C
Parallel
Built-in
lookup table
Downloadable
lookup table
ROM SRAM
FPGA
(ASIC)
D/A(LP)
D/A(LP)
.
.
.
Ch#n
Ch#2
Ch#1
Figure 11: The system architecture of the n-channel arbitrary waveform generator.
4.4. Add-on function
The instrument also provides an algorithm for more
advanced custom-made waveforms generation. Taking a
custom-made FSK signal generator as the example, you can
input or edit a modulation bitstream on the PC platform,
and download it to the SRAM in FPGA chip. Processed by a
preset FSK control code, we can combine both the bitstream
channel and sine wave channel to generate the desired FSK
signal. Figure 14 shows the custom-made signal generation
flow.
The algorithm receives the data from both sine wave and
piecewise linear generators, and respectively decides the fre-
quency for “1” and “0” which can control the accumulator
phase increment generator and construct the designed FSK
signal. AM-ASK control code can be coded to generate the
designed AM-ASK signal by the same approach. With the re-
served input port, the external FSK control code IP can di-
rectly be fed into and generate the designed FSK signal w ave-
form by the stand-alone instrument.
5. WIDEBAND AND PRECISE PHASE DETECTOR
BASED ON FPGA WITH EMBEDDED
PROCESSOR [6]
We can use the multiplier phase detector [4] or logarithmic
amplifiers to implement a phase detector. But these two ap-
proaches are both mixed-mode type and unsuitable for sys-
tem on-chip (SoC) design which is in all-digital type. There
exist several digital design methodologies for phase detec-
tor, such as EXOR phase detector, JK flip-flop phase detector,
phase-frequency detector, Nyquist-rate phase detector, zero-
crossing phase detector, and Hilbert-transform phase detec-
tor [12, 13]. But they are all only suitable for some specified
narrowband frequency range. To detect phase in another fre-
quency range, we must modify phase detection and calcula-
tion circuits to meet the necessary requirements, and then be
able to get the precise value of phase difference.
5.1. All-digital phase detector
The proposed phase detector is an all-digital approach to
measure the phase difference of two signals with the same
frequency. Gathering the signal frequency by control circuit
in FPGA and calculating data by the embedded processor in
FPGA, we can adaptively adjust the sampling clock, which is
used to measure the pulse period. This phase detector auto-
matically detects and adjusts the sampling clock without any
circuits’ modification.
Figure 15 demonstrates the proposed all-digital adaptive
algorithm for phase detection, including incoming signal’s
frequency recovery circuit, sampling clock generator, and all-
digital phase detectors. The period of sampling clock, T
s
,is
the function of both income signal frequency ( f
s
)andphase
resolution (Δ p). And the phase value, P
d
, is the function of
both sampling period (T
s
) and the pulse duration of phase
difference (ΔP
t
):
T
s
= f
f
s
, Δ p
,(1)
P
d
= f
T
s
, ΔP
t
. (2)
From (1), we must get the incoming signal frequency
and desired phase resolution at first, and then put them
into the programmable fractional-N frequency synthesizer.
Finally, we have the sampling clock required for phase detec-
tion. Combining the sampling clock and a specially designed
counter algorithm, we can get a phase difference value with 8
to 12 bits from (2).
5.2. FPGA realization
We design the whole system with our proposed phase mea-
surement method for specified network analyzer applica-
tions and implement it by FPGA, as illustrated i n Figure 5.
From the operation point of view, we have USB interface for
PC on-line operation, and embedded processor for stand-
alone off-line control. The DDS-powered function genera-
tor is used for sweep stimulus signal generator and sampling
clock generator. The all-digital phase lock loop (PLL) with
programmable divide-by-N module is used for the phase
detection of uncontrollable random input signals. And an
LCD display controller is also included for stand-alone use
display.
Utilizing DDS algorithm, we can generate any periodic
function waveform with arbitrary frequency, amplitude, and
waveform. The embedded 8-bit processor in FPGA is in
G R. Tsai a nd M C. Lin 7
Figure 12: Typical output waveforms displayed by Agilent 54622D oscilloscope.
(a)
(b)
Figure 13: Displayed 1 kHz sinusoidal spectrum comparison be-
tween (a) the reconfigurable instr ument and (b) Agilent 33120 A
signal generator. The spectrums are displayed by Agilent 54622D.
charge of the control of USB communication and setting cal-
culation of frequency, amplitude, and sampling clock.
When the input signal of DUT is not generated by the
system function generator, but comes from other uncontrol-
lable signal source, we use both the all-digital phase locked
loop and fractional-N frequency synthesizer [14], as illus-
trated in Figure 16, to recover input signal’s frequency and
generate required sampling clock. To meet the requirement
of precise resolution, the programmable scale-factor-N di-
vider must generate the counting clock required for calculat-
ing the duration of phase difference. Constituted by counters,
the all-digital phase detector can output 8- to 12-bit digital
signals for phase calculation according to the requirement of
phase resolution and the successive processing circuits.
5.3. Performance analysis
Table 1 lists the comparison of measured phase differences of
RC circuit from 10 to 10 kHz measured by Agilent 54621A
oscilloscope and our proposed method, respectively. From
the results, it is apparent that our proposed method is precise
enough, and the measurement frequency range is relatively
wide without specified parameter adjustment and further
special logic circuits.
When we adopt automatic sweep stimulus signal gen-
erator, which is controlled by a PC, to generate the input
signal, and collect and analyze the data by LabVIEW pro-
gram, we have the amplitude and phase response as shown in
Figure 17. It is evident that the measurement is rather precise
within a wide frequency range. It supports that our proposed
method is suitable for all-digital SoC system realization.
6. HIGH-SPEED SIGNAL SAMPLER BY
MULTIPLE-PATH ALGORITHM [7]
To implement an A/D converter into a pure digital chip, a
delta-sigma D/A algorithm must be built in to work together
with SAR, flash, or other types of A/D algorithms. The slow
conversion rate of delta-sigma D/A algorithm is the main
8 EURASIP Journal on Applied Signal Processing
PC
platform
FSK control code
Channel
1
sine wave SG
Channel
0
bitstream SG
FPGA
FSK O/P
External
I/P
Figure 14: The customer-made FSK signal generation flow.
U2 input
signal
U1 input
signal
Sampling
clock (Ts)
Frequency calculation
and sampling clock
generator
All-digital
phase
detector
PD [8
···0]
Figure 15: All-digital adaptive algorithm for phase detection.
U1 input
signal
Sampling
clock ( f
s
=N
∗
f
U1
)
All digital PLL
Divider-N
Programmable
scalar factor N
Figure 16: All-digital PLL fractional-N frequency synthesizer.
limitation to the whole A/D converter for capturing high-
bandwidth periodic signals.
6.1. Multipass method
According to the sampling theory, we need a sampling rate
two times larger than the greatest signal frequency so that
the original signal can be reconstructed after it was sampled.
The higher the sampling rate is, the more complete the sig-
nal reconstruction is. For a periodic signal, if we periodically
sample the signal w hose frequency can be larger or even less
than the signal frequency with the available sampling device,
we can get a set of sampled signal values. Then, we take a fix
Table 1: Comparison of the measured phase differences of RC cir-
cuit.
Frequency (Hz)
Phase measured (degree)
Agilent 54621A Proposed method
10 0.00 0
50
0.00 0
100
−4.32 −4
500
−16.20 −16
1K
−31.68 −32
2.5K
−52.20 −51
5K
−64.80 −64
10 K
−72.00 −71
0
10
Hz
1
50
Hz
2
100
Hz
3
500
Hz
4
1
KHz
5
2.5
KHz
6
5
KHz
7
10
KHz
−14
−12
−10
−8
−6
−4
−2
0
dB
−70
−60
−50
−40
−30
−20
−10
0
degree
Frequency response Network analyzer
Figure 17: Automatic sweep RC-circuit frequency response by our
system.
time shift t
shift
, calculated as follows:
Δt
shift
=
sampling − time
n
,(3)
where n is an integer. We can repeatedly and synchronously
get n sets of sampled signal values, and store them into the
embedded memory in FPGA. Figure 18 demonstrates the
proposed multipath sampling algorithm.
G R. Tsai a nd M C. Lin 9
Δt
shift
Sample
Signal (A/D)
Pass 1 sample
Pass 2 sample
Figure 18: Multipass under-sampling algorithm.
By this way, the apparent sampling rate is n times higher
than the real-time sampling rate. If n is large enough, we can
overcome the problem of the low real-time sampling rate and
get more satisfactory s ignal reconstruction.
6.2. FPGA realization
We use an FPGA chip, an RC circuit, an LF398 sample/hold
chip, and an LM319 comparator chip to implement the mul-
tipass method, as shown in Figure 19. The built-in DDS arbi-
trary waveform generator is used to generate the desired pe-
riodical sig nal waveform whose data stream is stored in the
waveform data table. The external R-2R circuit is used to con-
vert the digital data streams into continuous analog s ignal. To
verify the captured signal quality, we directly bypass the out-
put signal into the sample/hold chip so that we can compare
the original and the captured signals. Through the compara-
tor chip, the compared result between the output signal from
sample/hold chip and the RC circuit output signal is fed into
the SAR A/D converter. The delta-sigma D/A converter out-
puts the bitstreams to the RC circuit, and then the charged
output signal is fed into the comparator chip. The internal
DDS module provides the necessary synchronous signal for
repeated sampling. If the tested signal comes from other sig-
nal source, we need the all-digital phase lock loop (ADPLL)
module (Figure 16) for signal synchronization and timing
control. The memory controller is in charge of the storage
and tr ansfer of the digital data streams. The TDC signal ex-
tractor is used for signal reconstruction. The interface circuit
can be used for PC communication and data transfer con-
troller.
6.3. System performance
In this demonstration, we use 50 MHz of system clock rate.
We use the DDS module to generate a sine wave with fre-
quency of 100 kHz as the stimulus signal. From the step re-
sponse of RC circuit, as shown in Figure 20 ,wehavethe
151 μs steady state rise time and 136 μsfalltime.
By estimation, the minimum converting time of the SAR
ADC is about 160 μs. In other words, the real-time maximum
signal capture sampling speed is about 780 Hz for 8 quan-
tum bits. According to the calculation formula of the real-
time sampling rate of the delta-sigma D/A converter, shown
as follows, we have the real-time sampling rate 760 Hz for
ADC
bit = 8andF = 15:
SR
=
50 MHz
2
(ADC bit +1)
× (F +1)× ADC bit
. (4)
Figure 21 shows the comparison of original input
100 kHz sine wave and the captured signal by the pro-
posed signal capturer. The captured signal has 256 sampled
points per period. We can find that the signal reconstruction
is rather satisfactory. We have demonstrated an ultrahigh-
speed signal capturer based on a single FPGA chip. The
multipath algorithm has enhanced the sampling rate from
a 760 Hz real-time sampling rate up to a 25.6 MHz apparent
sampling ra te. For further applications, we can use this de-
sign to measure the transient response of the device under
test.
7. ALL-DIGITAL REAL-TIME SPECTRUM ANALYZER [8]
A spectrum analyzer is used to analyze the frequency com-
ponents in signals under test. By mathematical calculation,
the traditional fast Fourier transform (FFT) can transform
the time-domain waveform to frequency-domain waveform
of the signal and become the key technique of the spectrum
analyzer. The sweeping frequency technique combined with
digital technique is also used to implement spectrum analysis
[15]. In general, the analysis accuracy of FFT technique is ba-
sically worse than that of the sweeping frequency technique
equipped with digital intermediate-frequency filter. From the
viewpoint of dynamic range decaying effect, the FFT tech-
nique is also worse. For smaller frequency range, the pro-
cessing speed of FFT technique is better, but worse for wider
frequency range. In the form of digital intelligent property
(IP), which can be mapped to a single FPGA chip, we de-
sign a real-time sweep spectrum analyzer. The system func-
tion block diagram of real-time sweep spectrum analyzer is
shown in Figure 22.
7.1. Theory of operation
The mixer is used to combine the signal under test and the
sweeping signals generated by the local oscillator (LO). The
mixer is a multiplier circuit, so the output is an amplitude-
modulated signal. According to the formula of triangular al-
gebra, we have the signals with sum frequency and difference
frequency, as shown in the following expression:
sin
2πf
0
t
× sin
2πf
in
=
1
2
cos 2π
f
0
− f
in
t −
1
2
cos 2π
f
0
+ f
in
t,
(5)
where, f
0
is the frequency of LO, f
in
is the input signal fre-
10 EURASIP Journal on Applied Signal Processing
FPGA
PC
USB
UART
SPI
Waveform
data table
DDS
AWG
Memory
controller
Signal
reconstruction
Multipass
algorithm
Delta-sigma
DAC
IF
TDC
SAR
A/D
ADPLL
DLL
Sync.
Digital
Periodic signal
R-2R
circuit
Analog periodic
signal
Device
under test
S/H
Analog signal
Bitstream
Figure 19: FPGA-based all digital signal capturer.
Figure 20: The step response of delta-sigma D/A converter.
quency. The central f requency of the finite-impulse-response
(FIR) bandpass filter ( f
IF
)is
f
IF
= f
0
+ f
in
. (6)
When the AM signal is passed to the FIR filter, the signal with
frequency band meeting the pass band of the filter can pass
through. The following peak detector can get the passed sig-
nal’s amplitude, which will be shown in the X-Y mode of os-
cilloscope.
If we fix the LO frequency, then we must adjust the cen-
tral frequency of FIR filter adaptively to properly detect all
the frequency components of the signal under test. The adap-
tive central frequency must satisfy (6).
It seems that the IF filter with adaptive central frequency
is not practical from the viewpoints of cost, accuracy, and
speed. In contrast, keeping the central frequency of filter
fixed, and linearly (or logarithmically) sweeping the LO fre-
quency, we have the following relation:
f
0
= f
IF
− f
in
,(7)
Figure 21: The comparison of original and captured 100 kHz sine
wave.
Signal
input
Local
oscillator
Sweep
generator
Scope
X-axis
Y-axis
Mixer
Bandpass
filter
Peak
detector
Figure 22: The function blocks diagram of real-time sweep spec-
trum analyzer.
where the changing frequency f
in
is the possible frequency
component of the detected signal.
G R. Tsai a nd M C. Lin 11
Sine wave
1000
× (2 × 3.14)
ADC1
Mult FIR filter Envelope detect
DAC1
DAC2
Oscilloscope
XY display
Sweep generator
Sweep 1
Sweep 2Acc
width Acc 1k v4 60M Index
Frequency parameter
Sine
parameter
DDS sine wave oscillator
100
Z
−1
b
a
(ab)
z
−3
Frequency in Filter out Signal in Signal out
Figure 23: The signal processing flow of real-time sweep spectrum analyzer constructed by both Simulink and system generator.
Table 2: Analysis performance for the filters with different central frequencies.
Central frequency 1 MHz 100 kHz 1 kHz
Frequency resolution 10 kHz 1 kHz 10 Hz
Scanning range
10 kHz
∼ 1kHz∼ 10 Hz ∼
2 MHz 200 kHz 2 kHz
System clock rate 60 MHz 60 MHz 60 MHz
7.2. FPGA realization
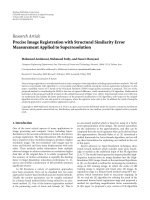
We use software-hardware codesign and cosimulation ap-
proach to design a real-time sweep spectrum analyzer core,
which can be built in a real-time electrical harmonic analyzer.
First, we use the Simulink (with Matlab) function blocks
tobuildupasweepspectrumanalyzersystem,asshownin
Figure 23.
In the same time, we integrate the Xilinx System Gener-
ator DSP Block Library [16] into the Simulink. With these
library modules, we can cosimulate the total system and
generate configuring bit for the corresponding FPGA chip
so that we can perform the hardware verification. Software
simulation can proceed by Simulink, or by ModelSim RTL-
simulation. The Xilinx ChipScope is used to execute the
hardware simulation and debugging.
Here, besides the ADC and DAC devices, we have de-
signed an all-digital spectrum analyzer, where we use digital
multiplier as the mixer, equiripple technique to implement
FIR band-pass filter. The equiripple technique can make the
attenuated band of frequency response of the filter equally
smooth and optimizes the filter design.
7.3. System performance
We can implement multiple FIR filters in the same FPGA
chip. Here, we demonstrate three different filters with central
frequencies of 1 kHz, 100 kHz, and 1 MHz, respectively.
Table 2 shows their analysis performance.
The X-spacing is 20 Hz and the Y-axis represents the
component amplitude in Figure 24. We notice that the odd
harmonic peaks like 10 Hz, 30 Hz, 50 Hz, and 70 Hz are
clearly shown. The relative amplitudes ratios are the same as
the expected by FFT calculation.
To verify the analysis resolution in the highest detectable
frequency of 2 kHz for the filter with central frequency of
1 kHz, we input an AM signal with carrier frequency of 2 kHz
and modulation frequency of 20 Hz. Figure 25 shows the de-
tected spectrum.
In Figure 25, the central frequency is 2000 Hz, the left fre-
quency is difference frequency of 1980 Hz, and the right fre-
quency is sum f requency of 2020 Hz. The X-spacing is 20 Hz.
We can easily di fferentiate between different frequency com-
ponents with resolution less than 20 Hz.
The proposed digital IP can analyze the frequency span
ranges from 10Hz to 2 MHz. It can be flexibly utilized for
FPGA-based real-time digital signal processing applications,
such as visualized signal analysis, noise level monitoring, test
and measurement of music studio, voice noise process, voice
instruction interpreter, voice reading, and hearing aid design.
8. FLEXIBLY RECONFIGURABLE SDI SYSTEM DESIGN
The configuration of FPGA can be performed by either an
on-line or an off-line process [17–19]. The dynamically re-
configurable SDI system is shown in the Figure 1. For the on-
line process, we need a PC (personal computer) to connect
with the instument for d ata exchange and on-line reconfig-
uring. The prestored configuration bitstream file for speci-
fied function can be used to reconfigure the FPGA via the
controlling CPLD (complex programmable logic device). Af-
ter powering up, the system will behave as a new instrument.
The PC platform is able to perform the advanced analysis
and 3D display of the data outputed from the instrument.
12 EURASIP Journal on Applied Signal Processing
Waveform
display
Backlight
intensity
high
Graticule
grid
XY Display
Ch1 vs Ch2
Color
palette
normal
Off (Y)
Ref1 (X)
versus
Ch2 (Y)
Ch1 (X)
versus
Tri gg ere d
XY
Off (YT)
XY display
Tek r un Tr ig ger ed
Figure 24: Analyzed spectrum of input square sig nal with period of 10 Hz.
Waveform
display
Backlight
intensity
high
Graticule
grid
XY Display
Ch1 vs Ch2
Color
palette
normal
Off (Y)
Ref1 (X)
versus
Ch2 (Y)
Ch1 (X)
versus
Tri gg ere d
XY
Off (YT)
XY display
Tek r un Tr ig ger ed
Figure 25: Detected spectrum of AM signal with carrier frequency of 2 kHz and modulation frequency of 20 Hz.
In another exchange way, the PC can also send more so-
phisticated excitation signals to the instrument for more
specific applications. We can use LabVIEW programs or C
codes to achieve these. For the off-line process, the function-
predefined configuring bitstream files are stored in different
EPROMs (flash). We can use the function selection switch to
order CPLD to send different CE (chip enable) signals to the
selected configuring-EPROM (flash). When powered up, the
instrument will be re-configured to work with new function.
Increasing or replacing different configuring EPROM (flash),
we can add new functions to the proposed SDI system with-
out changing or redesigning the system hardware.
9. CONCLUSIONS
The development t rend of measurement and test technology
is transferred from functionality-defined-by-manufacturer
into functionality-defined-by-user. The ability of being
G R. Tsai a nd M C. Lin 13
PC
platform
Function
selection
switch
reconfiguring
On-line
CPLD
Data
exchange
SDI
FPGA
Off-line
reconfiguring
EPROM
(flash)
F#1
EPROM
(flash)
F#2
EPROM
(flash)
F#n
CE1 CE2 CEn
Figure 26: Flexibly reconfigurable SDI system.
reconfigurable, reusable, flexible, and rapidly prototyped
will be the key to success in measurement and test mar ket.
This proposed FPGA-based reconfigurable instrument really
meets the evolution trend. Once you have derived a mea-
surement algorithm, you can easily build up a specialized
instrument by SDI approach, such as an LCR (inductance-
capacitance-resistance) meter, or biomedical monitor, and so
forth.
ACKNOWLEDGMENT
This work was supported by National Science Council (NSC-
93-2215-E-168–004), Taiwan
REFERENCES
[1] Xilinx Incorporation, “The programmable logic data book,”
2002.
[2] M. Cummings and S. Haruyama, “FPGA in the software ra-
dio,” IEEE Communications Magazine, vol. 37, no. 2, pp. 108–
112, 1999.
[3] G R. Tsai, M C. Lin, G S. Sun, and Y S. Lin, “Single chip
FPGA-based reconfigurable instruments,” in Proceedings of In-
ternat ional Conference on Reconfigurable Computing and FP-
GAs (ReConFig ’04), Colima, Mexico, September 2004.
[4] S. A. Dyer, Survey of Instrumentation and Measurement,John
Wiley & Sons, New York, NY, USA, 2001.
[5] J W. Hsieh, G R. Tsai, and M C. Lin, “Using FPGA to imple-
ment a n-channel arbitrary wave form generator with various
add-on functions,” in Proceedings of 2nd IEEE International
Conference on Field-Programmable Technology (FPT ’03),pp.
296–298, University of Tokyo, Tokyo, Japan, December 2003.
[6] G R. Tsai, M C. Lin, W Z. Tung, K C. Chuang, and S
Y. Chan, “Wide-band and precisely measurement method of
phase detector based on FPGA with embedded processor,” in
Proceedings of International Conference on Informatics, Cyber-
netics and Systems (ICICS ’03), I-SHOU University, Kaohsi-
ung, Taiwan, December 2003.
[7] G R. Tsai and M C. Lin, “High speed signal sampler by
multiple-path algorithm,” in Proceedings of IEEE Region 10
Conference ( TENCON ’04), vol. 1, pp. 29–31, Chiang Mai,
Thailand, November 2004.
[8] G R. Tsai and M C. Lin, “Implementation of a real-time har-
monic analyzer core by a single FPGA chip,” in Proceedings of
25th Symposium on Electrical Power Engineering, Tainan, Tai-
wan, November 2004.
[9] J. Tierney, C. Rader, and B. Gold, “A digital frequency synthe-
sizer,” IEEE Transactions on Audio and Electroacoustics, vol. 19,
no. 1, pp. 48–57, 1971.
[10] C. Dick and F. J. Harris, “Configurable logic for digital com-
munications: some signal processing perspectives,” IEEE Com-
munications Magazine, vol. 37, no. 8, pp. 107–111, 1999.
[11]J.Vankka,M.Waltari,M.Kosunen,andK.A.I.Halonen,
“A direct digital synthesizer with an on-chip D/A-converter,”
IEEE Journal of Solid-State Circuits, vol. 33, no. 2, pp. 218–237,
1998.
[12] W. C. Lindsey and C. M. Chie , “A survey of digital phase-
locked loops,” Proceedings of the IEEE, vol. 69, no. 4, pp. 410–
431, 1981.
[13] R. E. Best, Phase-Locked Loops: Design, Simulation, and Ap-
plications, McGraw-Hill, New York, NY, USA, 5th edition,
2003.
[14] T. Watanabe and S. Yamauchi, “An all-digital PLL for fre-
quency multiplication by 4 to 1022 with seven-cycle lock
time,” IEEE Journal of Solid-State Circuits,vol.38,no.2,pp.
198–204, 2003.
[15] N. Kularatna, Modern Electronic Test and Measuring Instru-
ments, IEE, London, UK, 1996.
[16] Xilinx System Generator v6.2 User Guide, 2004.
[17] Xilinx, “The Low-Cost, Efficient Serial Configuration of Spar-
tan FPGAs,” XAPP098, 1998.
[18] Xilinx, “Configuring Spartan-II FPGAs from Parallel EPR-
OMs,” XAPP178, 1999.
[19] Xilinx, “Data Generation and Configuration for Spartan Series
FPGAs,” XAPP126, 2003.
14 EURASIP Journal on Applied Signal Processing
Guo-Ruey Tsai was born in Tainan, Taiwan,
in 1953. He received the B.S. and M.S. de-
grees in electronics engineering from the
National Chiao Tung University, Taiwan, in
1975 and 1977, respectively. Since 1993, he
hasbeenaFacultyMemberatKunShan
University, Taiwan, where he is cur rently an
Associate Professor in the Department of
Electronics Engineering. His research inter-
ests are in embedded processor architecture,
parallel processing algorithms, and FPGA-based instrumentation
and measurement system design.
Min-Chuan Lin was born in Chang-Hua,
Taiwan, in 1956. He received the B.S. de-
gree from the National Taiwan University,
Taiwan, in 1979, and the M.S. and Ph.D.
degrees in electro-optical engineering from
the National Chiao Tung University, Tai-
wan, in 1987 and 1992, respectively. Since
1993, he has been a Faculty Member at Kun
Shan University, Taiwan, where he is cur-
rently an Associate Professor in the Depar t -
ment of Electronics Engineering. His research interests include
FPGA-based reconfigurable system design and optical fiber trans-
mission.