Báo cáo hóa học: "Research Article Modeling of Electrocardiogram Signals Using Predefined Signature and Envelope Vector Sets" pot
Bạn đang xem bản rút gọn của tài liệu. Xem và tải ngay bản đầy đủ của tài liệu tại đây (2.25 MB, 12 trang )
Hindawi Publishing Corporation
EURASIP Journal on Advances in Signal Processing
Volume 2007, Article ID 12071, 12 pages
doi:10.1155/2007/12071
Research Article
Modeling of Electrocardiogram Signals Using Predefined
Signature and Envelope Vector Sets
Hakan G
¨
urkan,
1
¨
Umit G
¨
uz,
1, 2
and B. Sıddık Yarman
3, 4
1
Department of Electronics Engineering, Engineering Faculty, IS¸IK University, Kumbaba Mevkii, 34980 Sile, Istanbul, Turkey
2
Speech Technology and Research (STAR) Laboratory, Information and Computing Sciences Division,
SRI International, 333 Ravenswood Avenue, Menlo Park, CA 94025, USA
3
Department of Electrical-Electronics Engineering, College of Enginee ring, Istanbul University, 34230 Avcılar, Istanbul, Turkey
4
Department of Physical Electronics, Graduate School of Science and Technology, Tokyo Institute of Technology,
Ookayama Campus, 2-12-1 Ookayama, Meguro-Ku 152-8552, Tokyo, Japan
Received 28 April 2006; Accepted 24 November 2006
Recommended by Maurice Cohen
A novel method is proposed to model ECG signals by means of “predefined signature and envelope vector sets (PSEVS).” On a
frame basis, an ECG sig nal is reconstructed by multiplying three model parameters, namely, predefined signature vector (PSV)
R
,”
“predefined envelope vector (PEV)
K
,” and frame-scaling coefficient (FSC). All the PSVs and PEVs are labeled and stored in their
respective sets to describe the signal in the reconstruction process. In this case, an ECG signal frame is modeled by means of the
members of these sets labeled with indices R and K and the frame-scaling coefficient, in the least mean square sense. The proposed
method is assessed through the use of percentage root-mean-square difference (PRD) and visual inspection measures. Assessment
results reveal that the proposed method provides significant data compression ratio (CR) with low-level PRD values while pre-
serving diagnostic information. This fact significantly reduces the bandwidth of communication in telediagnosis operations.
Copyright © 2007 Hakan G
¨
urkan et al. This is an open access article distributed under the Creative Commons Attribution License,
which permits unrestricted use, distribution, and reproduction in any medium, provided the original work is properly cited.
1. INTRODUCTION
An electrocardiogram (ECG) signal which is a graphical dis-
play of the electrical activity of the heart is an essential bio-
logical signal for the monitoring and diagnosis of heart dis-
eases. ECG signals which are recorded with digital equipment
are most widely used in applications such as monitoring,
cardiac diagnosis, event analysis, real-time transmission over
telephone networks, patient databases, or long-term record-
ing. The amount of ECG data grows depending upon sam-
pling rate, sampling precision, number of lead, and recording
time. Obviously, continuous generation of huge amount of
ECG data requires high storage capacity and also wide trans-
mission band for the remote monitoring activities. While re-
taining al l clinically significant features including P-waves,
QRS complexes, and T-waves, compression of the ECG sig-
nals is essential in the biomedical engineering [1–3].
Various methods have been developed for modeling and
compression of ECG signals during the last thirty years [2, 3].
These methods can be classified into the following three
categories: direct time-domain techniques [2–8]attemptto
reduce redundancy in the actual signal samples. Examples
of this method include amplitude zone time epoch coding
(AZTEC), the coordinate reduction time encoding system
(CORTES), FAN and SAPA techniques, SAIES, mean-shape
vector quantization method, gain-shape vector quantization
method, and so forth. Transform-domain techniques [9–15 ]
generate a coefficient sequence that reduces the amount of
data needed to represent the original signal, and then inverse
transformation is applied in order to reconstruct orig inal sig-
nal with acceptable error. In this technique, discrete cosine
transform (DCT), Karhunen-Loeve transform (KLT), sin-
gular value decomposition (SVD), wavelet transform (WT),
and so forth have been employed for ECG compression and
modeling. Parametric extraction methods [16]suchaspeak-
peaking methods, linear prediction methods, neural network
methods generate a set of parameters which is extracted from
the original signal. These different modeling or compression
methods yield different results, with regard to compression
ratio and reconstruction error.
In the literature, [3] presented an ECG compressor which
employs the zero-mean ECG segments and their associated
2 EURASIP Journal on Advances in Signal Processing
mean values that are coded by vector and scalar quantization,
respectively. In [5], an ECG signal compression technique us-
ing overlapped and linearly shifted codevectors is presented.
Beat-based ECG compression method which exploits the re-
dundancy among adjacent heartbeats and adjacent samples
of the original ECG signals by using gain-shape vector quan-
tization method is published in [6]. In [7], the ECG compres-
sion method is described for signal-dependent frames us-
ing matching pursuit algorithm. An algorithm based on ap-
proximate multiscale pattern matching, encoding segments
of an input signal using expanded and contracted versions
of patterns stored in a dictionary is proposed to compress
ECG signals in [8]. ECG compression methods are proposed
based on discrete cosine transform and singular value de-
composition in [9, 12] and in [10], respectively. Several ECG
compression techniques based on wavelet transform are pro-
posed in [11, 13–15]. An ECG compressor consists of beat
codebook, short and long predictors, and an adaptive resid-
ual quantizer is presented in [16].
In our previous work [17, 18], speech signals were mod-
eled by using predefined signature and envelope functions
sets. In this work, the modeling method introduced in [18]is
applied to represent ECG signals. Thus, in the reconstruction
of ECG signal, while preserving diagnostic information; high
compression ratios (CR) with acceptable percentage root-
mean-square difference (PRD) levels are obtained.
In the following, first the proposed ECG modeling
method is summarized. Then, formations of the predefined
signature and envelope sets (PSEVS) are detailed (Section 2).
In Section 3, an algorithm which generates the predefined
signature and envelope sets and the reconstruction algorithm
of the ECG signals are given. Section 4 is devoted to the test
results w h ere the performance of the proposed method is
compared with those of conventional methods. Section 5 is
spared for discussions and conclusion.
2. A MATHEMATICAL METHOD TO MODEL
ECG SIGNALS
2.1. Main statement
For any time frame “i,” the digitized ECG signal which is des-
ignated by vector X
i
can be expressed as
X
i
∼
=
C
i
α
K
ϕ
R
,(1)
where K
∈{1, 2, , N
E
}, R ∈{1,2, , N
S
}; K, R, N
E
,
and, N
S
are integers. C
i
is a real constant, ϕ
T
R
=
[ϕ
1
, ϕ
2
, ϕ
3
, , ϕ
LF
] is a row vector. The vector C
i
ϕ
R
carries
almost maximum energy of X
i
in the LMS sense. In other
words, C
i
ϕ
R
is the best approximation of X
i
with one term
that minimizes the sum of square error point by point, over
the frame under consideration. The (L
F
× L
F
) diagonal ma-
trix α
K
= diag
α
i1
α
i2
α
i3
··· α
iL
F
acts as an envelope
term on the quantity C
i
ϕ
R
, which may satisfy the equality of
X
i
= C
i
α
K
ϕ
R
or reduce the error defined on the difference
[X
i
− C
i
α
K
ϕ
R
] in the least mean-square (LMS) sense. Thus,
it matches the envelope of C
i
ϕ
R
to the original ECG frame
vector X
i
. The integer L
F
designates the total number of ele-
ments in a frame “i.”
Therefore, we introduce the following definitions.
Definition 1. The vector ϕ
R
is cal led the predefined signature
vector (PSV) since it carries almost maximum energy of the
ECG frame vector X
i
with a constant C
i
.
Definition 2. The diagonal matrix α
K
is called the predefined
envelope matrix (PEM) since it matches the envelope of C
i
ϕ
R
to the original ECG frame vector X
i
.
Definition 3. The real constant C
i
is called the frame scaling
coefficient (FSC).
2.2. Verification of the main statement
A discrete ECG signal x(n)canbewrittenas
x( n)
=
N
i=1
x
i
δ
i
(n − i). (2a)
In this equation, δ
i
(n) represents the unit sample; x
i
desig-
nates the amplitude of the sequence x(n)oflengthN. x(n)
can also be given employing the vector/matrix notation,
X
T
=
x(1) x(2) ··· x(N)
=
x
1
x
2
··· x
N
.
(2b)
In this representation, X is called the main frame vector and
it is divided into frames with equal lengths for example, 8,
16, or 32 samples, and so forth. In this case, the frame matrix
that is represented by M
F
is obtained by means of the frame
vectors,
M
F
=
X
1
X
2
··· X
N
F
,(3)
where
X
i
=
x
(i−1)L
F
+1
x
(i−1)L
F
+2
··· x
iL
F
T
, i = 1, 2, , N
F
.
(4)
In this equation, N
F
= N/L
F
designates the total number of
frames in X. It can be shown that each frame vector X
i
can be
spanned to a vector space formed by the orthonormal vectors
{V
ki
; k = 1, 2, 3, , L
F
}, such that
X
i
=
L
F
k=1
c
k
V
ki
, c
k
= X
T
i
V
ki
. (5)
V
ki
are determined by minimizing the expected value of the
error vector ε
= X
i
−
L
F
k=1
c
k
V
ki
with respect to V
ki
in the
LMS sense. Eventually, V
ki
arecomputedastheeigenvectors
of the autocorrelation matrix R
i
of the frame sequence X
i
and
it is given by
R
i
=
⎡
⎢
⎢
⎢
⎢
⎢
⎢
⎣
r
i
(1) r
i
(2) r
i
(3) ··· r
i
L
F
r
i
(2) r
i
(1) r
i
(2) ··· r
i
L
F
− 1
r
i
(3) r
i
(2) r
i
(1) ··· r
i
L
F
− 2
.
.
.
.
.
.
.
.
.
.
.
.
.
.
.
r
i
L
F
r
i
L
F
− 1
r
i
L
F
− 2
···
r
i
(1)
⎤
⎥
⎥
⎥
⎥
⎥
⎥
⎦
,
(6)
Hakan G
¨
urkan et al. 3
0.4
0.2
0
0.2
0.4
Amplitude
0 5 10 15 20
Sample
0.4
0.2
0
0.2
0.4
Amplitude
0 5 10 15 20
Sample
0.4
0.2
0
0.2
0.4
Amplitude
0 5 10 15 20
Sample
0.4
0.2
0
0.2
0.4
Amplitude
0 5 10 15 20
Sample
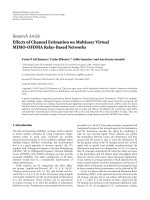
Figure 1: Some selected eigenvectors which exhibit similar patterns for L
F
= 16.
where
r
i
(d +1)=
1
L
F
[i
·L
F
−d]
j=[(i−1)·L
F
+1]
x
j
x
j+d
, d = 0, 1, 2, , L
F
− 1.
(7)
It should be noted that R
i
is a positive semidefinite, real sym-
metrical, and toeplitz matrix. The above-mentioned LMS
process results in the following eigenvalue problem:
R
i
V
ki
= λ
ki
V
ki
, k = 1, 2, , L
F
. (8)
Obviously, λ
ki
and V
ki
are the eigenvalues and the eigenvec-
tors of the problem under consideration. It is well known that
the eigenvalues of the R
i
are also real and nonnegative. More-
over, the eigenvectors V
ki
are all orthonormal.
In (5), V
ki
can be streamed in accordance with the de-
scending order of eigenvalues such that (λ
1i
≥ λ
2i
≥ ··· ≥
λ
L
F
i
). In this case in (5), the first eigenvector V
1i
that has the
highest energy associated with highest eigenvalue λ
1i
repre-
sents the directions of greatest variations of the signal. There-
fore, V
1i
is called the major signature vector. In this regard, it
maybesuitabletoapproximate(5) with only first term as
X
i
∼
=
C
1
V
1i
. (9)
In this case, the frame length L
F
must be selected in such a
way that almost maximum energy of X
i
is captured in (9).
The a pproximation (
∼
=
)givenby(9)canbeconvertedto
an equality (
=) by means of an “envelope diagonal matrix
A
i
” for each frame. Thus, X
i
is computed as
X
i
= C
i
A
i
V
1i
. (10)
In (10), diagonal entrees a
ir
of the matrix A
i
are determined
in terms of the entrees v
1ir
of the major signature vector V
1i
and the samples of the original ECG signal x
ir
of the frame
vector X
i
by
a
ir
=
x
ir
C
i
v
1ir
, r = 1, 2, , L
F
. (11)
In this research work, many ECG signals were examined and
thousands of frames were analyzed. It has been obser ved that
patterns obtained by plotting a
i
(n) = (a
ir
versus frame in-
dex
−n = 1,2, , L
F
)andv
i
(n) = (v
1ir
versus frame in-
dex
−n = 1,2, , L
F
) exhibit repetitive similarities. Some
of these patterns are shown in Figures 1 and 2.
Therefore, these similar patterns can be eliminated by
comparison. It was experienced that use of Pearson’s corre-
lation coefficient which is defined by
ρ
WY
=
L
i
=1
w
i
· y
i
−
L
i
=1
w
i
L
i
=1
y
i
L
L
i=1
w
2
i
−
L
i=1
w
i
2
L
·
L
i=1
y
2
i
−
L
i=1
y
i
2
L
(12)
yields satisfactory reduction in the elimination process. In
(12), W
= [
w
1
w
2
··· w
L
], Y = [
y
1
y
2
··· y
L
]des-
ignate two vectors which are subject to comparison.
4 EURASIP Journal on Advances in Signal Processing
0.5
1
1.5
2
Amplitude
0 5 10 15 20
Sample
4
2
0
2
4
6
Amplitude
0 5 10 15 20
Sample
4
2
0
2
4
Amplitude
0 5 10 15 20
Sample
6
4
2
0
2
4
Amplitude
0 5 10 15 20
Sample
0.8
1
1.2
1.4
1.6
Amplitude
0 5 10 15 20
Sample
0.5
1
1.5
2
Amplitude
0 5 10 15 20
Sample
2
1
0
1
2
Amplitude
0 5 10 15 20
Sample
1
0
1
2
3
Amplitude
0 5 10 15 20
Sample
2
0
2
4
Amplitude
0 5 10 15 20
Sample
40
20
0
20
40
Amplitude
0 5 10 15 20
Sample
0.5
1
1.5
2
Amplitude
0 5 10 15 20
Sample
0.8
0.9
1
1.1
1.2
1.3
Amplitude
0 5 10 15 20
Sample
2
0
2
4
Amplitude
0 5 10 15 20
Sample
1
0
1
2
3
Amplitude
0 5 10 15 20
Sample
20
10
0
10
20
30
Amplitude
0 5 10 15 20
Sample
0.5
1
1.5
Amplitude
0 5 10 15 20
Sample
0.5
1
1.5
2
Amplitude
0 5 10 15 20
Sample
0.5
0
0.5
1
1.5
2
Amplitude
0 5 10 15 20
Sample
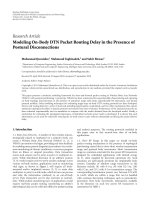
Figure 2: Some selected envelope vectors which exhibit similar patterns for L
F
= 16.
In this work, it is assumed that the two vectors are almost
identical for 0.9
≤ ρ
WY
≤ 1. Hence, similar patterns of sig-
nature and envelope vectors are eliminated accordingly.
In this work, once and for all, two types of sets were cre-
ated by using reduced envelope and signature sequences. Re-
duced signature vectors are collected under the predefined
signature set (PSS) as {ϕ
n
s
(n); n
s
= 1, 2, , N
S
}. Similarly,
reduced envelope sequences or diagonal matrices are col-
lected in the predefined envelope set (PES) as
{α
n
e
(n); n
e
=
1, 2, , N
E
}. In order to provide vision to the reader, some
Hakan G
¨
urkan et al. 5
0.15
0.2
0.25
0.3
0.35
Amplitude
01020
Sample
0.4
0.2
0
0.2
0.4
Amplitude
01020
Sample
0.4
0.2
0
0.2
0.4
Amplitude
01020
Sample
0.22
0.24
0.26
0.28
0.3
Amplitude
01020
Sample
0.1
0.2
0.3
0.4
0.5
Amplitude
01020
Sample
0.2
0.25
0.3
Amplitude
01020
Sample
0.4
0.2
0
0.2
0.4
Amplitude
01020
Sample
0.1
0.2
0.3
0.4
0.5
Amplitude
01020
Sample
0.4
0.2
0
0.2
0.4
Amplitude
01020
Sample
Figure 3: Some selected unique signature vectors in the predefined signature set for L
F
= 16.
selected unique signature and envelope vectors are shown in
Figures 3 and 4.Hence,anyECGsignalframeX
i
can be rep-
resented in terms of the multiplication of predefined enve-
lope α
K
and signature ϕ
R
vectors pulled from PSS and PES
with a constant C
i
in the least mean-square sense,
X
i
∼
=
C
i
α
K
ϕ
R
. (13)
In the following, first an algorithm is presented to gener-
ate predefined signature and envelope sets, which is essential
for the reconstruction process of the measured ECG signals.
Then, the reconstruction algorithm is introduced.
3. ALGORITHMS
The major philosophy of the proposed method to model
ECG signals is based on the generation of the PSS and PES.
Therefore, in this section first an algorithm is outlined to
generate PSS and PES (Algorithm 1) then, reconstruction
process of the ECG signals is detailed in Algorithm 2.
In this work, different values of L
F
(such as L
F
= 8, 16, 20,
24, 32, 48, 64) were selected to investigate the effect of the
frame length on the quality of the reconstructed ECG signal
by means of the PRD level. Details of this effort are given in
the subsequent section.
Once PSS and PES are generated, then any ECG sig-
nal can be reconstructed frame by frame (X
i
∼
=
C
i
α
K
ϕ
R
)as
implied by the main statement. It can be clearly seen that in
this approach, the frame i is reconstructed with three ma-
jor quantities namely, the gain factor C
i
, the index R of the
predefined signature vector ϕ
R
pulled from PSS, and the in-
dex K of the predefined envelope sequence α
K
pulled from
PES. α
K
and ϕ
R
are determined to minimize the LMS error
which is described by means of the difference between the
original frame X
i
and its model X
Ai
= C
i
E
K
S
R
.
Details of the reconstruction process are given in Algo-
rithm 2.
In the following section, simulation results of the new
ECG modeling method are presented.
4. SIMULATION RESULTS
The proposed algorithms presented in the previous section
were developed on a Mobil AMD Athlon 1.66 GHz processor.
Predefined signature (PSS) and envelope sets (PES) were gen-
erated employing the digital ECG recordings of MIT arrhyth-
mia database [19]. Using these PSS and PES, ECG signals
of ECGMAN database [20] were reconstructed. Eventually,
6 EURASIP Journal on Advances in Signal Processing
0.5
1
1.5
2
Amplitude
0 5 10 15 20
Sample
4
2
0
2
4
6
Amplitude
0 5 10 15 20
Sample
4
2
0
2
4
Amplitude
0 5 10 15 20
Sample
6
4
2
0
2
4
Amplitude
0 5 10 15 20
Sample
0.8
1
1.2
1.4
1.6
Amplitude
0 5 10 15 20
Sample
0.5
1
1.5
2
Amplitude
0 5 10 15 20
Sample
2
1
0
1
2
Amplitude
0 5 10 15 20
Sample
1
0
1
2
3
Amplitude
0 5 10 15 20
Sample
2
0
2
4
Amplitude
0 5 10 15 20
Sample
40
20
0
20
40
Amplitude
0 5 10 15 20
Sample
0.5
1
1.5
2
Amplitude
0 5 10 15 20
Sample
0.8
0.9
1
1.1
1.2
1.3
Amplitude
0 5 10 15 20
Sample
2
0
2
4
Amplitude
0 5 10 15 20
Sample
1
0
1
2
3
Amplitude
0 5 10 15 20
Sample
20
10
0
10
20
30
Amplitude
0 5 10 15 20
Sample
0.5
1
1.5
Amplitude
0 5 10 15 20
Sample
0.5
1
1.5
2
Amplitude
0 5 10 15 20
Sample
0.5
0
0.5
1
1.5
2
Amplitude
0 5 10 15 20
Sample
Figure 4: Some selected unique envelope vector in the predefined envelope set for L
F
= 16.
quality of the reconstructed signals was compared with those
of classical methods. In the evaluation process of the pro-
posed technique, compression ratios (CR) and percent root
mean square differences (PRD) between the original and the
reconstructed signals were computed [21, 22]. In this regard,
PRD is defined by
PRD
=
N
n=1
x
org
(n) − x
rec
(n)
2
N
n
=1
x
2
org
(n)
× 100, (14)
Hakan G
¨
urkan et al. 7
INPUTS
(i) Main frame vector of the ECG signal
{X(n), n = 1, 2, , N}.
(ii) L
F
: total number of samples in each frame under consideration.
COMPUTATIONAL STEPS
Step 1. Compute the total number of frames N
F
= N/L
F
.
Step 2. Divide X(n) into frames X
i
. In this case, the original ECG signal is represented by the main
frame vector.
Step 3. For each frame X
i
, compute the correlation matrix R
i
.
Step 4. For each R
i
, compute the eigenvalues λ
ki
in descending order with the corresponding
eigenvectors.
Step 5. (a) Store the eigenvector which is associated with the maximum eigenvalue; call it the
“signature vector” with the frame index i; and designate it as V
1i
.
(b) Compute the frame-scaling coefficient C
1
in the LMS sense to approximate X
i
∼
=
C
1
V
1i
.
Step 6. Repeat Steps 5(a) and 5(b) for all the frames (i
= 1, 2, , N
F
). At the end of this loop,
eigenvectors, which have maximum energy for each fr ame, will be collected.
Step 7. Compare all the collected eigenvectors obtained in Step 6 with an efficient algorithm. In this
regard, Pearsons’ correlation formula may be employed. Then, eliminate the ones which exhibit
similar patterns. Thus, generate the predefined signature set PSS
={ϕ
n
s
(n); n
s
= 1, 2, ,
N
S
} with reduced number of eigenvectors V
1i
.Here,N
S
designates the total number of ones of
kind signature patterns after the elimination.
Step 8. Compute the diagonal envelope matrix for each C
1i
V
1i
.
Step 9. Eliminate the envelope sequences which exhibit similar patterns with an efficient algorithm
as in Step 7, and construct the predefined envelope set PES
={α
n
e
(n); n
e
= 1, 2, , N
E
};
Here, N
E
denotes the total number of ones of kind unique envelope patterns.
Algorithm 1: Generation of the predefined signature and envelope sets.
where x
org
(n), x
rec
(n), and N designate original signal, recon-
structed signal, and length of the original signal, respectively.
The compression ratio (CR) is computed as follows:
CR =
b
org
b
rec
or CR(%) =
b
org
− b
rec
b
org
× 100, (15)
where b
org
and b
rec
designate the total number of bits re-
quired representing original and reconstructed signals, re-
spectively.
The MIT-BIH database contains 48 ECG record-
ings which are sampled at 360 Hz using a resolution of
12 bits/sample. On the other hand, the ECGMAN database
includes 16 different digital ECG recordings with sampling
rate of 500 Hz and 12 bits/sample resolution. In order to
make fair comparison, MIT-BIH recordings were resampled
at 500 Hz and all of the ECG recordings were normalized be-
tween −1 and +1 values.
In the generation of PSS and PES, Pearsons’ correlation
coefficient ρ was varied over the interval 0 .9
≤ ρ ≤ 0.995
for the elimination process. In the course of computations,
effect of various frame lengths L
F
was investigated. Obvi-
ously, for each frame length L
F
, one has to determine the total
number of predefined signature and envelope sets, namely,
N
S
and N
E
which in turn yield the total number of bits
b
Total
= b
C
i
+ b
R
+ b
K
required to represent the reconstructed
ECG signals. In this presentation, b
C
i
, b
R
,andb
K
designate
Table 1: Variation of total number of bits with respect to frame
length.
L
F
N
S
N
E
b
Tot al
8 15 512 6+4+9= 19
16 16 1024 6 + 4 + 10
= 20
20 32 3836 6 + 5 + 12
= 23
24 125 7740 6 + 7 + 13
= 26
32 250 14 378 6 + 8 + 14
= 28
48 779 30 395 6 + 10 + 15
= 31
64 1736 58 486 6 + 11 + 16
= 33
the least number of bits required to represent frame scaling
coefficient C
i
, and the integers N
S
and N
E
,respectively.Com-
parative results are summarized in Tabl e 1. It should be noted
that for this research work, b
C
i
= 6 bits were good enough
to code the entire frame-scaling coefficient C
i
.Forexample,
one second of orig inal ECG recording contains 500 samples
which in turn yield total number of 500
× 12 = 6000 bits/s.
Employing the new method, if the frame length L
F
= 8is
chosen, then one second of ECG recording includes about
500/8
= 62.5 frames. As it is seen from Table 1, choosing
ρ
= 0.995, Algorithm 1 results in N
S
= 15 different signa-
tures a nd N
E
= 512 different envelope patterns. Represent-
ing N
S
and N
E
with b
S
= 4andb
E
= 9 bits, respectively,
8 EURASIP Journal on Advances in Signal Processing
INPUTS
(i) ECG signal
{X(n), n = 1, 2, , N} to be modeled.
(ii) L
F
: number of samples in each frame.
(iii) N
S
and N
E
; total number of the set elements in PSS and in PES, respectively. These integers are
determined by Steps 7 and 9 of Algorithm 1,respectively.
(iv) The predefined signature set PSS
={ϕ
R
; R = 1, 2, , N
S
} created utilizing Algorithm 1.
(v) The predefined envelope set PES
={α
K
; K = 1, 2, , N
E
} created utilizing Algorithm 1.
COMPUTATIONAL STEPS
Step 1. Divide X into frames X
i
of length L
F
as in Algorithm 1. In this case, the or iginal ECG signal is
represented by the main frame Vector.
Step 2. (a) For each frame i, pull an appropriate signature vector ϕ
R
from PSS such that the distance or the
total error δ
R
=X
i
− C
R
ϕ
R
2
is minimum for all
R = 1, 2, , R, , N
S
. This step yields the index
R of the ϕ
R
. In this case, δ
R
= min X
i
− C
R
ϕ
R
2
=X
i
− C
R
ϕ
R
2
.
(b) Store the index number R that refers to ϕ
R
, in this case, X
i
≈ C
R
ϕ
R
.
Step 3. (a) Pull an appropriate envelope sequence (or diagonal envelope matrix) α
K
from PES such that the
error is further minimized for all
K = 1, 2, , K, , N
E
.Thus,δ
K
= min{X
i
− C
R
α
K
ϕ
R
2
}=
X
i
− C
R
α
K
ϕ
R
2
. This step yields the index K of the α
K
.
(b) Store the index number K that refers to α
K
. It should be noted that at the end of this step, the
best signature vector ϕ
R
and the best envelope sequence α
K
are found by appropriate selections.
Hence, the frame X
i
is best described in terms of the patterns of α
K
and ϕ
R
,thatis,X
i
≈ C
R
α
K
ϕ
R
.
Step 4. Having fixed ϕ
R
and α
K
,onecanreplaceC
R
by computing a new gain factor C
i
= (α
K
ϕ
R
)
T
X
i
/
(α
K
ϕ
R
)
T
(α
K
ϕ
R
) to further minimize the distance between the vectors X
i
and C
R
α
K
ϕ
R
in the LMS
sense. In this case, the global minimum of the error is obtained and it is given by δ
Global
=X
i
−
C
R
α
K
ϕ
R
2
. At this step, the frame sequence is approximated by X
Ai
= C
R
α
K
ϕ
R
.
Step 5. Repeat the above steps for each frame to reconstruct the ECG signal.
Algorithm 2: Reconstruction of ECG signals by using PSEVS.
Table 2: CR and average PRD associated with PSEVS for different
frame lengths.
L
F
CR CR (%) Average PRD (%)
85.05 80.22.250
16 9.60 89.58 3.504
20 10.44 90.42 4.546
24 11.08 91.00 5.334
32 13.72 92.71 5.939
48 18.58 94.62 8.033
64 23.28 95.71 9.359
total number of bits required to represent one ECG frame
is b
Total
= 6+4+9 = 19 bits which in turn yield a com-
pression ratio of CR
= 8 × 12/19 = 5.05. On the other
hand, if L
F
= 64 is selected, then Algorithm 1 reveals that
N
S
= 1736 and N
E
= 58486 which corresponds to 33 bits
per frame representation. In this case, compression ratio is
CR
= 64 × 12/33 = 23.28.
Once PSS and PES were generated, then 16 ECG signals
given by ECGMAN database were reconstructed for quality
assessment of the proposed technique. Table 2 illustrates the
coding performance and the average P RD of the proposed
method in terms of CR, CR(%), and PRD for different frame
lengths.
AsitcanbeseenfromTables1 and 2, the proposed
method exhibits relative compression ratios in the range of
80.2%–95.71% with average PRD varying between 2.250%
and 9.359%.
It should be noted that in the existing literature, accept-
able values of PRD are reported as less than 10% [21]. Thus,
Table 2 indicates that the proposed method results in high
compression ratio with very good PRD levels. In Figure 5,
various assessment means are given to evaluate the proposed
method.
For the sake of visual inspection, for the frame length
L
F
= 16 cases, various original ECG signals selected from
ECGMAN database and the signals constructed via new
method are depicted in Figure 6.
Figure 7 shows the PRD variations of the reconstructed
signals given in Figure 6.AsitisseenfromFigure 7 that av-
erage PRD level is about 3.5% which corresponds to a high
quality of reconstruction with high compression rate of 9.6.
On the other hand, the average reconstruction time of the
proposed method is approximately 1 second.
In order to carry out fair evaluations among the existing
and our newly proposed techniques, first the conventional
methods of [2–16] were programmed in our laboratory, then
using the same ECG signals given by the MIT-BIH arrhyth-
mia and ECGMAN database, these methods and proposed
method were evaluated. Eventually, compression ratios and
Hakan G
¨
urkan et al. 9
2
2.5
3
3.5
4
4.5
5
5.5
6
6.5
7
7.5
8
8.5
9
9.5
10
Average PRD
80 82 84 86 88 90 92 94 96
CR (%)
(a)
80
82
84
86
88
90
92
94
96
CR (%)
0 4 8 12 162024283236404448525660 6468
Frame length
(b)
2
2.5
3
3.5
4
4.5
5
5.5
6
6.5
7
7.5
8
8.5
9
9.5
10
Average PRD
0 4 8 12 162024283236404448525660 6468
Frame length
(c)
Figure 5: (a) Performance assessment of the new technique: varia-
tion of average PRD with respect to CR(%). (b) Performance as-
sessment of the new technique: variation of CR(%) with respect
to frame length. (c) Performance assessment of the new technique:
variation of average PRD with respect to frame length.
Table 3: Comparison of the proposed method with various ECG
compression methods.
Method CR PRD (%)
TP [2]2.05.3
AZTEC [2]10.028.1
CORTES [2]4.87.0
FAN/SAPA [2]3.04.0
MSAPA/CSAPA [3]5.03.5
SAIES [4]5.916.3
Vector quantization of wavelet coefficients [3]10.05.5
Classified vector quantization [3]8.624.5
Peak peaking (spline) with entropy encoding [3]10.014.0
ADPCM [9]6.06.9
9.64.09
Mean-shape vector quantizer [3]10.55.26
23.29.82
Predefined signature
and envelope vector
Sets (proposed
method)
9.63.504
10.44 4.
546
23.28 9.359
the percent root mean-squared errors were compared. Thus,
the comparison results in Ta ble 3 are obtained.
These results indicate that the proposed method provides
a higher compression ra tio with lower PRD values over all the
existing lossy compression methods.
5. CONCLUSIONS AND DISCUSSION
In this paper, a new method to represent ECG signals is pre-
sented. The proposed technique is based on the generation of
the predefined signature and envelope vector sets. In the pro-
posed technique, each frame of any ECG signal is described
by multiplying three major quantities, namely frame-scaling
coefficient C
i
, the frame signature vector ϕ
R
, and diagonal
envelope matrix α
K
. Signature and envelope patterns are se-
lected from the corresponding predefined signature and en-
velope vector sets that are formed by using MIT-BIH ar-
rhythmia database w hich contains much cardiac pathology.
In the reconstruction process, each ECG frame is fully iden-
tified with the frame-scaling coefficient C
i
and the indices R
and K of the predefined signature and the envelope patterns,
respectively.
The selection of the appropriate database is very impor-
tant in order to construct the PSV and PEV sets. The se-
lected database must contain a large set of ECG beats and
many examples of much cardiac pathology. Therefore, in
this work, the MIT-BIH arrhythmia database which has the
desired properties was used in order to construct the PSV
and PEV sets. On the contrary, ECGMAN database which
contains 16 ECG signals is a small database. If ECGMAN
database was used for constructing the PSV and PEV sets, the
10 EURASIP Journal on Advances in Signal Processing
1
0.5
0
0.5
Normalized
amplitude
0 200 400 600 800 1000 1200 1400 1600 1800 2000
Original signal-ECGMAN1
1
0.5
0
0.5
Normalized
amplitude
0 200 400 600 800 1000 1200 1400 1600 1800 2000
Reconstructed signal-ECGMAN1
(a) PRD = 3.2473, CR = 9.6, reconstruction time: 1.061 seconds.
1
0.5
0
0.5
1
Normalized
amplitude
0 200 400 600 800 1000 1200 1400 1600 1800 2000
Original signal-ECGMAN2
1
0.5
0
0.5
1
Normalized
amplitude
0 200 400 600 800 1000 1200 1400 1600 1800 2000
Reconstructed signal-ECGMAN2
(b) PRD = 4.1351, CR = 9.6, reconstruction time: 1.072 seconds.
1
0.5
0
0.5
1
Normalized
amplitude
0 200 400 600 800 1000 1200 1400 1600 1800 2000
Original signal-ECGMAN8
1
0.5
0
0.5
1
Normalized
amplitude
0 200 400 600 800 1000 1200 1400 1600 1800 2000
Reconstructed signal-ECGMAN8
(c) PRD = 3.2954, CR = 9.6, reconstruction time: 1.072 seconds.
1
0.5
0
0.5
1
Normalized
amplitude
0 200 400 600 800 1000 1200 1400 1600 1800 2000
Original signal-ECGMAN15
1
0.5
0
0.5
1
Normalized
amplitude
0 200 400 600 800 1000 1200 1400 1600 1800 2000
Reconstructed signal-ECGMAN15
(d) PRD = 3.7808, CR = 9.6, reconstruction time: 0.952 seconds.
Figure 6: Original and reconstructed ECG signals for L
F
= 16.
0
0.5
1
1.5
2
2.5
3
3.5
4
4.5
5
PRD
ECG1
ECG2
ECG3
ECG4
ECG5
ECG6
ECG7
ECG8
ECG9
ECG10
ECG11
ECG12
ECG13
ECG14
ECG15
ECG16
ECG signals
Average PRD: 3.504
Figure 7: PRD values associated with ECG sig nals in the ECGMAN
database for L
F
= 16.
obtained performance would be poor. Hereby, the ECGMAN
database could not be used to construct the PSV and PEV
sets.
It should b e noted that if the ECG sig nals in the MIT-BIH
arrhythmia database were used for the test signal, the perfor-
mance of our method would be better than the reported re-
sults in our paper. Because the ECG signal which is used to
test is the same as the ECG signal which is used for construct-
ing the PSV and PEV sets. In order to avoid this situation, two
different databases were used to construct these sets and test
the performance of our method.
It was briefly explained above; our training database is
MIT-BIH database which includes 48 different ECG signals.
Thetestsetwasselectedfromthedifferent domains which
are unlike the training data set. As a result, it can be con-
cluded that our method is not a lead-specific method.
While preser ving the diagnostic information, the pro-
posed method provides significant data compression rate
with low P RD values over the other available methods given
in the current literature. The main superiority of the pro-
posed method is that it does not need to employ any QRS
detection algorithm. Thus, it requires less computation time.
Hakan G
¨
urkan et al. 11
ACKNOWLEDGMENTS
The present work was supported by the Research Fund of
Istanbul University, Project no. 400/03062005, and UDP-
440/10032005.
REFERENCES
[1] D.L.HudsonandM.E.Cohen,“Intelligentanalysisofbiosig-
nals,” in Proceedings of the 27th Annual International Con-
ference of the Engineering in Medicine and Biology Socie ty
(EMBS ’05), pp. 323–326, Shanghai, China, September 2005.
[2] S. M. S. Jalaleddine, C. G. Hutchens, R. D. Strattan, and W.
A. Coberly, “ECG data compression techniques - a unified ap-
proach,” IEEE Transactions on Biomedical Engineering, vol. 37,
no. 4, pp. 329–343, 1990.
[3] J.L.C
ˆ
ardenas-Barrera and J. V. Lorenzo-Ginori, “Mean-shape
vector quantizer for ECG signal compression,” IEEE Transac-
tions on Biomedical Engineering, vol. 46, no. 1, pp. 62–70, 1999.
[4] S. M. S. Jalaleddine and C. G. Hutchens, “SAIES - a new ECG
data compression algorithm,” Journal of Clinical Enginee ring,
vol. 15, no. 1, pp. 45–51, 1990.
[5] S G. Miaou and J H. Larn, “Adaptive vector quantisation for
electrocardiogram signal compression using overlapped and
linearly shifted codevectors,” Medical and Biological Engineer-
ing and Computing, vol. 38, no. 5, pp. 547–552, 2000.
[6] C C. Sun and S C. Tai, “Beat-based ECG compression us-
ing gain-shape vector quantization,” IEEE Transactions on
Biomedical Engineering, vol. 52, no. 11, pp. 1882–1888, 2005.
[7] K. S kretting, K. Engan, and J. H. Husøy, “ECG compres-
sion using signal dependent frames and matching pursuit,”
in Proceedings of IEEE International Conference on Acoustics,
Speech and Signal Processing (ICASSP ’05), vol. 4, pp. 585–588,
Philadelphia, Pa, USA, March 2005.
[8] E.B.deLimaFilho,E.A.B.daSilva,M.B.deCarvalho,W.
S. da Silva J
´
unior, and J. Koiller, “Electrocardiographic signal
compression using multiscale recurrent patterns,” IEEE Trans-
actions on Circuits and Systems I: Regular Papers, vol. 52, no. 12,
pp. 2739–2753, 2005.
[9] H. Lee and K. M. Buckley, “ECG data compression using cut
and align beats approach and 2-D transforms,” IEEE Transac-
tions on Biomedical Engineering, vol. 46, no. 5, pp. 556–564,
1999.
[10] J J. Wei, C J. Chang, N K. Chou, and G J. Jan, “ECG data
compression using truncated singular value decomposition,”
IEEE Transactions on Information Technology in Biomedicine,
vol. 5, no. 4, pp. 290–299, 2001.
[11] S G. Miaou, H L. Yen, and C L. Lin, “Wavelet-based
ECG compression using dynamic vector quantization with
tree codevectors in single codebook,” IEEE Transactions on
Biomedical Engineering, vol. 49, no. 7, pp. 671–680, 2002.
[12] H H. Chou, Y J. Chen, Y C. Shiau, and T S. Kuo, “An effec-
tive and efficient compression algorithm for ECG signals with
irregular periods,” IEEE Transactions on Biomedical Engineer-
ing, vol. 53, no. 6, pp. 1198–1205, 2006.
[13] S C. Tai, C C. Sun, and W C. Yan, “A 2-D ECG compression
method based on wavelet transform and modified SPIHT,”
IEEE Transactions on Biomedical Engineering,vol.52,no.6,pp.
999–1008, 2005.
[14] S G. Miaou and S N. Chao, “Wavelet-based lossy-to-lossless
ECG compression in a unified vector quantization frame-
work,” IEEE Transactions on Biomedical Engineering, vol. 52,
no. 3, pp. 539–543, 2005.
[15] B. S. Kim, S. K. Yoo, and M. H. Lee, “Wavelet-based low-
delay ECG compression algorithm for continuous ECG trans-
mission,” IEEE Transactions on Information Technology in
Biomedicine, vol. 10, no. 1, pp. 77–83, 2006.
[16] Y. Zigel, A. Cohen, and A. Katz, “ECG signal compression
using analysis by synthesis coding,” IEEE Transactions on
Biomedical Engineering, vol. 47, no. 10, pp. 1308–1316, 2000.
[17]
¨
U. G
¨
uz, H. G
¨
urkan, and B. S. Yarman, “A novel method to
represent the speech signals by using language and speaker in-
dependent predefined functions sets,” in Proceedings of IEEE
International Symposium on Circuits and Systems (ISCAS ’04),
vol. 3, pp. 457–460, Vancouver, BC, Canada, May 2004.
[18] B. S. Yarman,
¨
U. G
¨
uz, and H. G
¨
urkan, “On the compara-
tive results of “SYMPES: a new method of speech modeling”,”
AEU - International Journal of Electronics and Communica-
tions, vol. 60, no. 6, pp. 421–427, 2006.
[19] G. B. Moody, The MIT-BIH Arrhythmia D atabase CD-ROM,
Harvard-MIT Division of Health Sciences and Technology,
Cambridge, Mass, USA, 2nd edition, 1992.
[20] A Karas¸, Elektriksel
˙
Is¸aretlerin Temel Tanım Fonksiyonlarıyla
Karakterizasyonu, Ph.D. thesis, Department of Electrical and
Electronic Engineering, Institute of Science, Istanbul Univer-
sity, Istanbul, Turkey, 1997.
[21] Y. Zigel, A. Cohen, and A. Katz, “The weighted diagnostic dis-
tortion (WDD) measure for ECG signal compression,” IEEE
Transactions on Biomedical Engineering, vol. 47, no. 11, pp.
1422–1430, 2000.
[22] M. Blanco-Velasco, F. Cruz-Roldan, J. I. Godino-Llorente, J.
Blanco-Velasco, C. Armiens-Aparicio, and F. L
´
opez-Ferreras,
“On the use of PRD and CR parameters for ECG compres-
sion,” Medical Engineering and Physics, vol. 27, no. 9, pp. 798–
802, 2005.
Hakan G
¨
urkan received the B.S., M.S., and
Ph.D. degrees in electronics and communi-
cation engineering from the Istanbul Tech-
nical University (ITU), Istanbul, Turkey, in
1994, 1998, and 2005, respectively. He was
a Research Assistant in the Department of
Electronics Engineering, Engineering Fac-
ulty, Is¸ık University, Istanbul, Turkey. He
has been an Instructor in the Department of
Electronics Engineering, Engineering Fac-
ulty, Is¸ık University, Istanbul, Turkey, since 2005. His current in-
terests are in digital signal processing, mainly with biomedical and
speech signals modeling, representation, and compression.
¨
Umit G
¨
uz graduated from Istanbul
Pertevniyal High School in 1988 and The
Department of Computer Programming,
Yıldız Technical University, Istanbul, Tur-
key, in 1990. He received the B.S. degree
with high honors from the Department
of Electronics Engineering, College of
Engineering, Istanbul University, Turkey, in
1994. He received M.S. and Ph.D. degrees
in electronics engineer ing with high honors
from the Institute of Science, Istanbul University in 1997 and 2002,
respectively. From 1995 to 1998, he was a Research and Teach-
ing Assistant in the Department of Electronics Engineering, Istan-
bul University. He has been a Faculty Member in the Department
of Electronics Engineering, Engineering Faculty, Is¸ık University,
12 EURASIP Journal on Advances in Signal Processing
Istanbul, Turkey since 1998. He was awarded a Postdoctoral Re-
search Fellowship by the Scientific and Technological Research
Council of Turkey in 2006. He was accepted as an International Fel-
low by the Stanford Research Institute (SRI) International, Speech
Technology and Research (STAR) Laboratory in 2006. He was
awarded a J. William Fulbright Postdoctoral Research Fellowship
in 2007. He was accepted as an International Fellow by the Inter-
national Computer Science Institute (ICSI) Speech Group, Uni-
versity of California, Berkeley, in 2007. His research interest cov-
ers speech processing, modeling, coding, compression, automatic
speech recognition, natural language processing, and biomedical
signal processing.
B. Sıddık Yarman received the B.S. de-
gree in electrical engineering from Istanbul
Technical University, Turkey (1974); M.E
E.E. degree from Electro-Math Stevens In-
stitute of Technology Hoboken, NJ, 1977;
Ph.D. degree in electrical engineering and
mathematics from Cornell University, Itha-
ca, NY, 1981; Technical staff,Microwave
Technology Centre, RCA David S arnoff Re-
search Center, Princeton, NJ (1982–1984);
Professor, Alexander von Humboldt Fellow, Ruhr University,
Bochum, Germany (1987–1994); Founding Director, STFA De-
fense Electronic Corporation, Turkey (1986–1996); Professor,
Chair, Defense Electronics, Director, Technology and Science
School, Istanbul University (1990–1996); Founding President of
Is¸ık University, Istanbul, Turkey (1996–2004); Chief Advisor to
Prime Ministry Office, Turkey (1996–2000); Young Turkish Scien-
tist Award (1986) and Technology Award (1987) of National Re-
search Council of Turkey; International Man of the Year in Sci-
ence and Technology, Cambridge Biography Center of UK (1998);
Member of the Academy of Science of New York (1994); IEEE Fel-
low. Author of more than 100 papers, 4 US patents. Fields of in-
terests include design of matching networks and microwave ampli-
fiers, mathematical models for speech and biomedical signals. He
has been back to Istanbul University since October 2004 and he
is spending his sabbatical year of 2006–2007 at Tokyo Institute of
Technology, Tokyo, Japan.