Báo cáo hóa học: " Research Article A New Method to Represent Speech Signals Via Predefined Signature and Envelope Sequences" pptx
Bạn đang xem bản rút gọn của tài liệu. Xem và tải ngay bản đầy đủ của tài liệu tại đây (2.22 MB, 17 trang )
Hindawi Publishing Corporation
EURASIP Journal on Advances in Signal Processing
Volume 2007, Article ID 56382, 17 pages
doi:10.1155/2007/56382
Research Article
A New Method to Represent Speech Signals Via Predefined
Signature and Envelope Sequences
¨
Umit G
¨
uz,
1, 2
Hakan G
¨
urkan,
1
and Binboga Sıddık Yarman
3, 4
1
Department of Electronics Engineering, Engineering Faculty, Is¸ık University, Kumbaba Mevkii, S¸ile, 34980 Istanbul, Turkey
2
SRI-International, Speech Technology and Research (STAR) Laboratory, 333 Ravenswood Avenue, Menlo Park, CA 94025, USA
3
Department of Electrical-Electronics Engineering, College of Enginee ring, Istanbul University, Avcılar, 34230 Istanbul, Turkey
4
Department of Physical Electronics, Graduate School of Science and Technology, Tokyo Institute of Technology,
(Ookayama Campus) 2-12-1 Ookayama, Meguro-ku, Tokyo 152-8552, Japan
Received 3 June 2005; Revised 28 March 2006; Accepted 30 April 2006
Recommended by Kostas Berberidis
A novel systematic procedure referred to as “SYMPES” to model speech signals is introduced. The structure of SYMPES is based
on the creation of the so-called predefined “signature S
={S
R
(n)} and envelope E ={E
K
(n)}” sets. These sets are speaker and
language independent. Once the speech signals are divided into frames with selected lengths, then each frame sequence X
i
(n)is
reconstructed by means of the mathematical form X
i
(n) = C
i
E
K
(n)S
R
(n). In this representation, C
i
is called the gain factor, S
R
(n)
and E
K
(n) are properly assigned from the predefined signature and envelope sets, respectively. Examples are given to exhibit the
implementation of SYMPES. It is shown that for the same compression ratio or better, SYMPES yields considerably better speech
quality over the commercially available coders such as G.726 (ADPCM) at 16 kbps and voice excited LPC-10E (FS1015) at 2.4kbps.
Copyright © 2007
¨
Umit G
¨
uz et al. This is an open access article distributed under the Creative Commons Attribution License,
which permits unrestricted use, distribution, and reproduction in any medium, provided the original work is properly cited.
1. INTRODUCTION
Transmission and storage of speech signals are widespread in
modern communications systems. The field of speech rep-
resentation or compression is dedicated to finding new and
more efficient ways to reduce transmission bandwidth or
storage area while maintaining high quality of hearing [1].
In the past, a number of new algorithms based on the
use of numerical, mathematical, statistical, and heuristic
methodologies were proposed in order to represent, code,
or compress the speech signals. For example, in the con-
struction of speech signals, linear predictive coding (LPC)
techniques such as LPC-10E (FS1015) utilize low bit rates at
2.4 kbps with acceptable hearing quality. Pulse code modula-
tion (PCM) techniques such as G.726 (ADPCM) yield much
better hearing qualit y over LPC-10E but demand higher bit
ratesof32or16kbps[1–3].
In our previous work [4–7], efficient methods to model
speech signals with low bit rates and acceptable hearing qual-
ity were introduced. In these methods, one would first exam-
ine the signals in terms of their physical features, and then
find some specific waveforms to best describe the signals,
called signature func tions. Signature functions of speech sig-
nals are obtained by u sing energy compaction property of the
principal component analysis (PCA) [8–14]. PCA also pro-
vides optimal solution via minimization of the error in the
least mean square (LMS) sense. The new method presented
in this paper significantly improves the results of [4–7]by
introducing the concept of “signal envelope” in the represen-
tation of speech signals. Thus, the new mathematical form of
the frame signal X
i
is proposed as X
i
≈ C
i
E
K
S
R
where C
i
is a
real constant called the gain factor, S
R
and E
K
are properly ex-
tracted from the so-called predefined signature set S
={S
R
}
and predefined envelope set E ={E
K
} or in short PSS and
PES, respectively. It is exhibited that PSS and PES which are
generated as the result of this work are independent of the
speaker and the language spoken. It is also worth mentioning
that if the proposed modeling technique is employed in com-
munication, it results in substantial reductions in transmis-
sion bandwidth. If it is used for digital recording, it provides
great savings in the storage area. In the following sections
theoretical aspects of the proposed modeling technique are
presented and the implementation details are discussed. Im-
plementation results are summarized. Possible applications
and directions for future research are included in the conclu-
sion. It is noted that the initial results of the new method were
2 EURASIP Journal on Advances in Signal Processing
introduced in [15–17]. In this paper however, results of [15–
17] are considerably enhanced by creating almost complete
PSS and PES for different languages utilizing the Phonetics
Handbook prepared by the International Phonetics Associa-
tion (IPA) [18].
2. THE PROPOSED METHOD
It would be appropriate to extract the statistical features of
the speech signals over a reasonable length of time. For the
sake of practicality, we present the new technique on the dis-
crete time domain since all the recordings are made with dig-
ital equipment. Let X(n) be the discrete time domain repre-
sentation of a recorded speech piece w ith N samples.
Let this piece be analyzed frame by frame. In this rep-
resentation, X
i
(n) denotes a selected frame as shown in
Figure 1. Then, the following main statement and the re-
lated definitions are proposed which constitute the basis of
the new modeling technique.
2.1. Main statement
Referring to Figure 1,foranytimeframei, the sampled
speech signal which is given by the vector X
i
of length L
F
can
be approximated as
X
i
∼
=
C
i
E
K
S
R
,(1)
where
(i) C
i
is a real constant and it is called the gain factor,
(ii) K, R, N
E
,andN
S
are integers such that K ∈
{
1, 2, , N
E
}, R ∈{1, 2, , N
S
},
(iii) the signature vector S
T
R
= [
s
R1
s
R2
s
RL
F
] is gener-
ated utilizing the statistical behavior of the speech sig-
nals and the term C
i
S
R
contains almost full energy of X
i
in the LMS sense,
(iv) E
K
is (L
F
by L
F
) diagonal matrix such that
E
K
=
⎡
⎢
⎢
⎢
⎢
⎢
⎢
⎣
e
K1
00 0
0 e
K2
0 0
00e
K3
0
.
.
.
.
.
.
.
.
.
.
.
.
.
.
.
000 e
KL
F
⎤
⎥
⎥
⎥
⎥
⎥
⎥
⎦
(2)
andactsasanenvelopetermonthequantityC
i
S
R
which also reflects the statistical properties of the
speech signal under consideration,
(v) the integer L
F
designates the total number of samples
in the ith frame.
Now, let us verify the main statement.
2.2. Verification of the main statement
The sampled speech signal sequence x(n)canbewrittenas
x( n)
=
N
i=1
x
i
δ
i
(n − i). (3)
In (3), δ
i
(n) represents the unit sample; x
i
designates the
measured value of the sequence x(n) at the ith sample. x(n)
can also be expressed in vector form as
X
T
=
x(1) x(2) x(N)
=
x
1
x
2
x
N
. (4)
In this representation, X is called the main frame vector
(MFV) and it may be divided into frames with equal lengths,
having, for example, 16, 24, 32, 64, or 128 samples and so
forth. In this case, MFV which is also designated by M
F
is
obtained by means of the frame vectors
{X
1
, X
2
, , X
NF
}
M
F
=
⎡
⎢
⎢
⎢
⎢
⎣
X
1
X
2
.
.
.
X
N
F
⎤
⎥
⎥
⎥
⎥
⎦
, M
T
F
=
X
T
1
X
T
2
X
T
N
F
,(5)
where
X
i
=
⎡
⎢
⎢
⎢
⎢
⎣
x
(i−1)L
F
+1
x
(i−1)L
F
+2
.
.
.
x
iL
F
⎤
⎥
⎥
⎥
⎥
⎦
, i = 1, 2, , N
F
. (6)
N
F
= N/L
F
denotes the total number of frames in X.Obvi-
ously, integers N and L
F
must be selected in such a way that
N
F
also becomes an integer.
As it is given by [7], each frame sequence or vector X
i
can be spanned in a vector space formed by the orthonormal
vectors
1
{φ
ik
} such that
X
i
=
L
F
k=1
c
k
φ
ik
, k = 1, 2, , L
F
,(7)
where the frame coefficients c
k
are obtained as
c
k
= φ
T
ik
X
i
, k = 1, 2, , L
F
(8)
and
{φ
ik
} are generated as the eigenvectors of the frame cor-
relation matrix R
i
R
i
= E
X
i
X
T
i
=
⎡
⎢
⎢
⎢
⎢
⎢
⎢
⎣
r
i
(1) r
i
(2) r
i
(3) r
i
L
F
r
i
(2) r
i
(1) r
i
(2) r
i
L
F
− 1
r
i
(3) r
i
(2) r
i
(1) r
i
(L
F
− 2)
.
.
.
.
.
.
.
.
.
.
.
.
.
.
.
r
i
L
F
r
i
L
F
− 1
r
i
L
F
− 2
r
i
(1)
⎤
⎥
⎥
⎥
⎥
⎥
⎥
⎦
(9)
constructed with the entries;
r
i
(d +1)=
1
L
F
[i
·L
F
−d]
j=[(i−1)·L
F
+1]
x
j
x
j+d
, d = 0, 1, 2, , L
F
− 1.
(10)
1
It is noted that orthonormal vector φ
ik
satisfies φ
T
ik
φ
ik
= 1.
¨
Umit G
¨
uz et al. 3
X(n)
Frame 1 Fr ame 2 Frame 3 Frame i Frame N
F
123 L
F
12 3 L
F
123 L
F
12 3 L
F
n
X
i
Figure 1: Segmentation of speech signals frame by frame.
In (9) E [·] designates the expected value of a random vari-
able. Obviously, R
i
is real, symmetric, positive semidefinite,
and Toeplitz which in turn yields real, distinct, and nonneg-
ative eigenvalues λ
ik
satisfying the relation R
i
φ
ik
= λ
ik
φ
ik
.
Let the eigenvalues be sorted in descending order such that
(λ
i1
≥ λ
i2
≥ λ
i3
≥···≥λ
iL
F
) with corresponding eigenvec-
tors
{φ
ik
}. Then, the total energy of the frame i is given by
X
T
i
X
i
:
X
T
i
X
i
=
L
F
k=1
x
2
ik
=
L
F
k=1
c
2
ik
. (11a)
In the mean time, the expected value of this energy is ex-
pressed as
E
L
F
k=1
c
2
ik
=
L
F
k=1
φ
T
ik
E
X
i
X
T
i
φ
ik
=
L
F
k=1
φ
T
ik
R
i
φ
ik
=
L
F
k=1
λ
ik
.
(11b)
In (11), contributions of the higher order terms become
negligible, perhaps after p terms. In this case, (7)maybe
truncated. The simplest form of (7) is obtained by setting
p
= 1.
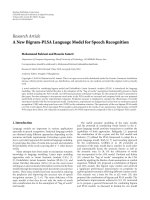
As an example, let us consider a randomly selected 16 se-
quential voice frames formed with L
F
= 16 samples. In this
case, one would end up with 16 distinct positive-real eigen-
values in descending order for each frame. If one plots all
the eigenvalues on a frame basis then, Figure 2 follows. This
figure shows that the eigenvalues become drastically smaller
after the first one. Moreover, if one varies the frame length
L
F
as a parameter to further reduce the effect of the second-
and higher-order terms then, almost full energy of the signal
frame is captured within the first term of (7). Hence,
X
i
∼
=
c
1
φ
i1
. (12)
That is why φ
i1
is called the signature vector since it contains
most of the useful information of the original speech frame
under consideration. Once (12) is obtained, it can be con-
verted to an equality by means of an envelope term E
i
which
is a diagonal matrix for each frame. Thus, X
i
is computed as
X
i
= C
i
E
i
φ
i1
. (13)
10
8
6
4
2
0
2
4
6
8
10
12
14
16
1
3
5
7
9
11
13
15
Eigenvalue amplitude
Eigenvalues (descending order)
i.frame
Figure 2: Plot of the 16 distinct eigenvalues in a descending order
for 16 adjacent speech frames.
In (13), diagonal entries e
ir
of the matrix E
i
are determined
in terms of the entries of φ
T
i1
= [
φ
i11
··· φ
i1r
··· φ
i1L
F
]
and X
T
i
= [
x
i1
··· x
ir
··· x
iL
F
] by simple division.
e
ir
=
x
ir
C
i
φ
i1r
,
r = 1, 2, , L
F
. (14)
In essence, the quantities e
ir
of (14) somewhat absor b the
remaining energy of the terms eliminated by truncation pro-
cess of (7). This approach constitutes the basis of the new
speech modeling technique as follows.
In this research, several tens of thousands of speech pieces
were investigated frame by frame and several thousands of
“signature and envelope sequences” were generated. It was
observed that patterns obtained by plotting the envelope
e
i
(n)(e
ir
versus frame index-n = 1, 2, , L
F
) and signature
sequences φ
i1
(n)(φ
i1r
versus frame index-n = 1, 2, ,L
F
)ex-
hibit similar ities. Some of these patterns are shown in Fig-
ures 3 and 4, respectively. It is deduced that these similar
patterns are obtained due to the quasistationery behavior of
the speech signals. In this case, one can eliminate the sim-
ilar patterns and thus, constitute the so-called “predefined
signature sequence” and “predefined envelope sequence” sets
4 EURASIP Journal on Advances in Signal Processing
0.4
0.3
0.2
0.1
0
0.1
0.2
0.3
0.4
1 2 3 4 5 6 7 8 9 10 11 12 13 14 15 16
Sample [n]
Amplitude
(a)
0.4
0.3
0.2
0.1
0
0.1
0.2
0.3
0.4
1 2 3 4 5 6 7 8 9 10 11 12 13 14 15 16
Sample [n]
Amplitude
(b)
0.4
0.3
0.2
0.1
0
0.1
0.2
0.3
0.4
1 2 3 4 5 6 7 8 9 10 11 12 13 14 15 16
Sample [n]
Amplitude
(c)
0.4
0.3
0.2
0.1
0
0.1
0.2
0.3
0.4
1 2 3 4 5 6 7 8 9 10 11 12 13 14 15 16
Sample [n]
Amplitude
(d)
Figure 3: Some selected eigenvectors which exhibit similar patterns (L
F
= 16).
constructed with one of a kind, or unique patterns. All the
above groundwork leads one to propose “a novel systematic
procedure to model speech signals by means of PSS and PES.”
In short, the new numerical procedure is called “SYMPES”
and it is outlined in the following section.
2.3. A novel systematic procedure to model
speech signals via predefined envelope and
signature sets: SYMPES
SYMPES is a systematic procedure to model speech signals in
four major steps described as follows.
Step 1. Selection of sp eech pieces to create signature and en-
velope sequences.
(i) For a selected frame length L
F
,investigatevarietyof
speech pieces frame by frame which describe the ma-
jor characteristics of speakers and languages to deter-
mine signature and envelope sequences. This step may
result in hundreds of thousand of signature and enve-
lope sequences for different languages. However, these
sequences exhibit too many similar patterns subject to
elimination.
Step 2. Elimination of similar patterns.
(i) Eliminate the similar patterns of signature and en-
velope sequences to end up with unique shapes. Then,
form the PSS and PES utilizing the unique patterns.
Step 3. Reconstruction of speech frame by frame.
(i) Once PSS and PES are formed, one is ready to syn-
thesize a given speech piece X(n)oflengthN fr ame by
frame. In this case, divide X(n) into frames of length
L
F
in a sequential manner to form the MFV of (5).
Then, for each frame X
i
, find the best approximation
X
Ai
= C
i
E
K
S
R
by co mputing the real coefficient C
i
,
¨
Umit G
¨
uz et al. 5
25
20
15
10
5
0
5
10
15
20
25
1 2 3 4 5 6 7 8 9 10 11 12 13 14 15 16
Sample [n]
Amplitude
(a)
25
20
15
10
5
0
5
10
15
20
25
1 2 3 4 5 6 7 8 9 10 11 12 13 14 15 16
Sample [n]
Amplitude
(b)
25
20
15
10
5
0
5
10
15
20
25
1 2 3 4 5 6 7 8 9 10 11 12 13 14 15 16
Sample [n]
Amplitude
(c)
25
20
15
10
5
0
5
10
15
20
25
1 2 3 4 5 6 7 8 9 10 11 12 13 14 15 16
Sample [n]
Amplitude
(d)
Figure 4: Some selected envelope vectors which exhibit similar patterns (L
F
= 16).
pulling E
K
from PES and S
R
from PSS to minimize the
frame error defined by ε
i
(n) = X
i
(n) − C
i
E
K
S
R
, in the
LMS sense.
(ii) Eventually, sequences X
Ai
are collected under the
approximated main fr ame vector
M
AF
=
⎡
⎢
⎢
⎢
⎢
⎣
X
A1
X
A2
.
.
.
X
AN
F
⎤
⎥
⎥
⎥
⎥
⎦
to reconstruct the speech as
X
A
(n) =
X
A1
, X
A2
, , X
AN
F
; N
F
= N/NL
F
≈
X(n).
(15)
Step 4. Elimination of the background noise due to the re-
construction process by using a moving average post-filter.
(i) At the end of the third step, the reconstructed sig-
nal may contain unexpected spikes in merging process
of the speech frames in sequential order. These spikes
may cause unexpected background noise which may
be classified as the musical noise. It was experienced
that the musical noise can significantly be reduced by
means of a moving average post-filter. In this regard,
one may utilize a simple moving average finite impulse
response filter. Nevertheless, an optimum filter can be
selected by trial and error depending on the environ-
mental noise, and the operational conditions.
In the following section, an elimination process of similar
patterns of signature and envelope sequences are described
[19]. At this point, it should be noted that the modeler
is free to employ any other elimination or vector reduc-
tion technique to enhance the quality of hearing. In this re-
gard, one may even wish to utilize the LBG vector quanti-
zation technique with different varieties to reduce the signa-
ture and the envelope sets as desired [20]. Essentials of the
6 EURASIP Journal on Advances in Signal Processing
sample selection to generate P SS and PES are introduced in
Section 4. Computational details to construct PSS and PES
are presented by Algorithm 1. The numerical aspects of the
speech reconstruction process are given by Algorithm 2.
2.4. Elimination of similar patterns
One of the useful tools to measure the similarities between
two sequences is known as the Pearson correlation coefficient
(PCC). PCC is designated by ρ
YZ
and given as [19]
ρ
YZ
=
L
i=1
y
i
z
i
−
L
i=1
y
i
L
i=1
z
i
L
L
i
=1
y
2
i
−
L
i
=1
y
i
2
L
L
i
=1
z
2
i
−
L
i
=1
z
i
2
L
.
(16)
In the above formula Y
= [
y
1
y
2
y
L
]andZ =
[
z
1
z
2
z
L
] are two sequences subject to comparison.
Clearly, (16) indicates that ρ
YZ
is always between −1 and +1.
ρ
YZ
= 1 indicates that two vectors are identical. ρ
YZ
= 0cor-
responds to completely uncorrelated vectors. On the other
hand, ρ
YZ
=−1referstoperfectlyoppositepairofvectors
(i.e., Y
=−Z). For the sake of practicality, it is assumed
that the two sequences are almost identical if 0.9
≤ ρ
YZ
≤ 1.
Hence, similar patterns of signature and envelope sequences
are eliminated accordingly. Thus, the signature vectors which
have unique patterns are combined under the set called pre-
defined signature set PSS
={S
n
s
(n); n
s
= 1, 2, , N
S
}.The
integer N
S
designates the total number of elements in this set.
Similarly, reduced envelope sequences are combined under
the set called predefined envelope set PES
={E
n
e
(n); n
e
=
1, 2, , N
E
}. The integer N
E
designates the total number of
unique envelope sequences in PES. At this point, it should be
noted that members of PSS are not orthogonal. They are just
the unique patterns of the first eigenvectors of various speech
frames obtained from thousands of di fferent experiments. In
Figures 5 and 6, some selected one of a kind signature and en-
velope sequences are plotted point by point against their en-
try indices resulting in the signature and envelope patterns,
respectively.
All of the above explanations endorse the phrasing of the
main statement that any speech frame X
i
can be modeled in
terms of the gain factor C
i
, predefined signature S
R
,anden-
velope E
K
terms as X
i
≈ C
i
E
K
S
R
. In the following section,
algorithms are summarized to generate PSS and PES.
3. GENERATION OF PSS AND PES AND THE
RECONSTRUCTION PROCESS OF SPEECH
The heart of the newly proposed method to model speech
signals is based on the generation of the PSS and PES. There-
fore, in this section first an algorithm is outlined to construct
PSS and PES (Algorithm 1) then, synthesis or reconstruction
process of speech signals is detailed (Algorithm 2).
3.1. Algorithm 1: generation of the predefined
signature and envelope sets
Inputs
(i) Main frame sequence of the speech piece
{X(n), n =
1, 2, , N}.
Herewith, sample speech pieces given by the IPA
Handbook were utilized [18]. This handbook in-
cludes phonetics properties (vowels, consonants,
tones, stress, conventions, etc.) of many different lan-
guages used by both genders.
(ii) L
F
: total number of samples in each frame under con-
sideration.
In this work, different values of L
F
(such as L
F
=
8, 16, 32, 64, 128) were selected to investigate the effect
of the frame length to the quality of the reconstructed
speech by means of the absolute category rating-mean
opinion score (ACR-MOS) and the segmental signal-
to-noise ratio (SNRseg). Details of this effort are given
in the subsequent section.
Computational steps
Step 1. Compute the total number of frames N
F
= N/L
F
.
Step 2. Divide the speech piece X into frames X
i
. In this case,
the original speech is represented by the main frame vector
M
T
F
=
X
T
1
X
T
2
··· X
T
N
F
of (5).
Step 3. For each frame X
i
, compute the correlation matrix R
i
.
Step 4. For each R
i
, compute the eigenvalues λ
ik
in descend-
ing order with the corresponding eigenvectors.
Step 5a. Store the eigenvector which is associated with the
maximum eigenvalue λ
ir
= max {λ
i1
, λ
i2
, λ
i3
, , λ
iL
F
} and
simply refer to this signature vector with the frame index,
as S
i1
.
Step 5b. Compute the gain factor C
i1
in the LMS sense to ap-
proximate X
i
≈ C
i1
S
i1
.
Step 6. Repeat Step 5 for all the frames (i
= 1, 2, , N
F
).
At the end of this loop, eigenvectors, which have maximum
energy for each frame, will be collected.
Step 7. Compare all the collected eigenvectors obtained in
Step 6 with an efficient algorithm. In this regard, Pear-
son correlation formula may be employed as described in
Section 2.4. Then, eliminate the ones which exhibit similar
patterns. Thus, generate the predefined signature set PSS
=
{
S
n
s
(n); n
s
= 1, 2, , N
S
} with reduced number of eigen-
vectors S
i1
.Here,N
S
designates the total number of one of
a kind signature patterns after the elimination. Remark: the
above steps can be repeated for man y different speech pieces
to augment PSS.
Step 8. Compute the diagonal envelope matrix (E
i
)foreach
C
i1
S
i1
such that e
ir
= x
ir
/(C
i1
s
i1r
); r = 1, 2, , L
F
.
¨
Umit G
¨
uz et al. 7
0.4
0.2
0
01020
(a)
0.5
0
0.5
01020
(b)
0.5
0
0.5
01020
(c)
0.5
0
0.5
01020
(d)
0.4
0.3
0.2
01020
(e)
0.5
0
0.5
01020
(f)
0.5
0
0.5
01020
(g)
0.5
0
0.5
01020
(h)
0.4
0.3
0.2
01020
(i)
0.5
0
0.5
01020
(j)
0.5
0
0.5
01020
(k)
0.5
0
0.5
01020
(l)
0.4
0.3
0.2
01020
(m)
0.4
0.2
0
01020
(n)
0.4
0.3
0.2
01020
(o)
0.5
0
0.5
01020
(p)
Figure 5: Unique patterns of some selected signature sequences (L
F
= 16).
Step 9. Eliminate the envelope sequences which exhibit sim-
ilar patterns with an efficient algorithm as in Step 7, and
construct the predefined envelope set PES
={E
n
e
(n); n
e
=
1, 2, , N
E
};Here,N
E
denotes the total number of one of a
kind unique envelope patterns.
Once PSS and PES are generated, then any speech sig-
nal can be reconstructed frame by frame (X
Ai
= C
i
E
K
S
R
)as
implied by the main statement. It can be clearly seen that in
this approach, the frame i is reconstructed with three ma-
jor quantities, namely, the gain fac tor C
i
, the index R of the
predefined signature vector S
R
pulled from PSS, and the in-
dex K of the predefined envelope sequence E
K
pulled from
PES. S
R
and E
K
are determined to minimize the LMS error
which is described by means of the difference between the
original frame piece X
i
and its model X
Ai
= C
i
E
K
S
R
.Details
of the reconstruction process are given in the following algo-
rithm.
3.2. Algorithm 2: reconstruction of speech signals
Inputs
(i) Speech signal
{X(n), n = 1, 2, , N} to be modeled.
(ii) L
F
: number of samples in each frame.
(iii) N
S
and N
E
; total number of the elements in PSS and
in PES, respectively. These integers are determined by
Step 7 and Step 9 of Algorithm 1, respectively.
(iv) ThepredefinedsignaturesetPSS
={S
R
; R = 1, 2, ,
N
S
} created utilizing Algorithm 1.
(v) The predefined envelope set PES
={E
K
; K = 1, 2, ,
N
E
} created utilizing Algorithm 1.
Computational steps
Step 1. Divide X into frames X
i
of length L
F
as in Algorithm
1. In this case, the original speech is represented by the main
frame vector M
T
F
=
X
T
1
X
T
2
··· X
T
N
F
of (5).
8 EURASIP Journal on Advances in Signal Processing
5
0
5
01020
(a)
1.5
1
0.5
01020
(b)
2
1
0
01020
(c)
2
1
0
01020
(d)
2
1
0
01020
(e)
2
1
0
01020
(f)
2
1
0
01020
(g)
1.5
1
0.5
01020
(h)
4
2
0
01020
(i)
5
0
5
01020
(j)
4
2
0
01020
(k)
2
1
0
01020
(l)
2
1
0
01020
(m)
1.5
1
0.5
01020
(n)
1.5
1
0.5
01020
(o)
5
0
5
01020
(p)
Figure 6: Unique patterns of some selected envelope sequences (L
F
= 16).
Step 2a. For each frame i pull an appropriate signature vector
S
R
from PSS such that the distance or the total error δ
R
=
X
i
− C
R
S
R
2
is minimum for all
R = 1, 2, , R, , N
S
.
This step yields the index R of the S
R
. In this case, δ
R
=
min{X
i
− C
R
S
R
2
}=X
i
− C
R
S
R
2
.
Step 2b. Store the index number R that refers to S
R
, in this
case, X
i
≈ C
R
S
R
.
Step 3a. Pull an appropriate envelope sequence (or diagonal
envelope matrix) E
K
from PES such that the error is fur-
ther minimized for all
K = 1, 2, , K, , N
E
.Thus,δ
K
=
min{X
i
− C
R
E
K
S
R
2
}=X
i
− C
R
E
K
S
R
2
. This step yields
the index K of the E
K
.
Step 3b. Store the index number K that refers to E
K
. It should
be noted that at the end of this step, the best signature vector
S
R
and the best envelope sequence E
K
are found by appropri-
ate selections. Hence, the frame X
i
is best described in terms
of the patterns of E
K
and S
R
. That is, X
i
≈ C
R
E
K
S
R
.
Step 4. Having fixed E
K
and S
R
,onecanreplaceC
R
by com-
puting a new gain factor C
i
= (E
K
S
R
)
T
X
i
/(E
K
S
R
)
T
(E
K
S
R
)to
further minimize the distance between the vectors X
i
and
C
R
E
K
S
R
in the LMS sense. In this case, the global mini-
mum of the error is obtained and it is given by δ
Global
=
X
i
− C
i
E
K
S
R
2
. At this step, the frame sequence is approxi-
mated by X
Ai
= C
i
E
K
S
R
.
Step 5. Repeat the above steps for each frame to reconstruct
speech as M
T
AF
=
X
T
A1
X
T
A2
X
T
AN
F
≈M
T
F
.
In the following section, the new method of speech mod-
eling is implemented for the frame lengths L
F
= 16 and 128
¨
Umit G
¨
uz et al. 9
to exhibit the usage of Algorithms 1 and 2 and the resulting
speech quality are compared with the results of commercially
available speech coding techniques G.726, LPC-10E, and also
with our previous work [7].
4. INITIAL RESULTS ON THE IMPLEMENTATION
OF THE NEW METHOD OF SPEECH
REPRESENTATION
In this section, the speech reconstruction quality of the new
method is compared with those of G.726 at 16 kbps and LPC-
10E at 2.4 kbps providing (1 to 4) and (1 to 26.67) compres-
sion ratio, respectively. In this regard, the compression ratio
(CR) is defined as CR
= b
org
/b
rec
;whereb
org
designates the
total number of bits in representing the original signal and
b
rec
is the total number of bits which refers to the compressed
version of the original. Finally, SYMPES is compared with the
speech modeling technique presented in [7].
4.1. Comparison with G.726 (ADPCM) at 16 kbps
In order to make a fair comparison between G.726 at 16 kbps
and the newly proposed technique, the input parameters of
Algorithm 1 are arranged in such a way that Algorithm 2 of
the reconstruction process yields CR
= 4. In this case, one
only needs to measure the speech quality of the reconstructed
signals as descr ibed below. In this regard, the speech pieces,
which were given by the IPA Handbook and sampled with
8 KHz sampling rate were utilized to generate PSS and PES
with L
F
= 16 samples. In the generation process, all the avail-
able characteristic sentences (total of 253) from five different
languages (English, French, Ger man, Japanese, and Turkish)
were employed. These sentences include consonants, conven-
tions, introduction, pitch-accent, stress and accent, vowels
(nasalized and oral), and vowel-length. Details are given in
Table 1.
In this case, employing Algorithm 1, PSS was constructed
with N
S
= 2048 unique sig nature patterns. Similarly, PES
was generated with N
E
= 57422 unique envelopes. As de-
scribed in Section 2.4 and step 7 of Algorithm 1, Pearson’s
similarity measure of (16)with0.9
≤ ρ
YZ
≤ 1wasused
in the elimination process. As a result of the above compu-
tations, N
S
and N
E
are represented with 11 and 16 bits, re-
spectively. It was experienced that 5 bits were good enough
to code the C
i
. In conclusion, one ends up with a total num-
ber of N
BF
= 5+11+16 = 32 bits to reconstruct the
speech signals for each frame employing the newly proposed
method. On the other hand, the orig inal signal, coded with
standard PCM (8 bits, 8 KHz sampling rate) is represented by
N
B(PCM)
= 8 × 16 = 128 bits. Hence, both G.726 at 16 kbps
and the new method provide CR
= 4 as desired. Under the
given conditions, it is meaningful to compare the average
ACR-MOS and the SNRseg, obtained for both G.726 and
the new method. In the following section, ACR-MOS and
SNRseg test results are presented.
It should be remarked that ideally one would expect to
construct the universal predefined signature and envelope
sets which are capable of producing all the existing sounds
of languages. In this case, one may question the speech
reproduction capability of PSS and PES derived using 253
different sound phrases mentioned above. Actually, we tried
to enhance PSS and PES employing the other languages avail-
able in IPA. However, under the same elimination process
implemented in Algorithm 1, we were not able to further in-
crease the number of signature and the envelope patterns.
Therefore, 253 sound phrases are good enough for the speech
reproduction process of SYMPES. As a matter of fact, as it
is shown by the following examples, the hearing quality of
the new method (MOS
≈ 4.1) is much better than G.726
MOS
≤ 3.5). Hence, we confidently state that PSS and PES
obtained for L
F
= 16 provide good quality of speech repro-
duction.
4.1.1. MOS and SNR assessment results:
new method SYMPES versus G.726
In this section, mean opinion score and segmental signal-
to-noise ratio results of SYMPES are presented and they are
compared with those of G.726.
Mean opinion score tests: once PSS and PES are gener-
ated, the subjec tive test process contains three stages; collec-
tion of original speech samples, speech modeling or recon-
struction, and the hearing quality evaluation of the recon-
structed speech.
The original speech samples were collected from OGI,
TIMIT, and IPA corpus databases [18, 21–23]. In this regard,
we had the freedom to work with five languages namely; En-
glish, French, German, Japanese, and Turkish. Furthermore,
for each language, we picked 24 different sentences or phrases
which were uttered by 12 male and 12 female speakers. At this
point, it is important to mention that PSS and PES should be
universal (speaker and language independent) for any sound
to be synthesized. Therefore, for the sake of fairness, we were
careful not to use the same speech samples which were uti-
lized in the construction PSS and PES. In the second stage
of the tests, one has to model the selected speech samples us-
ing Algorithm 2. In the last stage, reconstructed speech pieces
for both the new method and G.726 are e valuated by means
of the subjective (ACR-MOS) and the objective (SNRseg)
speech quality assessment techniques [24, 25].
Specifically, for subjective evaluation, we implemented
the absolute category rating—mean opinion score (ACR-
MOS) test procedure. In this process, firstly, the recon-
structed speech pieces and then the originals are listened by
several untrained listeners. T hen, these listeners are asked to
rate the overall quality of the reconstructed speech using five
categories (5.0: excellent, 4.0: good, 3.0: fair, 2.0: poor, 1.0:
bad). Eventually, one takes the average of the opinion scores
of the listeners for the speech sample under consideration.
An advantage of the ACR-MOS test is that subjects are free
to assign their own perceptual impression to the speech qual-
ity. However, these freedom posses numerous disadvantages
since the individual subject’s goodness scales vary greatly.
This variation can be a biased judgment. This bias could be
avoided by using a large number of subjects. Therefore, as
recommended by [26–29], we employed 40 (20 male and 20
female)subjectstocomeupwithreliableACR-MOSvalues.
10 EURASIP Journal on Advances in Signal Processing
Table 1: Language-based speech property distribution of the complete sample set provided by IPA utilized to form PSS and PES for L
F
= 16.
Languages
English French German Japanese Turkish
Speaker gender Female Female Male Male Male
Consonants
25 21 25 20 22
Conventions
17 — 18 21 4
Introduction
—— 4 — —
Pitch-accent
—— — 6 —
Stress-and-accent
—— 1 — 3
Vowels
Nasalized
15
3
19 5 8
Oral
12
Vowel-length —— — 4 —
Subtotal number of words
57 36 67 56 37
Total number of words
253
In order to assess the objective quality of the recon-
structed speech signals, the SNRseg is utilized. Here, in this
work, each segment is described over 10 frames of length
L
F
= 16 or equivalently each segment consists of K
F
= 160
samples. Then, SNRseg is given by
SNR
seg
=
1
T
F
T
F
−1
j=0
10 log
10
m
j
n=m
j
−K
F
+1
x( n)
2
m
j
n=m
j
−K
F
+1
x( n) − x(n)
2
.
(17)
Let N be the total number of samples in the speech piece
to be reconstructed. Then, in (17) T
F
= N/K
F
; j desig-
nates the frame index; n is the sample number in frame j;
m
0
= K
F
; m
j
= jK
F
. It should be noted that the indices
m
0
, m
1
, , m
T
F
−1
refer to the “end points” of each segment
placed in the speech piece to be reconstructed.
The ACR-MOS test results and computed values of
SNRseg for the reconstructed speech pieces are summarized
in Table 2.
If we compute the average ACR-MOS and SNRseg values
over the languages, one can clearly see that the new method
provides much better speech quality over G.726. In this case,
we can say that the proposed method yields almost toll qual-
ity (MOS
≈ 4.1) whereas G.726 is considered to yield com-
munication quality (MOS
≈ 3.5). To provide visual compre-
hension, the original and the reconstructed waveforms of the
five speech waveforms corresponding to five different sen-
tences in five languages uttered by male speakers are depicted
in Figure 7. Similarly, in Figure 8, speech waveforms uttered
by female speakers are shown.
As it can be deduced from Figure 7, the visual difference
between the original and the reconstructed waveforms are
negligible, which verifies the superior results presented in
Table 2 for the newly proposed speech modeling technique.
This completes the comparison at the low compression rate
(CR
= 4).
It should be mentioned that similar comparisons were
also made with G.726 at 24, 32, and 48 kbps. For these cases
proposed method yields slightly better results over G.726. For
example, the new method with L
F
= 8 corresponds to G.726
at 32 kbps. In this case, while G.726 results in SNR
G.726−32
≈
25 dB, the new method gives SNR ≈ 26 dB. Since the differ-
ence is negligible, details are omitted here.
Let us now comment on the noise robustness of SYMPES.
4.1.2. Comments on the noise robustness of SYMPES
SYMPES directly builds a mathematical model for the speech
signal regardless it is noisy or not. Therefore, one expects
to end up with a similar noise level in the reconstructed
speech as in the original. In fac t, a subjective noise test
was run to observe the effect of the noisy environment
to the robustness of SYMPES. In this regard, a noise free
speech piece was mixed with 1.2 dB white noise; then it
was reconstructed using SYMPES of L
F
= 16. The test
was run among 5 male and 5 female untrained listen-
ers. They were asked to rate the noise level of the recon-
structed speech relative to the original, under three cate-
gories namely “no change in the noise level,” “reduced noise
level,” and “increased noise level”. Seven of the listeners
confirmed that the noise level of the reconstructed speech
was not changed. Two of the female subjects said that the
noise level was slightly reduced, and one of the male lis-
tener asserted that noise level was slightly increased. In this
case, we can safely state that “SYMPES is not susceptible
to the noise level of the environment.” Furthermore, any
noise level which is built on the original signal can be re-
duced by post-filtering the reconstructed signal. As a mat-
ter of fac t it was experienced that both the background noise
due to reconstruction process and the environmental noise
were reduced significantly by using a moving average post-
filter.
At this point, it may be meaningful to make a further
comparison at high compression rates such as CR
= 25 or
higher. For this purpose, voice excited LPC-10E which yields
CR
= 26.67 may be considered as outlined in the following
section.
¨
Umit G
¨
uz et al. 11
Table 2: Subjective and objective speech quality scores for G726 and the new method.
Language
Speaker Number of
Bit rate [kbps]
ACR-MOS SNRseg [dB]
gender speech pieces (G.726) ADPCM SYMPES (G.726) ADPCM SYMPES
English
Male 12
16
3.417 4.124 7.4014 12.4033
Female 12 3.419 4.109 7.4289 12.1969
French
Male 12
16
3.413 4.111 7.3513 12.2083
Female 12 3.422 4.099 7.4396 12.0518
German
Male 12
16
3.386 4.051 6.9072 11.4075
Female 12 3.371 4.036 6.6886 11.2053
Japanese
Male 12
16
3.422 4.167 7.4599 12.9719
Female 12 3.668 4.272 11.1795 14.4533
Turkish
Male 12
16
3.453 4.040 7.9029 11.2603
Female 12 3.433 4.010 7.6134 10.8320
Average
3.440 4.102 8.000 12.000
scores
4.2. Comparison with voice excited LPC-10E (2.4 kbps)
Standard voice excited LPC-10E employs 20 msec speech
frames coded with 48 bits which corresponds to 2.4kbps.
On the other hand, using standard PCM, these time frames
contain 160 samples represented by 1280 bits. Thus, the
compression rate of LPC-10E is CR
LPC
= 1280/48. = 26.67.
In order to make a fair comparison, parameters of the new
method have to match to that of LPC-10E. First of all, PSS
and PES must be regenerated accordingly. In this regard, we
can say that one needs to deal with a multitudinous vari-
ety of many “signature and envelope” sets to enhance the
language & speaker independency for the long speech frame
lengths such as L
F
= 128. However, it should be recalled
that this was not the case for L
F
= 16. So, as described in
Section 4.1, we utilized the rich speech samples collection of
IPA [18] with 890 different char acteristic sentences in 17 dif-
ferent languages (English, French, German, Japanese, Turk-
ish, Amharic, Arabic, Irish, Sindhi, Cantonese, Czech, Bul-
garian, Dutch, Hebrew, Catalan, Galician, and Croatian) (see
Table 3). Choosing L
F
= 128 and 0.9 ≤ ρ
YZ
≤ 1, Algorithm
1returnswithN
S
= 32768 signature and N
E
= 131072 en-
velope patterns of one kind. Clearly, it is sufficient to repre-
sent N
S
and N
E
with 15 and 17 bits, respectively. As was the
case before, the gain factor C
i
is also represented with 5 bits.
In this case, each frame of 128 samples is represented by total
number of N
BF
= 5+15+17 = 37 bits. Thus, the compression
ratio of the new method becomes CR
= 128 × 8/37 = 27.68
which is even higher than CR
LPC
= 26.67. In the follow-
ing section it is shown that the new method yields superior
speech quality over voice excited LPC-10E.
4.2.1. MOS test results: SYMPES versus voice
excited LPC-10E
As described in Section 4.1.1, after the formation of PSS and
PES with L
F
= 128 samples, we run the ACR-MOS test with
the same speech set given by Table 2. The test results are sum-
marized in Ta ble 4.
A close examination of Table 4 reveals that SYMPES re-
sults in superior speech quality over voice excited LPC-10E
for all the languages under consideration.
Just for the sake of visual inspection an original and a re-
constructed speech signals are depicted in Figure 9 for com-
parison. A close examination of Figure 9 validates the su-
perior reconstruction ability of SYMPES over voice excited
LPC-10E.
4.2.2. Comparison of SYMPES with CS-ACELP
It is important to mention that one may conceptually link
SYMPES with the other code excited linear predictive (CELP)
methods such as conjugate structure-algebraic CELP (CS-
ACELP) at 8 kbps (or G.729 at 8 kbps).
CS-ACELP utilizes two stage LBG vector quantization
with fixed
2
and adaptive
3
codebooks [30]. In this regard,
each speech frame of 10 msec is described in terms of the
indices of the fixed and adaptive codes and the gain factor
and they are represented with a total of 80 bits which cor-
responds to a compression ratio of CR
CS-ACELP
= 8. This
process may resemble the procedure described by SYMPES.
Fixed and adaptive codes of CS-ACELP may be related to
the signature and the envelope sequences of SYMPES respec-
tively; but it should be kept in mind that SYMPES does not
include any adaptive quantity beyond the gain factor. Fur-
thermore, CS-ACELP is an LPC technique which takes the
error or the residual into account in an additive manner
whereas SMYPES literally produces a simple but a nonlin-
ear frame model by multiplying three major quantities so
that X
Ai
= f (C
i
, E
K
, S
R
) = C
i
E
K
S
R
. In this representation,
the envelope matrix E
K
works on the signature vector S
R
as a multiplier to reduce the modeling error in a nonlin-
ear manner. Clearly, it is not possible to find a one-to-one
correspondence between the SYMPES and the CS-ACELP,
2
Voice excitations.
3
Line spectral pairs (LSP) envelope parameters.
12 EURASIP Journal on Advances in Signal Processing
1
0.5
0
0.5
1
024681012141618
10
3
Original speech signal
Amplitude
English-male
1
0.5
0
0.5
1
02 46810
10
3
Original speech signal
Amplitude
French-male
1
0.5
0
0.5
1
024681012141618
10
3
Reconstructed speech signal
Amplitude
English-male
1
0.5
0
0.5
1
02 46810
10
3
Reconstructed speech signal
Amplitude
French-male
1
0.5
0
0.5
1
02 4 6 8 10121416
10
3
Original speech signal
Amplitude
German-male
1
0.5
0
0.5
1
02 4 6 8 10121416
10
3
Original speech signal
Amplitude
Japanese-male
1
0.5
0
0.5
1
02 4 6 8 10121416
10
3
Reconstructed speech signal
Amplitude
German-male
1
0.5
0
0.5
1
02 4 6 8 10121416
10
3
Reconstructed speech signal
Amplitude
Japanese-male
1
0.5
0
0.5
1
02 46810
10
3
Original speech signal
Amplitude
Turkish-male
1
0.5
0
0.5
1
0246810
10
3
Reconstructed speech signal
Amplitude
Turkish-male
Figure 7: Original and reconstructed speech waveforms using the new method for English, French, German, Japanese, and Turkish sentences
uttered by male speakers.
since they differ in nature with respect to both model
4
and
domain
5
. On the other hand, the gain factor C
i
of SYM-
PES plays the same role as in CS-ACELP to further reduce
4
Linear model of CS-ACELP versus nonlinear model of SYMPES.
5
Transform domain of CS-ACELP versus discrete time domain of SYM-
PES.
the error between the original and the approximated speech
frames in the LMS sense. Similar MOS tests of Section 4.2.1
were also run to c ompare SYMPES at L
F
= 32
6
with CS-
ACELP at 8 kbps. It was found that SYMPES yields the
6
SYMPES L
F
= 32 with 8 KHz sampling rate yields the compression ration
of CR
= 8 as in CS-ACELP at 8 kbps.
¨
Umit G
¨
uz et al. 13
1
0.5
0
0.5
1
0123456789
10
3
Original speech signal
Amplitude
English-female
1
0.5
0
0.5
1
02468101214
10
3
Original speech signal
Amplitude
French-female
1
0.5
0
0.5
1
0123456789
10
3
Reconstructed speech signal
Amplitude
English-female
1
0.5
0
0.5
1
02468101214
10
3
Reconstructed speech signal
Amplitude
French-female
1
0.5
0
0.5
1
00.511.52
10
4
Original speech signal
Amplitude
German-female
1
0.5
0
0.5
1
02 4 6 810
10
3
Original speech signal
Amplitude
Japanese-female
1
0.5
0
0.5
1
00.511.52
10
4
Reconstructed speech signal
Amplitude
German-female
1
0.5
0
0.5
1
02 4 6 810
10
3
Reconstructed speech signal
Amplitude
Japanese-female
1
0.5
0
0.5
1
00.20.40.60.811.21.41.61.82
10
4
Original speech signal
Amplitude
Turkish-fema le
1
0.5
0
0.5
1
00.20.40.60.811.21.41.61.82
10
4
Reconstructed speech signal
Amplitude
Turkish-fema le
Figure 8: Original and reconstructed speech waveforms using the new method for English, French, German, Japanese, and Turkish sentences
uttered by female speakers.
average MOS
SYMPES
= 3.72 in contrast with CS-ACELP giv-
ing the average MOS
CS-ACELP
= 3.70. Details are omitted here
since the hearing quality difference between the two methods
is negligible.
Based on the experimental results of this research, we
conclude that SYMPES provides much better hearing qual-
ity than that of commercially available G.726 and CELP cod-
ing techniques at high compression rates (CR
8). At low
14 EURASIP Journal on Advances in Signal Processing
Table 3: Language-based speech property distribution of the complete sample set provided by IPA utilized to form PSS and PES for L
F
= 128.
Language
Speaker
gender
Consonant Convention
Vowels
Stress and
accent
Introduction
Pitch-
accent
Vowel-
length
Assimilation Geminatives
English Female 25 17 15 ——————
French Female 21 —
Nasalized 3 ——————
Oral 12
German Male 25 18 19 14————
Japanese Male 20 21 5 ——64——
Turkish Male 22 4 8 3—————
Amharic Male 35 — 11 ——————
Arabic Male 29 — 8 ——————
Irish Female 44 — 14 ——————
Sindhi Male 46 — 10 ——————
Cantonese Male 19 —
Diphthongs 11
————— 9
Monophthongs 32
Czech Female 25 — 13 5——3 —
Bulgarian Female 22 — 8 2—————
Dutch Female 23 — 22 4—————
Hebrew Male 22 — 5 2—————
Catalan Male 23 21
Diphthongs 8
7—————
Stressed 7
Unstressed 3
Galician Male 21 22 7 23 — — — — —
Croatian Female 25 10
1
20 3 — — — —
Long 7
Short 5
Subtotal
number of
words
447 113 234 62 12 6 4 3 9
Total nu mbe r
of words
890
Table 4: Subjective speech quality scores for LPC-10E and the new method.
Language Speaker gender Number of speech pieces
ACR -MOS
LPC-10E 2.4kbps SYMPES2.3125 kbps
English
Male 12 2.490 3.384
Female 12 2.395 3.455
French
Male 12 2.520 3.374
Female 12 2.409 3.435
German
Male 12 2.540 3.363
Female 12 2.410 3.411
Japanese
Male 12 2.460 3.359
Female 12 2.427 3.603
Turkish
Male 12 2.610 3.396
Female 12 2.452 3.418
Average scores 2.471 3.420
¨
Umit G
¨
uz et al. 15
1
0.5
0
0.5
1
0123456
Original speech signal 10
4
(a)
1
0.5
0
0.5
1
0123456
10
4
Reconstructed speech signal obtained
by using SYMPES CR
= 27.68
(b)
1
0.5
0
0.5
1
0123456
10
4
Reconstructed speech signal obtained
by using voice excited LPC-10E CR
= 26.67
(c)
Figure 9: Original and the reconstructed speech signals for visual
inspection and comparison of the new method of speech modeling
SYMPES with LPC-10E.
compression rates (CR ≤ 8) however, SYMPES yields either
slightly better or almost the same speech quality like the oth-
ers.
4.3. Comparison of SYMPES with our
previous results given by [7]
First of all in [7], the results were given on the predefined sig-
nature set which was generated based on selected 500 words
from Turkish Language, which in turn makes the speech
model very restricted; whereas in this work, complete speech
pieces of OGI, TIMIT, and IPA Handbook were utilized to
generate predefined signature and envelope sets which are
supposed to yield rather universal results and make SYMPES
speaker and language independent.
Moreover, in [7], envelope sequences which improve the
hearing quality tremendously were not used at all. Hence,
here in this work, results of [7] were pretty much general-
ized and hearing quality of the reconstructed speech signals
is significantly enhanced. As a matter of fac t , no matter what
the frame length and the compression ratio is, in the recon-
struction process, mean opinion scores presented in [7]were
below 2.8 out of 5, whereas in this work, in all the examples,
they are well above 3.4. Therefore, we can simply state that
SYMPES is the generalized and the improved version of the
speech model method presented in [7].
5. CONCLUSIONS
In this paper, a novel systematic procedure referred to as
“SYMPES” is presented to model speech signals frame by
frame by means of the so-called predefined “signature and
envelope” patterns. In this procedure, the reconstructed
speech frame X
Ai
is described by multiplying three major
quantities, namely, the gain factor C
i
, the frame signature
vector S
R
, and the diagonal envelope matrix E
K
or in short
as X
Ai
= C
i
E
K
S
R
. Signature and envelope patterns are se-
lected from the corresponding PSS and PES that are formed
through the use of a variety of speech samples included in the
IPA Handbook. These sets are almost universal. That is to say,
they are speaker and language independent. In the synthesis
process, each speech frame is fully identified with the gain
factor C
i
and the indices R and K of the predefined signature
and the envelope patterns, respectively.
The subjective and objective test assessments reveal that
the hearing quality of SYMPES is slightly better at low com-
pression rates (CR
≤ 8) than that of G.726 (16, 24, 32,
and 48 kbps) and CS-ACELP (8 kbps). At higher compres-
sion rates (CR
8), SYMPES results in superior hearing
quality over G.726 and LPC techniques. One should note
that this high rate of compression is purchased at the expense
of the computational efforts to determine the gain factors as
well as to identify the proper signature and envelope patterns
in the search process. In this regard, computational lag may
be disregarded by an appropriate buffering operation.
As far as digital communication systems are concerned,
SYMPES may be considered as a coding scheme. In this case,
once the PSS and PES are created and stored, one only needs
to transmit the C
i
with the relevant indices R and K.Forex-
ample, if SYMPES with L
F
= 128 is used, then a substan-
tial saving in the transmission-bandwidth (CR
= 27.68) with
good quality of speech is achieved.
It is interesting to note that the new method of speech
modeling presented in this paper may be employed for
speech recognition purposes as described in [31]. It may be
used to model biomedical sig nals such as electrocardiograms
and electromyograms as well. Initial results of these works are
given in [32, 33]. In future research, we hope to improve the
results of [31–33] and the computational efficiency of SYM-
PES.
ACKNOWLEDGMENT
This work is sponsored by the research unit of Istanbul
University, Istanbul, Turkey under the Contracts No. UDP-
440/10032005 and 400/03062005.
REFERENCES
[1] A. S. Spanias, “Speech coding: a tutorial review,” Proceedings of
the IEEE, vol. 82, no. 10, pp. 1541–1582, 1994.
[2] S. Watanabe, “Karhunen-Loeve expansion and factor analy-
sis; theoretical remarks and applications,” in Transactions of the
4th Prague Conference on Information Theory, Statistical Deci-
sion Functions and Random Processes, pp. 635–660, Czechoslo-
vak Academy of Sciences, Prague, Czech Republic, 1965.
16 EURASIP Journal on Advances in Signal Processing
[3] G. Varile and A. Zampolli, Survey of the State of the Art in
Human Language Technology, chapter 10.2: Transmission and
Storage (B. S. Atal and N. S. Jayant), Cambridge University
Press, Cambridge, UK, 1998.
[4]A.M.Karas¸ and B. S. Yarman, “A new approach for repre-
senting discrete signal waveforms via private signature base
sequences,” in Proceedings of the IEEE European Conference on
Circuit Theory and Design, pp. 875–878, Istanbul, Turkey, Au-
gust 1995.
[5] A. M. Karas¸, Characterization of electr ical signals by using sig-
nature base functions, Ph.D. thesis, Department of Electrical
and Computer Engineering, Institute of Science, Istanbul Uni-
versity, Istanbul, Turkey, January 1997, Advisor: Professor B. S.
Yarman.
[6] R. Akdeniz and B. S. Yarman, “Turkish speech coding by sig-
nature base sequences,” in Proceedings of the International Con-
ference on Signal Processing Applications & Technology (ICSPAT
’98), pp. 1291–1294, Toronto, Canada, September 1998.
[7] R. Akdeniz and B. S. Yarman, “A novel method to represent
speech signals,” Signal Processing, vol. 85, no. 1, pp. 37–50,
2005.
[8] H. Hotelling, “Analysis of a complex of statistical variables
into principal components,” Journal of Educational Psychology,
vol. 24, no. 6, pp. 417–498, 1933.
[9] E. Oja, “A simplified neuron model as a principal component
analyzer,” Journal of Mathematical Biology, vol. 15, no. 3, pp.
267–273, 1982.
[10] I. T. Jolliffe, Principal Component Analysis, Springer Series in
Statistics, Springer, New York, NY, USA, 1933.
[11] A. N. Akansu and R. A. Haddad, Multiresolution Signal De-
composition, Academic Press, San Diego, Calif, USA, 1992.
[12] K. Fukunaga, Introduction to Stat istical Pattern Recognition,
Academic Press, London, UK, 1990.
[13] A. J. Newman, “Model reduction via the Karhunen Loeve ex-
pansion part I: an exposition,” Tech. Rep. ISR T.R.96-32, Insti-
tute of Systems Research, College Park, Md, USA, April 1996.
[14] G. Strang, Linear Algebra and Its Applications, Academic Press,
New York, NY, USA, 1980.
[15]
¨
U. G
¨
uz, A new approach in the determination of optimum signa-
ture base functions for Turkish speech, Ph.D. thesis, Department
of Electrical and Computer Engineering, Institute of Science,
Istanbul University, Istanbul, Turkey, 2002, Advisor: Professor
B. S. Yarman.
[16]
¨
U. G
¨
uz,B.S.Yarman,andH.G
¨
urkan, “A new method to rep-
resent speech sig nals via predefined functional bases,” in Pro-
ceedings of the IEEE European Conference on Circuit Theory and
Design, vol. 2, pp. 5–8, Espoo, Finland, August 2001.
[17]
¨
U. G
¨
uz, H. G
¨
urkan, and B. S. Yarman, “A novel method to rep-
resent the speech signals by using language and speaker inde-
pendent predefined functions sets,” in Proceedings of the IEEE
International Symposium on Circuits and Systems, vol. 3, pp.
457–460, Vancouver, BC, Canada, May 2004.
[18] IPA, Handbook of the International Ph onetics Association: A
Guide to the Use of the International Phonetic Alphabet,Cam-
bridge University Press, Cambridge, UK, 1999.
[19] K. Pearson, “On lines and planes of closest fit to systems of
points in space,” Philosophical Magazine, vol. 2, no. 11, pp.
559–572, 1901.
[20] Y. Linde, A. Buzo, and R. M. Gray, “An algorithm for vec-
tor quantizer design,” IEEE Transactions on Communications,
vol. 28, no. 1, pp. 84–95, 1980.
[21] OGI Multi-Language Telephone Speech Corpus, CD-ROM,
Linguistic Data Consortium.
[22] S. R. Quackenbush, T. P. Barnwell, and M. A. Clements, Ob-
jective Measures of Speech Quality, Prentice Hall, Englewood
Cliffs, NJ, USA, 1988.
[23] J.S.Garofolo,L.F.Lamel,W.M.Fisher,J.G.Fiscus,D.S.Pal-
lett, and N. L. Dahlgren, “DARPA TIMIT acoustic phonetic
speech corpus,” Tech. Rep. NISTIR 4930, U.S. Department of
Commerce, NIST, Computer Systems Laboratory, Washing-
ton, DC, USA, 1993.
[24] ITU-T Recommendation G.726; 40, 32, 24, 16 kbit/s ADPCM,
Geneva, (12/90).
[25] ITU-T Appendix III to ITU-T Recommendation G.726; Gen-
eral aspects of digital transmission systems-comparison of
ADPCM algorithms, Geneva, (05/94).
[26] ITU-T Recommendation P.861; Series P: Telephone transmis-
sion quality methods for objective and subjective assessment
of quality-objective quality measurement of telephone band
(300-3400 Hz) speech codecs, Geneva, (08/96).
[27] ITU-T Recommendation P.830; Telephone transmission qual-
ity methods for objective and subjective assessment of quality-
subjective performance assessment of telephone-band and
wideband digital codecs, Geneva, (02/96).
[28] W. D. Voiers, “Methods of predicting user acceptance of voice
communication systems,” Final Report DCA100-74-C-0056,
July 1976.
[29] ITU-T Recommendation P.800; Series P: Telephone transmis-
sion quality methods for objective and subjective assessment
of quality-methods for subjective determination of transmis-
sion quality, Geneva, (08/96).
[30] ITU-T Recommendation G.729; Coding of speech at 8 kbit/s
using CS-ACELP.
[31]
¨
U. G
¨
uz,H.G
¨
urkan, and B. S. Yarman, “A new speech signal
modeling and word recognition method by using signature
andenvelopefeaturespaces,”inProceedings of the IEEE Euro-
pean Conference on Circuit Theory and Design, vol. 3, pp. 161–
164, Cracow, Poland, September 2003.
[32] B. S. Yarman, H. G
¨
urkan,
¨
U. G
¨
uz, and B. Ayg
¨
un, “A new mod-
eling method of the ECG signals based on the use of an opti-
mized predefined functional database,” Acta Cardiologica - An
International Journal of Cardiology, vol. 58, no. 3, pp. 59–61,
2003.
[33] H. G
¨
urkan,
¨
U. G
¨
uz, and B. S. Yarman, “A novel representa-
tion method for electromyogram (EMG) signal with prede-
fined signature and envelope functional bank,” in Proceedings
of the IEEE International Sy m posium on Circuits and Systems,
vol. 4, pp. 69–72, Vancouver, BC, Canada, May 2004.
¨
Umit G
¨
uz graduated from Istanbul P ertev-
niyal High School in 1988 and Department
of Computer Programming, Yıldız Techni-
cal University, Istanbul, Turkey in 1990. He
received the B.S. degree with high honors
from the Department of Electronics Engi-
neering, College of Engineering, Istanbul
University, Istanbul, Turkey in 1994. He re-
ceived M.S. and Ph.D. degrees in electron-
ics engineering from the Institute of Sci-
ence, Istanbul University, Istanbul, Turkey, in 1997 and 2002, re-
spectively. From 1995 to 1998 he was a Research and Teaching
Assistant in the Department of Electronics Engineering, Istanbul
University. He has been an Instructor in the Department of Elec-
tronics Engineering, Engineering Faculty, Is¸ ı k University, Istanbul,
Turkey, since 1998. He is awarded with postdoctoral research fel-
lowship by The Scientific and Technical Research Council of Turkey
¨
Umit G
¨
uz et al. 17
(T
¨
UB
˙
ITAK) in 2006. He is accepted as an International Fellow by
the SRI (Stanford Research Institute)-International Speech Tech-
nology and Research (STAR) Laboratory in 2006. He is awarded
with the J. William Fulbright Post-Doctoral Research Fellowship
in 2007. He is accepted as an International Fellow by the Interna-
tional Computer Science Institute (ICSI) Speech Group at the Uni-
versity of California, Berkeley in 2007. His research interest covers
speech modeling, speech coding, speech compression, automatic
speech recognition, natural language processing, and biomedical
signal processing.
Hakan G
¨
urkan received the B.S., M.S., and
Ph.D. degrees in electronics and communi-
cation engineering from the Istanbul Tech-
nical University, Istanbul, Turkey, in 1994,
1998, and 2005, respectively. He was a Re-
search Assistant in the Department of Elec-
tronics Engineering, Engineering Faculty,
Is¸ık University, Istanbul, Turkey. He has
been an instructor in the Department of
Electronics Engineering, Engineering Fac-
ulty, Is¸ık University, Istanbul, Turkey, since 2005. His current in-
terests are in digital signal processing, mainly with biomedical and
speech signals modeling, representation, and compression.
Binboga Sıddık Yarman received the B.S.
degree in electrical engineering from Is-
tanbul Technical University, Turkey (1974);
M.E.E.E. degree from Electro-Math Stevens
Institute of Technology Hoboken, NJ, 1977;
Ph.D. degree in EE-Math from Cornell Uni-
versity, Ithaca, NY, 1981. He was a Mem-
ber of the Technical Staff, Microwave Tech-
nology Centre, RCA David Sarnoff Research
Center, Princeton, NJ (1982–1984); Profes-
sor, Alexander Von Humboldt Fellow, Ruhr University, Bochum,
Germany (1987–1994); Founding Director, STFA Defense Elec-
tronic Corp., Turkey (1986–1996); Professor, Chair, Defense Elec-
tronics, Director, Technology and Science School, Istanbul Uni-
versity (1990–1996); Founding President of Is¸ık University, Istan-
bul, Turkey (1996–2004); Chief Advisor to Prime Ministry Office,
Turkey (1996–2000); Chairman of the Science Commission, Turk-
ish Rail Roads, Ministry of Transportation (2004). He obtained
the Young Turkish Scientist Award, National Research Council of
Turkey (NRCT) (1986); and Technology Award of NRCT (1987);
International Man of the Year in Science and Technology, Cam-
bridge Biography Center of U.K. (1998). He was a Member of the
Academy of Science of New York (1994), Fellow of IEEE. He is the
author of more than 100 papers, 4 US patents. Fields of interests
include design of matching networks and microwave amplifiers,
mathematical models for speech and biomedical signals. He has
been back to Istanbul University since October 2004 and spending
his sabbatical year of 2006–2007 at Tokyo Institute of Technology,
Tokyo, Japan.