Báo cáo hóa học: " Research Article A Biologically Motivated Multiresolution Approach to Contour Detection" doc
Bạn đang xem bản rút gọn của tài liệu. Xem và tải ngay bản đầy đủ của tài liệu tại đây (12.64 MB, 28 trang )
Hindawi Publishing Corporation
EURASIP Journal on Advances in Signal Processing
Volume 2007, Article ID 71828, 28 pages
doi:10.1155/2007/71828
Research Article
A Biologically Motivated Multiresolution Approach
to Contour Detection
Giuseppe Papari,
1
Patrizio Campisi,
2
Nicolai Petkov,
1
and Alessandro Neri
2
1
Institute of Mathematics and Computing Science, University of Groningen, P.O. Box 800, 9700 AV Groningen, The Netherlands
2
Dipartimento di Elettronica Applicata, Universit
`
a degli Studi di Roma “Roma Tre”, Via della Vasca Navale 84, 00146 Roma, Italy
Received 3 January 2006; Revised 3 November 2006; Accepted 3 November 2006
Recommended by Maria Concetta Morrone
Standard edge detectors react to all local luminance changes, ir respective of whether the y are due to the contours of the objects
represented in a scene or due to natural textures like grass, foliage, water, and so forth. Moreover, edges due to texture are often
stronger than edges due to object contours. This implies that further processing is needed to discriminate object contours from
texture edges. In this paper, we propose a biolog ically motivated multiresolution contour detection method using Bayesian de-
noising and a surround inhibition technique. Specifically, t he proposed approach deploys computation of the gradient at different
resolutions, followed by Bayesian denoising of the edge image. Then, a biologically motivated surround inhibition step is applied
in order to suppress edges that are due to texture. We propose an improvement of the surround suppression used in previous
works. Finally, a contour-oriented binarization algorithm is used, relying on the observation that object contours lead to long
connected components rather than to short rods obtained from textures. Experimental results show that our contour detection
method outperforms standard edge detectors as well as other methods that deploy inhibition.
Copyright © 2007 Giuseppe Papari et al. This is an open access article dist ributed under the Creative Commons Attribution
License, which permits unrestricted use, distribution, and reproduction in any medium, provided the original work is properly
cited.
1. INTRODUCTION
Contour detection is a fundamental operation in image pro-
cessing and computer vision which, despite of the large num-
ber of studies published in the last two decades, is still a fertile
field of ongoing research.
Many edge detectors have been proposed in the literature.
However, they react to all local luminance changes above a
given threshold, irrespective of their origin—object contours
or textures. Our goal is to isolate objects in a scene; therefore,
some further processing is needed beyond general-purpose
edge detection.
Examples of edge detectors proposed in previous works
are operators that incorporate linear filtering [1–5], lo-
cal orientation analysis [4, 6, 7], fitting of analyt ical mod-
els to the image data [8–11]. In [12], a simple energy
model is introduced to simulate perception of perceptu-
ally significant elements like lines and edges. Edge detec-
tors using local energy principles have also been proposed
in [13–16]. Since these operators do not make any dif-
ference between various types of edges, such as texture
edges versus object contours and region boundaries, they are
known as noncontextual or, simply, gener al edge detectors
[17].
Other studies propose more elaborate edge detection
techniques that take into account additional information
around an edge, such as local image statistics, image topol-
ogy, perceptual differences in local cues (e.g., texture, color),
edge continuity and density. Examples are dual frequency
band analysis, statistical analysis of the gradient field [18, 19],
anisotropic diffusion [20–23], complementary analysis of
boundaries and regions [24–26], use of edge density infor-
mation [9] and biologically motivated surround modulation
[27–30]. These operators are not aimed at detecting all lumi-
nance changes in an image but rather at selectively enhanc-
ing only those of them that are of interest in the context of
a specific computer vision task, such as detecting outlines
of tissues in medical images, object contours in natural im-
age scenes, and boundaries between different texture regions.
Such methods are usually referred to as contextual edge de-
tectors.
Psychophysical studies on the human visual system
(HVS) have given rise to biologically motivated edge detec-
tors [3, 14, 16, 31]. In its early stages, the HVS deploys special
2 EURASIP Journal on Advances in Signal Processing
mechanisms to differentiate between isolated edges, such as
object contours and region boundaries, on the one hand, and
edges in groups, such as those in textures, on the other hand.
Various psychophysical studies have shown that the percep-
tion of an oriented stimulus, for example, a line segment, can
be influenced by the presence of other such s timuli (distrac-
tors) in its neighborhood. This influence can, for instance,
manifest itself in the decreased saliency of a contour in pres-
ence of surrounding texture [32, 33], in the orientation con-
trast pop-out effect [34], or in the decreased visibility of let-
ters, object icons, and bars embedded in texture [30, 35].
These visual perception effects are in agreement with the re-
sults of neurophysiological measurements on neural cells in
the primary visual cortex. These studies show that the re-
sponse of an orientation selective visual neuron to an optimal
bar stimulus in its classical receptive field is reduced by the
addition of other oriented stimuli to the surround [36–38].
Neurophysiologists refer to this effect as nonclassical recep-
tive field (non-CRF) inhibition [37, 38] or, equivalently, sur-
round suppression [39]. Statistical data [37–39] reveals that
about 80% of the orientation selective cells in the primary
visual cortex show this inhibitory effect. In approximately
30% of all orientation selective cells, surround stimuli of ori-
entation that are orthogonal to the optimal central stimu-
lus have a weaker suppression effect than stimuli of the same
orientation. In 40% of the cells, the suppression effec t mani-
fests itself irrespective of the relative orientation between the
surrounding stimuli and the central one. In [27, 30], it is
suggested that the biological utility of surround suppression
is enhancement of object contours i n natural images rich
in background texture. This mechanism has been shown to
improve the contour detection performance of biologically
motivated [26]andconventional[40]edgedetectionalgo-
rithms.
Other psychophysical studies [41] on the HVS have
shown that image perception can be divided in two subse-
quent stages: the preattentive stage and the attentive stage.
In the first one, which lasts the first 0.1
÷ 0.3s after anim-
age is projected on the retina, coarse scale information is
perceived, whereas in the latter, details are identified. Some
psychophysical experiments [42] indicate that the visual in-
formation in different frequency bands is processed sepa-
rately. Therefore it is assumed that the retinal image is de-
composed through bandpass filters, which give rise to a
multichannel model [43]. Psychophysical validation of mul-
tiresolution scheme based on a local energy model is pro-
vided in [44]. These psychophysical studies suggest us to
perform contour detection in a multiresolution framework
[43, 45, 46].
Contour detection becomes an even more challenging
task when noisy images are involved. It is well known [18]
that edge extraction operators enhance noise at high-spatial
frequencies. Therefore, denoising needs to be deployed.
Within this framework, the definition of a pr i ori probabil-
ity model for both the noise and for images is of great im-
portance. However, modeling the statistics of natural im-
ages is a difficult task, due to the image nonstationarity. Se v-
eral attempts to model image statistics in transform domains
have been recently performed. Denoising algorithms operat-
ing in the wavelet domain have been proposed in [40, 47–52].
Specifically, in [40, 51, 52] it is assumed that the wavelet co-
efficients within a local neighbor hood are characterized by a
Gaussian scale mixture (GSM). In [53] an image denoising
method based on an image representation in the edge do-
main and on the Bayesian estimation of the original feature
is provided. Parametric probabilistic models based on Gaus-
sian mixtures are adopted for both signal and noise edge fea-
tures. Such a model is taken into account in the current study
to design a Bayesian denoising step that is applied to the gra-
dient image and that leads to an orientation-dependant zero-
memory nonlinearity.
In this paper, we propose a novel, biologically moti-
vated, multiresolution contour detector which makes use of
Bayesian denoising and of an improved surround inhibi-
tion technique. Within the framework of this paper the term
contour is used to represent a line delimiting an object or
part of it in a scene. This is a more sophisticated concept
than edge which represents a not negligible local luminance
change. Therefore, in our approach, contour detection is a
global concept related to the recognition of meaningful ob-
jects. Specifically, the proposed method consists in the com-
putation of the gradient at different resolutions, followed by
Bayesian denoising of the edge image. Within this framework
both the a priori first-order probability density function of
the edge image and of the noise are modeled as a mixture of
Gaussian distributions. This approach allows us to robustly
estimate the image gradient. Then, a biologically motivated
surround inhibition step is applied in order to suppress the
edges due to texture. When surround inhibition is applied
in the way proposed in [27, 30, 54], object contours are also
partially suppressed in a self-inhibition process. We propose
a new inhibition scheme that overcomes this problem and al-
lows more effec tive inhibition of texture edges. Finally, a bi-
narization algorithm is used that operates on connected edge
components and relies on the observation that true contours
lead to long connected components rather then to short rods
obtained from textures.
The paper is organized as follows. In Section 2, the pro-
posed approach is described in detail for the single-scale case.
Then it is generalized in Section 3 to the multiscale case. In
Section 4 experimental results are given. Finally, conclusions
are drawn in Section 5.
2. SINGLE-SCALE CONTOUR DETECTOR
The proposed single-scale contour detector is sketched in
Figure 1,whereI
={I(x, y)} represents the original im-
age, I
w
={I
w
(x, y)} is its observed version corrupted by
an additive independent observation noise W
={w(x, y)},
I
w
= I + W,and∇
σ
I
w
={∇
σ
I
w
(x, y)}=∇
σ
I + ∇
σ
W is the
scale-dependent gradient of the noisy image, computed as
described in Section 2.1. A Bayesian denoising algorithm, de-
scribed in Section 2.2, is applied on the gradient of the noisy
image, followed by a surround inhibition step for texture
suppression (Section 2.3). In Section 2.4, a contour-based bi-
narization algorithm is described.
Giuseppe Papari et al. 3
I
w
(x, y)
σ
I
w
(x, y)
σ
I(x, y) c
σ
(x, y) b
σ
(x, y)
Gradient
computation
Bayesian
denoising
Surround
inhibition
Binarization
Figure 1: Flowchart of the proposed single-scale contour detector.
The mathematical operator that gives the binary contour
map b
σ
(x, y) detected at the resolution σ from the origi-
nal image I
w
(x, y)willbereferredasRDCD
σ
(resolution-
dependant contour detector):
b
σ
(x, y) = RDCD
σ
I
w
(x, y)
. (1)
In the notation of this section, we will use the subscript σ
to indicate the dependence of the introduced quantities and
operators on the resolution parameter σ.
2.1. Scale-dependent gradient
Given the (noisy) input image I
w
(x, y), the first step toward
the estimation of its contours is the computation of a scale-
dependent gradient
∇
σ
I
w
(x, y), defined as follows:
∇
σ
I
w
(x, y) =∇
I
w
∗ g
σ
(x, y)
=
⎡
⎢
⎢
⎢
⎣
I
w
∗
∂g
σ
∂x
(x, y)
I
w
∗
∂g
σ
∂y
(x, y)
⎤
⎥
⎥
⎥
⎦
,
(2)
where the image I
w
(x, y) is convolved with the x and y
derivatives of a Gaussian function [1]:
g
σ
(x, y) =
1
2πσ
2
e
−(x
2
+y
2
)/2σ
2
. (3)
The operator
∇
σ
defined in (2)and(3) depends on the pa-
rameter σ, that we will call the scale or resolution parameter.
Gradient computation according to (2) depends on the scale
parameter σ: the larger its value, the larger the spatial extent
of the intensity transitions (blur) to which the operator re-
sponds.
2.2. Bayesian denoising
A Bayesian estimate
∇
σ
I of ∇
σ
I,given∇
σ
I
w
, is obtained
by the minimization of the associated absolute risk. There-
fore, our goal is the minimum mean square error (MMSE)
estimation of the edge image
∇
σ
I ={∇
σ
I(x, y)},givenby
the a posteriori expectation
∇
σ
I ={∇
σ
I(x, y)} of ∇
σ
I =
{∇
σ
I(x, y)},given∇
σ
I
w
={∇
σ
I
w
(x, y)}. Neglecting resid-
ual spatial correlation, we propose a suboptimum estimation
procedure based only on the marginal a priori edge distribu-
tion. Thus, we evaluate the conditional expectation
∇
σ
I(x, y)
of
∇
σ
I(x, y)given∇
σ
I
w
(x, y)atsite(x, y) only. To this aim,
let us describe the marginal distribution of
∇
σ
I(x, y)witha
rather general model constituted by a Gaussian mixture, that
is, a weighted sum of Gaussian distributions:
p
∇
σ
I
∇
σ
I(x, y)
=
K
i=1
λ
i
N
2
∇
σ
I(x, y), 0, R
∇
σ
I
i
(x, y)
,(4)
where N
2
[χ, μ, R] denotes the Gaussian probability density
function (p.d.f.) of a bivariate random variable f with expec-
tation m and covariance matrix R:
N
2
[f, m, R]
=
1
2π
det(R)
1/2
exp
−
1
2
(f
− m)
T
R
−1
(f − m)
.
(5)
As to the gradient of the observation noise, we model
again the p.d.f. of the random variable
∇
s
W(x, y)asazero
mean Gaussian mixture with mixing parameters β
j
,namely,
p
∇
σ
W
∇
σ
W(x, y)
=
M
j=1
β
j
N
2
∇
σ
W(x, y), 0, R
∇
σ
W
j
(x, y)
.
(6)
Derivation of the suboptimum Bayesian estimator based on
edges requires the calculation of the a posteriori p.d.f. of
∇
σ
I(x, y)given∇
σ
I
w
(x, y). Applying Bayes rule and drop-
ping the location (x, y) for the sake of compactness we ob-
tain
p
∇
σ
I/∇
σ
I
w
∇
σ
I/∇
σ
I
w
=
p
∇
σ
I
w
/∇
σ
I
∇
σ
I
w
/∇
σ
I
p
∇
σ
I
∇
σ
I
p
∇
σ
I
w
/∇
σ
I
∇
σ
I
w
/∇
σ
I
p
∇
σ
I
∇
σ
I
d
∇
σ
I
(7)
=
M
j
N
i
β
j
λ
i
N
2
∇
σ
I
w
, ∇
σ
I, R
∇
σ
W
j
N
2
∇
σ
I,0,R
∇
σ
I
i
M
j
N
i
β
j
λ
i
N
2
∇
σ
I
w
, ∇
σ
I, R
∇
σ
W
j
+ R
∇
σ
I
i
.
(8)
The evaluation of the conditional expectation
∇
σ
I(x, y)=
E[∇
σ
I(x, y)/∇
σ
I
w
(x, y)] associated with (8)canbewritten
as
∇
σ
I(x, y)
= ZNL
∇
σ
I
w
(x, y)
=
M
j=1
N
i=1
η
ij
∇
σ
I
w
(x, y)
R
∇
σ
I
i
(x, y)
×
R
∇
σ
W
i
(x, y)+R
∇
σ
I
i
(x, y)
−1
∇
σ
I
w
(x, y),
(9)
where ZNL stands for zero-memory nonlinear ity, and
η
ij
∇
σ
I
w
(x, y)
=
β
j
λ
i
N
2
∇
σ
I
w
(x, y), 0, R
∇
σ
W
j
(x, y)+R
∇
σ
I
i
(x, y)
M
j
N
i
N
2
∇
σ
I
w
(x, y), 0, R
∇
σ
W
j
(x, y)+R
∇
σ
I
i
(x, y)
.
(10)
Equation (9) says that in general, for signal and noise
Gaussian mixtures, the MMSE estimator is a nonlinear com-
bination of conditionally optimal linear estimators, with
4 EURASIP Journal on Advances in Signal Processing
AC
B
(a)
a
(b)
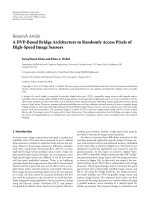
Figure 2: The inhibition term for a given point is computed by weighted summation of the response in the shaded surroundings of that
point. (a) The annular surround proposed in [27, 30, 54]iseffective for dense texture areas (point B) but leads to undesirable partial self-
inhibition of isolated edges (point A) and considerable inhibition of texture region boundaries (point C). (b) In the current paper, the
inhibition surround is split into two truncated half-ring s oriented along the concerned edge and the inhibition term is computed as the
minimum of the two weighted averages of M
σ
(x, y) on these two truncated half-rings.
gains R
∇
σ
I
i
(x, y)(R
∇
σ
W
i
(x, y)+R
∇
σ
I
i
(x, y))
−1
each matched
to a pair (x, y) of Gaussian submodels. The weights
η
ij
[∇
σ
I
w
(x, y)] represent the posterior probabilities of each
submodel pair.
2.3. Surround inhibition
2.3.1. Previous work
Next, following [54], we deploy a surround inhibition mech-
anism that takes into account the context influence of the
surroundings of each point. It consists in computing an in-
hibition term as an integral of the gradient magnitude in the
surroundings of a point and subtracting this term from the
gradient magnitude in the concerned point. The inhibition
term is supposed to be large in textured areas and low on
object contours thus leading to the suppression of texture
while retaining contours. This operator is motivated by psy-
chophysical and neurophysiological findings (see [26]forar-
guments and further references).
Let M
σ
(x, y) be the gradient magnitude:
M
σ
(x, y) =
∇
σ
I(x, y)
=
I ∗
∂g
σ
∂x
(x, y)
2
+
I ∗
∂g
σ
∂y
(x, y)
2
.
(11)
In [54], the inhibition term T
σ
(x, y) is defined as the weight-
ed local average of M
σ
(x, y) on a ring around each pixel and it
is computed as the convolution of M
σ
(x, y) and a weighting
function w
σ
(x, y):
t
σ
(x, y) =
M
σ
∗ w
σ
(x, y). (12)
The weighting function w
σ
(x, y), according to [27, 30, 54],
is a half-wave rectified and L
1
-normalized difference of two
concentric Gaussian functions:
DoG
σ
(x, y) =
g
kσ
(x, y) −g
σ
(x, y)
+
w
σ
(x, y) =
DoG
σ
(x, y)
R
2
DoG
σ
(x, y)dx dy
,
(13)
where
|·|
+
denotes h alf-wave rectification,
|ξ|
+
=
⎧
⎨
⎩
ξ, ξ ≥ 0,
0, ξ<0.
(14)
The support of w
σ
(x, y) defines the annular surround of a
point on which the gradient magnitude is integrated, thus
obtaining the value of the inhibition term for that point
(Figure 2(a)). The central region that is excluded from the
inhibition term computation is the essential support of the
gradient operator. It can be considered as an analogue of the
classical receptive field (CRF) of an orientation selective neu-
ron in the primary visual cortex. The annular area around it
can be considered as the surround of that CRF. The radius ρ
0
of the concerned central region is given by
ρ
0
(k) = 2σ
ln k
1 − 1/k
2
(15)
and is a slowly changing function of the parameter k.For
instance, for k
= 4, we have ρ
0
∼
=
2.5σ. The weighting func-
tion w
σ
(x, y) is essential in a region of radius kρ
0
(k), thus
the radius of the annular surround is roughly k times larger
than the radius of the central (CRF) region. In our exper-
iments we take the value k
= 4, corresponding to an in-
hibition surround being several times larger (in diameter)
than the classical receptive field of visual neurons that ex-
hibit surround modulation [36]. Our experiments show that
the performance of the proposed method does not depend
significantly on the value of this parameter: for values of k
between 3 and 6, the performance change is negligible (see
Section 4.2.2).
The inhibition term computed in this way will be large
for points in whose surroundings there are multiple edges,
such as point B in Figure 2(a). In contrast, it will be small for
points along isolated edges, such as point A in Figure 2(a).
Therefore, subtraction of this term from the gradient magni-
tude leads to texture suppression while leaving isolated con-
tours relatively unaffected. The result c
σ
(x, y) of the inhibi-
tion is computed as follows:
c
σ
(x, y) =
M
σ
(x, y) −αt
σ
(x, y)
+
. (16)
Giuseppe Papari et al. 5
The coefficient α, called inhibition strength, specifies the ex-
tent to which the inhibition term is taken into account. De-
pending on the value of α, the inhibition term can partially
or completely suppress the response of the operator to tex-
ture edges. For this type of surround suppression, we choose
the value of the inhibition coefficient α to be such that the
following equation is fulfilled at the points of maximum of
M
σ
(x, y), when the input image is a bar grating of bar spac-
ing and bar width ρ
0
:
M
σ
(x, y) = αt
σ
(x, y). (17)
The radius ρ
0
of the “receptive field” of the gradient operator
is chosen to be equal to the bar spacing and bar width so
that only one edge is visible in that field. This is the smallest
value of α for which the operator will not respond to a texture
input defined by such a bar grating. The idea is not only to
suppress texture but to minimize the partial suppression of
isolated edges and contours. The inhibition strength value
which satisfies these conditions is α
= 1.59.
However, this straightforward inhibition process has two
drawbacks.
(1) While being small, the inhibition term is not zero on
isolated edges because parts of such an edge fall in the
inhibition surround of other parts of the same edge,
see point A in Figure 2(a). We refer to this effect as self-
inhibition.
(2) Edges at texture borders, such as point C in Fig-
ure 2, are considerably inhibited as well, which is
not desirable with respect to the detection of region
boundaries.
2.3.2. Improved inhibition scheme
In this paper we propose a modification of the inhibition
scheme that does not suffer the above-mentioned drawbacks.
The idea is to exclude from the annular surround of a point
a band region of width 2a oriented along the edge, as shown
in Figure 2(b). We define the inhibition term T
σ
as the min-
imum of the two weighted local averages of M
σ
(x, y)on
the two resulting half-rings. More specifically, we define two
weighting functions w
+
σ,φ
(x, y)andw
−
σ,φ
(x, y):
DoG
+
σ,φ
(x, y) = DoG
σ
(x, y) ·U(x cos φ + y sin φ − a),
DoG
−
σ,φ
(x, y) = DoG
σ
(x, y) ·U(a − x cos φ − y sin φ),
w
±
σ,φ
(x, y) =
DoG
±
σ,φ
(x, y)
R
2
DoG
±
σ,φ
(x, y)dx dy
,
(18)
where φ
∈ [0, π) is a generic orientation and U is the step
function defined as follows:
U(ξ)
=
⎧
⎨
⎩
0, ξ<0,
1, ξ
≥ 0.
(19)
ϑ
σ
(x, y)
M
σ
(x, y)
min min min min
Orientation selector
T
σ
(x, y)
Figure 3: Computation scheme of the inhibition term. For each
pixel of the image, inhibition terms are computed for a number of
different orientations. Then the gradient orientation information is
used to select the appropriate value at each pixel.
Then, we define and compute the modified inhibition term
as follows:
T
σ
(x, y) = min
M
σ
∗ w
+
σ,φ
(x, y),
M
σ
∗ w
−
σ,φ
(x, y)
,
(20)
where ϑ(x, y) is the orientation of
∇
σ
I(x, y).
In practice, we compute the convolutions in (20)fora
discrete set of orientations
{φ
i
}
N
φ
i=1
, φ
i
= π((i −1)/N
φ
), as
shown in Figure 3 for N
φ
= 4, and then, for each pixel, we
use the result obtained for the angle that is closest to the
gradient orientation ϑ
σ
(x, y) for that pixel. Our experiments
show that (above a certain reasonable minimum of N
φ
= 4)
the number of orientations used does not substantially influ-
ence the performance of the contour detection operator (see
Section 4.2.2).
The exclusion of the central band region avoids the self-
inhibition and is motivated by neurophysiological studies
[36] according to which, inhibitory modulation originates
from the regions flanking the receptive field of an orienta-
tion selective neuron on both sides of the optimal stimu-
lus for that neuron. The parameter a controls the width of
the excluded band region and we set it to be a fraction η
of the radius ρ
0
, a = ηρ
0
. Our experiments show that for
values of η around 1 the exact choice of η is not critical for
the performance of our algorithm (see Section 4.2.2). There-
fore, we use η
= 1 in the following. As to the specific choice
of the minimum function used in (20), at the current mo-
ment, this is a pure design consideration. A certain neuro-
physiological justification for this choice can be sought for
by the fact that the inhibition surround of a neuron need
not be circular symmetric. For instance, only 23% of cells
in area MT/V5 show circular symmetrical surrounds while
45% of the cells have asymmetrical surrounds [55]. In this
context (20) can be considered as a maximum value combi-
nation of two surround suppression operators with opposite
asymmetrical surrounds as defined by the half-rings shown
in Figure 2(b). The result is a computation of a directional
derivative of the gradient magnitude in direction of the gra-
dient and can be used for effectively detecting region bound-
aries for the gradient magnitude as illustrated by Figure 2(b).
6 EURASIP Journal on Advances in Signal Processing
(a) (b)
(c) (d)
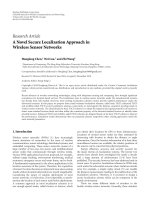
Figure 4: (a) A test image elephant and edge strength computed as (b) the gradient magnitude, (c) the gradient magnitude with surround
inhibition according to the traditional annular surround method [54] with α
= 1.59, and (d) the gradient magnitude with surround inhibi-
tion according to the split-surround method proposed in this paper with α
= 3. For a better representation, the three edge images have been
equalized and shown in negative, thus white pixels correspond to the value zero.
Theedgestrengthc
σ
(x, y) is computed similar to (16),
with the inhibition term T
σ
(x, y) according to (20),
c
σ
(x, y) =
M
σ
(x, y) −αT
σ
(x, y)
+
. (21)
Figure 4 shows a test image elephant (Figure 4(a)) and three
gray level edge images representing the gradient magnitude
M
σ
(x, y) without surround inhibition (Figure 4(b)), the edge
strength c
σ
(x, y) computed according to the previous inhibi-
tion scheme [54](Figure 4(c)), and the edge strength c
σ
(x, y)
computed according to the improved inhibition scheme pro-
posed here (Figure 4(d)). Since no self-inhibition is involved
in the proposed modified inhibition scheme, a higher value
of the parameter α can be used without destroying weak
edges. In this way texture can be suppressed more effectively.
2.4. Binarization
Similar to other methods for edge and contour detection, the
last step of the algorithm comprises edge thinning by non-
maxima suppression and binarization by thresholding . Tra-
ditional thresholding techniques, such as global or hysteresis
thresholding [3], cannot deal adequately with texture edges
that present stronger gradient magnitude values than con-
tours, Figure 5.
In this paper we present a new thresholding algorithm,
based on the observation that object contours lead to long
and wide connected components of nonzero pixels, while
texture edges, especially after surround inhibition, lead to
relatively short and thin components. Specifically, we apply
nonmaxima suppression to the signal c
σ
(x, y). Let u
σ
(x, y)
be the unit vector parallel to the gradient
∇
σ
I(x, y), that is,
∇
σ
I(x, y) = M
σ
(x, y)u
σ
(x, y); we consider the set S
σ
of all
points which are local maxima of c
σ
(x, y) in the direction of
u
σ
(x, y):
S
σ
=
(x, y)
∂c
σ
∂u
σ
= 0 ∧
∂c
σ
∂u
σ
< 0
. (22)
Let C
(σ)
k
, k = 1, , N
c
, be the connected components of the
set S
σ
,
S
σ
=
k
C
(σ)
k
, (23)
Giuseppe Papari et al. 7
(a) (b)
Figure 5: (a) Gray level contour image c
σ
(x, y) obtained after surround inhibition. (b) Result of traditional binarization comprising thinning
by nonmaxima suppression and thresholding. Some contour pixels are weaker than some texture edges and it is not possible to select a
threshold that retains the former while eliminating the latter.
(a) (b)
Figure 6: Results of binarization by (a) traditional thresholding and (b) the proposed connected component weight thresholding.
where N
c
is the number of such components. We apply a
morphological dilation to C
(σ)
k
[56, 57], with a 3×3squareq
3
as structuring element, and obtain dilated components D
(σ)
k
:
D
(σ)
k
= C
(σ)
k
⊕ q
3
. (24)
For each connected component C
(σ)
k
, we introduce a quantity
G
(σ)
k
,whichwecallglobal contour weight, defined as the sum
of the values of c
σ
(x, y) over the dilated component D
(σ)
k
:
G
(σ)
k
=
(x,y)∈D
(σ)
k
c
σ
(x, y). (25)
We compute a binary contour map b
σ
(x, y) by setting to 1
the value of the pixels from all connected components C
(σ)
k
whose contour weights G
(σ)
k
are above a given threshold G
min
:
b
σ
(x, y) =
⎧
⎪
⎪
⎨
⎪
⎪
⎩
1, (x, y) ∈
G
(σ)
k
>G
min
C
(σ)
k
,
0, otherwise.
(26)
The result of this type of thresholding compared to tradi-
tional thresholding is shown in Figure 6. Low-contrast con-
tours are successfully detected and, most importantly, con-
tours are not depleted by the binarization process.
Since the value of the contour strength G is related to the
length of the contours of the object represented in an image,
the value of the threshold G
min
should be proportional to the
linear size of the image. In our experiments, performed on
images of size 512
× 512 pixels, we found empirically that
connected components that contain less than 7 pixels are too
small to be part of an object contour. Therefore, unless a dif-
ferent value is specified, in our experiments we set the value
of the threshold to G
min
= 7. In Section 4 we will discuss
quantitatively the dependence of the performance of the al-
gorithm with respect to the value of G
min
.
A similar connected component thresholding method
has been proposed in [58]. However, in our computational
experiments we found out that without surround inhibi-
tion this thresholding technique gives bad results. The rea-
son is that if the set S
σ
of the nonzero pixels of the gradi-
ent after non-maxima suppression is computed directly from
the gradient magnitude without surrounding inhibition, the
8 EURASIP Journal on Advances in Signal Processing
b
1
(x, y)
(a)
b
2
(x, y)
Destroyed junction
(b)
Superposition of b
1
(x, y)andb
2,DIL
(x, y)
(c)
b
1
(x, y) AND b
2,DIL
(x, y)Restoredjunction
(d)
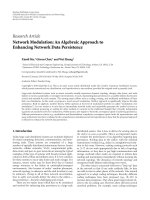
Figure 7: (a), (b) Binary contour maps b
1
(x, y)andb
2
(x, y) obtained with the RDCD operator introduced in Section 2, with σ = 1and
σ
= 2, respectively. At the finer scale the borders are detected at their respective positions, but some texture is present; at the coarser scale,
texture is reduced but the contours are shifted and some junctions are destroyed. (c) Superposition of the contour map at the fine scale
(shown in black) and the morphologically dilated contour map at the coarse scale (rendered in a gray), and (d) the result of their logic AND.
Texture is reduced, contours are well detailed, and the morphological dilatation restores the junctions.
result includes many large tangled connected components of
nonzero pixels that originate from noisy image regions. Such
components have high contour strength values and cannot
be eliminated by the proposed thresholding scheme. In con-
trast, surround inhibition breaks such connected compo-
nents into pieces that are small enough and consequently
have small contour strengths and can effectively be removed
by thresholding.
3. MULTISCALE CONTOUR DETECTOR
It is well known from multiresolution wavelet analysis [43]
that coarser scales contain only the general morphology of
the image where most of the high-frequency texture details
disappear. This fact is illustrated in Figures 7(a) and 7(b),
displaying two binary contour maps b
1
(x, y)andb
2
(x, y)ob-
tained with the RDCD operator defined above for σ
= 1and
σ
= 2, respectively. From Figure 7(a) we can see that the con-
tours detected at the fine scale (σ
= 1) are detected at their
correct positions and the junctions are preserved, but at the
same time much texture is present. When a coarser scale is
used (σ
= 2, Figure 7(b)), some texture is removed, but the
contours are shifted away from their true positions [59], es-
pecially at positions of high curvature, and some junctions
are destroyed by the nonmaxima suppression [60].
In order to exploit the advantages of both resolutions we
superpose the two binary images and we select from b
1
(x, y)
only those “1” pixels that are close enough to “1” pixels
of b
2
(x, y). More specifically, we first apply a morphologi-
cal dilation operator with a disk of radius 3σ as structuring
element on the edge map b
2
(x, y) at the coarse scale and
we denote the result by b
2,DIL
(x, y). Figure 7(c) shows the
Giuseppe Papari et al. 9
I
w
(x, y)
Single scale
contour detector (σ
1
)
Single scale
contour detector (σ
2
)
.
.
.
Single scale
contour detector (σ
N
)
b
1
(x, y)
b
2
(x, y)
b
N
(x, y)
Finest scale
Coarsest
scale
Morphological
dilation
Morphological
dilation
b
2,DIL
(x, y)
b
N,DIL
(x, y)
AND
b
out
(x, y)
Figure 8: Overall scheme of our multiscale contour detector, where each block “single-scale contour detector” implements the RDRC
operator with a different scale parameter σ
i
.
superposition of b
1
(x, y)andb
2,DIL
(x, y). The object con-
tours, well detailed and localized in b
1
(x, y), are contained
in b
2,DIL
(x, y); on the contrary, most of the texture present
in b
1
(x, y)isnotpresentinb
2,DIL
(x, y). Consequently, the
logic AND of b
2,DIL
(x, y)andb
1
(x, y) shown in Figure 7(d)
has well-detailed contours similar to b
1
(x, y) and less tex-
ture edges similar to b
2,DIL
(x, y). The mor phological dilation
compensates for the contour shifting at the coarse scale and
restores the junctions.
In our a pproach we apply an N-level multiscale analysis
in order to remove the residual spurious texture still present
in Figure 7(d). This algorithm relies on the observation that
starting from a given scale that is determined by the object
blur, object contours are present in the results at all scales,
while texture appears only at the finer scales. Referring to the
scheme shown in Figure 8, we first compute the binary con-
tour maps b
k
(x, y)atN different scales:
b
k
(x, y) = RDCD
σ
k
I
w
(x, y)
, k = 1, , N. (27)
Then we apply morphological dilation to all binary maps but
the one that corresponds to the finest scale:
b
k,DIL
= b
k
⊕ D
3σ
, k = 2, , N, (28)
where we use as a structuring element a disk D
3σ
of radius 3σ.
The final output is obtained by the logic AND of the binary
maps at all resolutions:
b
out
= b
1
(x, y) ·
N
k=2
b
k,DIL
(x, y). (29)
In the previous discussion, the scale values σ
k
have been con-
sidered as input parameters. Simple general considerations
about the noise levels allow us to compute them automati-
cally, thus making the algorithm unsupervised in this respect.
The idea is that the only new information carried by the finer
resolution channels with respect to the coarser ones is the
details of the contours. However, when noise is present, hu-
man observers are not able to distinguish details of the con-
tours and only the general shape of the objects is perceived
(Figure 9(b)). Consequently, for noisy images the informa-
tion carr ied by the edge maps at the finest resolutions can be
discarded [58, 61].
With this idea in mind, we perform a preliminary estima-
tion of the noise level and use it to determine the value of σ
1
of the finest scale, which must be larger the larger the noise is.
It can be easily proved that, when the gradient is smoothed
by a Gaussian mask g
σ
(x, y), the noise reduction is given by
N
out
N
in
=
erf
πσ
√
2
σ
√
π
, (30)
where N
in
and N
out
are the noise levels before and after the
smoothing, and
erf(x)
=
1
√
2π
x
0
e
−t
2
/2
dt. (31)
Therefore, once the noise level N
est
of the input image has
been estimated, the value of σ
1
can be obtained by solving
(30), where N
in
is set equal to N
est
,andN
out
is set to a fixed
value, above which contours cannot be detected reliably any-
more. We compute the value σ
i
for the ith resolution as fol-
lows:
σ
i
= σ
1
· 2
i−1
, i = 1, , N. (32)
4. EXPERIMENTAL RESULTS
In this section some experimental results are presented and
discussed. The performance of the proposed contour de-
tector is compared with the performance of four other
existing algorithms: the standard single-scale Canny edge
detector [1], a modification
1
of the multiscale edge detec-
tor CARTOON [45], the single-scale surround inhibition
(SSSI) contour detector proposed in [54], and the multiscale
1
In the orig inal CARTOON method as proposed in [45], only two values of
σ are used and the edges are detected using the Laplacian of Gaussian filter
(LoG). On the other hand, the multiscale algorithms proposed here and
in [46] make use of multiple resolutions and detect edges by means of the
gradient of Gaussian filter. In order to do a fair comparison between the
proposed method and the CARTOON approach, we have reimplemented
CARTOON by using the gradient of Gaussian filter for detecting edges
and by using the same values of σ that are used in the other multiscale
approaches discussed in this paper.
10 EURASIP Journal on Advances in Signal Processing
surround inhibition (MSSI) contour detector proposed in
[46]. We performed experiments on a set of 40 images us-
ing both noiseless (SNR
=∞) and noisy i mage versions cor-
rupted by additive noise with SNR equal to 10 dB, 13 dB, and
16 dB.
4.1. Qualitative comparison
Some exper imental results are shown in Figures 9–22 for
both noiseless images and images corrupted by additive noise
of SNR
= 13 dB. A larger set of examples is available on
/>∼imaging. We would like to stress that
we used the same set of parameter values for all images in
the dataset as follows: inhibition strength α
= 3, binari zation
threshold G
min
= 7, ratio of the two standard deviations in
DoG k
= 4, number of orientations for computing the inhi-
bition term N
φ
= 4, number of scales N = 3, radius of the
structuring element used for dilation r
σ
= 3σ, and noise am-
plitude N
out
equal to 8% of the average standard devi ation of
the input image, computed across all images.
SSSI [54] applies surround inhibition in a single-scale
context. The modification of CARTOON [45] that we use
here operates in a multiresolution framework without apply-
ing surround inhibition. MSSI [46] uses the surround inhibi-
tion scheme proposed in [54] in a multiscale framework. The
approach proposed here is an improvement of MSSI using
Bayesian denoising, a modification of the inhibition term,
and a new binarization scheme.
We can see that the approach proposed in this paper out-
performs the other algorithms in terms of cleanness of the
detected contours, amount of suppressed texture, and ro-
bustness to noise. In particular, the results for the test images
rhino and frog (Figures 11–14) show the ability of our al-
gorithm to suppress texture while effectively detecting weak
edges in low-contrast images. On the other hand, the results
for the test image bear1 (Figures 15-16) show the ability of
the proposed method to suppress high-contrast oriented tex-
ture like the fur of the bear. All the other studied algorithms
but MSSI completely fail in removing this type of texture.
Figures 17-18 show the behavior of our algorithm with re-
spect to low-frequency texture, like the plants in the back-
ground behind the bear. Such t ype of texture, well removed
by our contour detector (Figure 17(b)), can neither be sup-
pressed by SSSI techniques (Figure 17(d)), nor by simply
projecting the image on a coarse scale domain as CARTOON
and MSSI do. The simple combination of multiscale analy-
sis and surround inhibition also fails in this case. Finally, the
examples shown in Figures 19–22 illustrate the behavior of
our algorithm for images containing multiple objects of dif-
ferent sizes. It can be noted that some object details, like for
instance the windows of the building in Figure 19(a),arede-
tected by the single-scale contour detectors, but not by the
multiscale ones. Indeed, whether they should be considered
object contours or texture to be suppressed depends on the
specific application. For instance, in the ground truth pro-
vided in the Berkeley image dataset [62] such details are not
considered as object contours.
By comparing the results of the modification of CAR-
TOON (Figures 9–22(e)), SSSI (Figures 9–22(d)), and MSSI
(Figures 9–22(f)), we can see that multiscale analysis and
surround inhibition play complementary roles: the combi-
nation of the two approaches gives much better results than
those obtained by each of them separately. The Bayesian de-
noising step, the modified computation of the inhibition
term, and the contour-oriented binarization technique in-
troduced here further improve the quality of the obtained
results: the residual texture placed in the neighborhood of
contours, still present when applying MSSI (especially well
visible in Figures 11(f) and 15(f)), disappears by applying
the proposed approach. Also the residual noise present when
applying MSSI is removed by our approach. Figure 23 il-
lustrates the effectiveness of the Bayesian denoising step in-
troduced in Section 2.2 for the noisy test image elephant
shown in Figure 10(a) (SNR
= 13 dB). If the entire pro-
cess explained in Sections 2 and 3 had been applied with-
out the Bayesian denoising step, we would get the out-
put shown in Figure 23(a). It is definitely worse than the
output obtained with the algorithm proposed in this pa-
per, where the Bayesian denoising step is performed at all
resolutions (Figure 23(b)).
4.2. Quantitative performance evaluation
4.2.1. Metric definition
Methods for performance evaluation of edge detectors can
be categorized as using either synthetic or natural images,
with or without specified g round truth, [18, 63]. When the
ground truth is given, performance evaluation can be readily
carried out by comparing detected contours with the ground
truth edges. Although synthetic images allow precise objec-
tive definition of ground t ruth and seem appropriate for
any performance evaluation criterion, the conclusions drawn
in most of the cases are not easily extrapolated for natural
scenes [17]. Additional qualitative metrics such as smooth-
ness, continuity, thinness, which may sometimes be com-
puted in absence of the ground truth, do not always prop-
erly reflect performance [64]. For these reasons, most of the
current evaluation methods use natural image scenes with
an associated ground truth specified by a human observer
[26, 40, 62, 64–66]. For a comprehensive list of performance
evaluation methods for edge detection we refer to [66].
Different human observers produce different ground
truth contour images for the same input image and a given
pixel can be marked by some observers as a contour pixel (of
value 1) and by others as a texture or background pixel (of
value 0). One way to deal with this fact is to use a superpo-
sition of the binary contour maps produced by different ob-
servers [62]. Here we apply an alternative approach in which
we asked 8 obser vers to mark the contours they see. Based on
their contour drawings we defined a weighted ground truth
in which a pixel (x, y) is assigned a weight γ(x, y)
= 1if5
or more out of the 8 observers drew a contour pixel within a
distance of 2 pixels and weight γ(x, y)
= 1/3 if this was done
by 3 or 4 observers, Figure 24.
Let DC be the set of points for which a given contour de-
tection operator outputs “1” and let GT be the set of points
for which γ(x, y) > 0. We define generalized recall R and
Giuseppe Papari et al. 11
(a) (b)
(c) (d)
(e) (f)
Figure 9: “Elephant” (512 ×512 pixels): (a) test image and contours detected using (b) the proposed approach, (c) the Canny edge detector
[1], (d) single-scale surround inhibition [54], (e) a modification of the multiscale edge detector CARTOON [45], and (f) a multiscale contour
detector with surround inhibition [46].
precision P as follows:
recall
=
(x,y)∈DC∩GT
γ(x, y)
(x,y)∈GT
γ(x, y)
,
precision
=
(x,y)∈DC∩GT
γ(x, y)
card{DC}
,
(33)
where card (X) is the number of elements of the set X.
In order to compensate for small shifts of contours de-
tected by an operator from ground truth contours, the inter-
section of GT and DC is computed as proposed in [30].
4.2.2. Results
For each of the five algorithms discussed above we evaluated
R and P for a set of 40 images and computed the averages
12 EURASIP Journal on Advances in Signal Processing
(a) (b)
(c) (d)
(e) (f)
Figure 10: Noisy elephant (SNR = 13 dB): (a) test image and contours detected using (b) the proposed approach, (c) the Canny edge detector
[1], (d) single-scale surround inhibition [54], (e) a modification of the multiscale edge detector CARTOON [45], and (f) a multiscale contour
detector with surround inhibition [46].
of the obtained values. We computed such averages for the
noiseless images (SNR
=∞) and for noisy versions of these
images (SNR
= 10 dB, 13 dB, and 16 B).
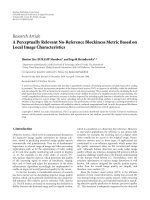
Figure 25(a) shows the results obtained whereby for each
algorithm and SNR we used the optimal parameter values
as specified in the respective references. As we can see, for all
SNR values our approach gives the best performance in terms
of texture suppression (e.g., P
= 0.74 for noiseless images,
SNR
=∞), while keeping a sufficient percentage of detected
true contour pixels (R
= 0.4 for noiseless images, SNR =∞).
By comparing our approach with the best of the other exist-
ing algorithms (MSSI) that we consider here, we see that the
proposed approach gives a significant advantage in terms of
increased precision (by a factor of at l east 2) while paying a
Giuseppe Papari et al. 13
(a) (b)
(c) (d)
(e) (f)
Figure 11: “Rhino” (512×512 pixels): (a) test image and contours detected using (b) the proposed approach, (c) the Canny edge detector [1],
(d) single-scale surround inhibition [54], (e) a modification of the multiscale edge detector CARTOON [45], and (f) a multiscale contour
detector with surround inhibition [46].
small price in terms of decreased recall (by only 20%–25%).
Canny algorithm gives good recall at the expense of a very
bad precision which means that in the resulting binary map
the true contours are buried in a binary texture noise (see,
e.g., Figures 11(c), 13(c), 15(c),and17(c)).
The proposed approach has also the best performance
in terms of noise rejection, since the value of the preci-
sion achieved by our approach with the most noisy test
images is higher than the one achieved by the other ap-
proaches for noiseless test images. The worst performance
in terms of precision is exhibited by the Canny edge de-
tector because this algorithm deploys no texture/noise sup-
pression mechanism. The modification of CARTOON and
SSSI provides approximately the same improvement, while
14 EURASIP Journal on Advances in Signal Processing
(a) (b)
(c) (d)
(e) (f)
Figure 12: Noisy Rhino (SNR = 13 dB): (a) test image and contours detected using (b) the proposed approach, (c) the Canny edge detector
[1], (d) single-scale surround inhibition [54], (e) a modification of the multiscale edge detector CARTOON [45], and (f) a multiscale contour
detector with surround inhibition [46].
SSSI performs slightly better for noiseless images but it is
more sensitive to noise. The use of the surround inhibition
scheme [54] in a multiscale framework as done in [46]pro-
vides a considerable performance increase in terms of preci-
sion.
It is worth pointing out that the relatively high values of
precision achieved by means of the proposed algorithm are
obtained at the expense of the loss of some contour details.
In this respect we have to note that the values of recall of the
other algorithms are over estimated due to noise or texture
pixels that are not suppressed and lie near true contours. This
is confirmed by the fact that the value of the recall increases
as the SNR decreases for all considered algorithms but the
one proposed here.
Giuseppe Papari et al. 15
(a) (b)
(c) (d)
(e) (f)
Figure 13: “Frog” (564×496 pixels): (a) test image and contours detected using (b) the proposed approach, (c) the Canny edge detector [1],
(d) single-scale surround inhibition [54], (e) a modification of the multiscale edge detector CARTOON [45], and (f) a multiscale contour
detector with surround inhibition [46].
The fact that with the proposed approach the recall value
decreasing with increasing noise is in agreement with the
property of the human visual system that tends to detect con-
tours less effectively in presence of noise [67].
Figure 25(b) shows the performance behavior of the pro-
posed algorithm for various values of the threshold G
min
(G
min
= 2.5, 5, 6, 7, 8,9, 10, 12.5). Finally, Figure 25(c) shows
the perfor mance of the Canny edge detector and the pro-
posed algorithm for a wide range of values of the respec-
tive binarization thresholds of these algorithms. Such plots
have been deployed in recent literature to study the perfor-
mance of boundary detection algorithms for a broad range
16 EURASIP Journal on Advances in Signal Processing
(a) (b)
(c) (d)
(e) (f)
Figure 14: Noisy frog (SNR = 13 dB): (a) test image and contours detected using (b) the proposed approach, (c) the Canny edge detector [1],
(d) single-scale surround inhibition [54], (e) a modification of the multiscale edge detector CARTOON [45], and (f) a multiscale contour
detector with surround inhibition [46].
of threshold values that leads to a broad range of recall and
precision values [62]. In this respect, we think that it is worth
to explore the threshold space only for values that lead to
some reasonably large values of the precision and recall as
illustrated in Figure 25(c).
We studied also how the performance is influenced by
the parameters related to the computation of the inhibition
term T
σ
introduced in Section 3 : the number of orienta-
tions N
φ
, the distance a between the two half-rings r
+
and
r
−
, and the ratio k between the standard deviations of the
two Gaussian functions of the inhibition weighting function
(14). Our experiments have shown that the overall perfor-
mance is not sensitive to the choice of these parameters. For
N
φ
ranging between 4 and 10 (N
φ
= 4, 6, 8, 10), the relative
Giuseppe Papari et al. 17
(a) (b)
(c) (d)
(e) (f)
Figure 15: “Bear1” (512×512 pixels): (a) test image and contours detected using (b) the proposed approach, (c) the Canny edge detector [1],
(d) single-scale surround inhibition [54], (e) a modification of the multiscale edge detector CARTOON [45], and (f) a multiscale contour
detector with surround inhibition [46].
variations of the performance indicators are only 0.62% for
recall and 0.88% for precision. We considered the spacing a
between the two half-rings as a fraction η of the inner ra-
dius ρ
0
and experimented with values of η ranging between 1
and 2 (η
= 1, 1.25, 1.5, 1.75, 2). The relative variations of the
performance indicators are of 0.34% for recall and 0.65% for
precision. Finally, we considered values of k ranging between
3and6(k
= 3, 4, 5, 6) and found the relative variations of
the performance indicators to be only 0.23% for recall and
1.76% for precision. To summarize, our experiments showed
that the proposed algorithm is robust to variations of these
parameters.
18 EURASIP Journal on Advances in Signal Processing
(a) (b)
(c) (d)
(e) (f)
Figure 16: Noisy bear1 (SNR = 13 dB): (a) test image and contours detected using (b) the proposed approach, (c) the Canny edge detector
[1], (d) single-scale surround inhibition [54], (e) a modification of the multiscale edge detector CARTOON [45], and (f) a multiscale contour
detector with surround inhibition [46].
5. SUMMARY AND CONCLUSIONS
In this paper we proposed a contour detection algorithm that
outperforms standard edge detectors that react to all the lo-
cal luminance changes, irrespective of whether they are due
to object contours or due to natural textures like grass, fo-
liage, water, and so forth. Specifically, the method we pre-
sented relies on different characteristics of the HVS. Inspired
by psychological and neurophysiological studies, we incor-
porated in our scheme surround inhibition of texture that
Giuseppe Papari et al. 19
(a) (b)
(c) (d)
(e) (f)
Figure 17: “Bear2” (512×512 pixels): (a) test image and contours detected using (b) the proposed approach, (c) the Canny edge detector [1],
(d) single-scale surround inhibition [54], (e) a modification of the multiscale edge detector CARTOON [45], and (f) a multiscale contour
detector with surround inhibition [46].
does not affect isolated edges but that inhibits edges that
are surrounded by other edge stimuli. Compared with pre-
vious inhibition schemes [27, 30, 54], the method we pro-
pose does not suffer the problem of self-inhibition of true
contours and, therefore, allows for a stronger and thus more
effective inhibition of texture. The design of the new inhibi-
tion scheme involves a few parameters for which we however
found that the selection of their values does not have signifi-
cant effect on the performance of the algorithm so that their
values can be fixed.
In order to make our algorithm robust to noise, we ap-
ply a Bayesian denoising step at each resolution before the
surround inhibition step. It consists of the optimal MMSE
estimator of the image g radient in additive noise for which
20 EURASIP Journal on Advances in Signal Processing
(a) (b)
(c) (d)
(e) (f)
Figure 18: Noisy bear2 (SNR = 13 dB): (a) test image and contours detected using (b) the proposed approach, (c) the Canny edge detector
[1], (d) single-scale surround inhibition [54], (e) a modification of the multiscale edge detector CARTOON [45], and (f) a multiscale contour
detector with surround inhibition [46].
a closed form is given. The a priori first-order p.d.f. of both
the signal and the additive noise is assumed Gaussian scale
mixture, according to previous studies of the statistics of the
wavelet coefficients of natural images.
For binarization we use a thresholding technique that is
based on weights computed for the connected and thinned
(by nonmaxima suppression) components of the sur round
inhibited and denoised gradient magnitude. We found out
that for obtaining good results it is essential that this thresh-
olding technique is applied in combination with surround
inhibition which cuts into small pieces long connected edge
components that are due to noise and texture.
Giuseppe Papari et al. 21
(a) (b)
(c) (d)
(e) (f)
Figure 19: Boat (321 × 481 pixels): (a) test image and contours detected using (b) the proposed approach, (c) the Canny edge detector [1],
(d) single-scale surround inhibition [54], (e) a modification of the multiscale edge detector CARTOON [45], and (f) a multiscale contour
detector with surround inhibition [46].
22 EURASIP Journal on Advances in Signal Processing
(a) (b)
(c) (d)
(e) (f)
Figure 20: Noisy boat (SNR = 13 dB): (a) test image and contours detected using (b) the proposed approach, ( c) the Canny edge detector
[1], (d) single-scale surround inhibition [54], (e) a modification of the multiscale edge detector CARTOON [45], and (f) a multiscale contour
detector with surround inhibition [46].
Giuseppe Papari et al. 23
(a) (b)
(c) (d)
(e) (f)
Figure 21: “Man and woman” (480 × 320 pixels): (a) test image and contours detected using (b) the proposed approach, (c) the Canny
edge detector [1], (d) single-scale sur round inhibition [54], (e) a modification of the multiscale edge detector CARTOON [45], and (f) a
multiscale contour detector with surround inhibition [46].
The second characteristic of the HVS taken into account
is that, as pointed out by psychophysical experiments, the vi-
sual information in different frequency bands is processed
separately. Following these findings, we p erform contour de-
tection in a multiresolution framework. Object contours can
be discriminated from texture edges because the former are
present at all scales (above a given scale that is determined
by the contour blur), while the latter appear only at the finer
scales. We use this fact and combine the binary contour maps
obtained for different scales in such a way that texture is elim-
inated while contours and junctions are retained.
The entire algorithm can be easily implemented by com-
puting convolutions, applying zero-memory nonlinear ities
and basic morphological operations, whereby convolutions
are the most computationally demanding operations and
have computational complexity O(N
I
log N
I
), where N
I
is the
linear size of the image. All the other operations can be done
in linear time, therefore the overall algorithm complexity is
O(N
I
log N
I
). To summarize, with reference to Figure 1, the
gradient computation requires two convolution operations,
the Bayesian denoising operation is computable in linear
time, the computation of the inhibition term requires 2Nφ
24 EURASIP Journal on Advances in Signal Processing
(a) (b)
(c) (d)
(e) (f)
Figure 22: Noisy man and woman (SNR = 13 dB): (a) test image and contours detected using (b) the proposed approach, (c) the Canny
edge detector [1], (d) single-scale sur round inhibition [54], (e) a modification of the multiscale edge detector CARTOON [45], and (f) a
multiscale contour detector with surround inhibition [46].
convolutions, where Nφ is the number of orientations, and
the binarization is computable in linear time. Therefore, for
each scale 2Nφ+ 2 convolutions are required.
We tested the proposed algorithm on a set of 40 im-
ages, both noiseless and corrupted by additive white noise
(with SNR
= 16 dB, 13 dB, 10 dB), and compared it with
other four existing contour detectors. Both visual inspection
of the results and quantitative comparison with weighted
ground truths lead us to the main conclusion of this pa-
per that the proposed algorithm is superior to other known
algorithms in terms of amount of texture suppressed, amount
of detected contours and their cleanness and robustness to
noise. The effective suppression of texture in the resulting bi-
nary contour maps is a very important aspect of the pro-
posed algorithm, because modern shape recognition algo-
rithms that use contour information (see, e.g., [68]) rely on
clean contour maps that are not corrupted by texture noise
[69–71].
Similar to other multiresolution contour detection ap-
proaches (see, e.g., [45, 46, 58, 72, 73]) we rely on the
Giuseppe Papari et al. 25
(a) (b)
Figure 23: Contours detected using the proposed algorithm for the noisy elephant image (a) without and (b) with Bayesian denoising.
(a) (b)
Figure 24: (a) An input image and (b) its weighted ground truth. The thick lines specify contours drawn by at least 5 (out of 8) observers
(γ(x, y)
= 1). The thin lines are contours specified by 3 or 4 observers (γ(x, y) = 1/3). The dotted lines are edges considered to be contours
by less than 3 observers; the latter are not used in the performance evaluation.
00.20.40.6
0
0.2
0.4
0.6
0.8
Recall
Precision
Proposed approach
Canny edge detector
CARTOON
Single scale surround inhibition
Multiscale surround inhibition
16 dB
16 dB
16 dB
16 dB
(a)
00.20.40.6
0
0.2
0.4
0.6
0.8
1
Recall
Precision
Noiseless
10 dB
13 dB
16 dB
12.5
12.5
12.5
12.5
2.5
2.5
2.5
2.5
(b)
0.20.40.6
0
0.2
0.4
0.6
0.8
1
Recall
Precision
Proposed approach
Canny edge detector
(c)
Figure 25:(a)Plotsofprecisionversusrecallfordifferent algorithms and varying SNR values. (b) Precision versus recall of the proposed
algorithm for different SNRs and threshold values. (c) Precision-recall plots of the Canny edge detector and the proposed algorithm for
various values of their respective threshold parameters.