Báo cáo hóa học: " Research Article Subband Approach to Bandlimited Crosstalk Cancellation System in Spatial Sound Reproduction" pptx
Bạn đang xem bản rút gọn của tài liệu. Xem và tải ngay bản đầy đủ của tài liệu tại đây (1.36 MB, 9 trang )
Hindawi Publishing Corporation
EURASIP Journal on Advances in Signal Processing
Volume 2007, Article ID 71948, 9 pages
doi:10.1155/2007/71948
Research Article
Subband Approach to Bandlimited Crosstalk Cancellation
System in Spatial Sound Reproduction
Mingsian R. Bai and Chih-Chung Lee
Department of Mechanical Engineering, National Chiao-Tung University, 1001 Ta-Hsueh Road, Hsin-Chu 300, Taiwan
Received 27 December 2005; Revised 1 May 2006; Accepted 16 July 2006
Recommended by Yuan-Pei Lin
Crosstalk cancellation system (CCS) plays a vital role in spatial sound reproduction using multichannel loudspeakers. However,
this technique is still not of full-blown use in practical applications due to heavy computation loading. To reduce the computation
loading, a bandlimited CCS is presented in this paper on the basis of subband filtering approach. A pseudoquadrature mirror filter
(QMF) bank is employed in the implementation of CCS filters which are bandlimited to 6 kHz, where human’s localization is the
most sensitive. In addition, a frequency-dependent regularization scheme is adopted in designing the CCS inverse filters. To justify
the proposed system, subjective listening experiments were undertaken in an anechoic room. The experiments include two parts:
the source localization test and the sound quality test. Analysis of variance (ANOVA) is applied to process the data and assess
statistical significance of subjective experiments. The results indicate that the bandlimited CCS performed comparably well as the
fullband CCS, whereas the computation loading was reduced by approximately eighty percent.
Copyright © 2007 M. R. Bai and C C. Lee. This is an open access article distributed under the Creative Commons Attribution
License, which permits unrestricted use, distribution, and reproduction in any medium, provided the original work is properly
cited.
1. INTRODUCTION
The fundamental idea of spatial audio reproduction is to syn-
thesize a virtual sound image so that the listener perceives
as if the signals reproduced at the listener’s ears would have
been produced by a specific source located at an intended
position relative to the listener [1, 2]. This attractive feature
of spatial audio lends itself to an emerging audio technology
with promising application in mobile phone, personal com-
puter multimedia, video games, home theater, and so forth.
The rendering of spatial audio is either by headphones
or by loudspeakers. Headphones reproduction is straightfor-
ward, but suffers from several shortcomings such as in-head
localization, front-back reversal, and discomfort to wear.
While loudspeakers do not have the same problems as the
headphones, another issue adversely affects the performance
of spatial audio rendering using loudspeakers. The issue as-
sociated with loudspeakers is the crosstalks at the contralat-
eral paths from the loudspeakers to the listener’s ears that
may obscure the sense of source localization due to the Haas
effect [3]. To overcome the problem, crosstalk cancellation
systems (CCS) that seek to minimize, if not totally elimi-
nate, crosstalk have been studied extensively by researchers
[4–9]. Methods of designing CCS are divided into two kinds
of approaches including time domain and frequency domain.
Kirkeby and Nelson proposed an LS time-domain filtering to
approximate the desired inverse function [10]. In contrast to
the time-domain method that is time consuming for long fil-
ters, a fast frequency-domain deconvolution method offers
more advantage in terms of computational speed [11].
Notwithstanding the preliminary success of CCS in aca-
demic community, two problems seriously hamper the use
of CCS in practical a pplications. One stems from the limited
size of the so-called “sweet spot” in which CCS remains effec-
tive. The sweet spots are generally so small especially at lateral
side that a head movement of a few centimeters would com-
pletely destroy the cancellation performance. Two kinds of
approaches can be used to address this problem—the adap-
tive design and the robust design. An example of adaptive
CCS with head tracker was presented in the work of Kyri-
akakis et al. [12], and Kyriakakis [13]. This approach dynam-
ically adjusts the CCS filters by tracking the head position of
the listener using optical or acoustical sensors. However, the
approach has not been widely used because of the increased
hardware and software complexity of the head tracker. On
the other hand, instead of dynamically tracking the listener’s
head, an alternative CCS design using fixed filters can be
taken to create a “wide” sweet spot that accommodates larger
2 EURASIP Journal on Advances in Signal Processing
head movement. A well-known example of robust CCS is
“stereo dipole” presented by Kirkeby et al. [14]. Other ap-
proaches with multidrive loudspeakers have been suggested
by Bai et al. [15], Takeuchi et al. [16], and Yang et al. [17, 18].
The other problem is computation loading due to multi-
channel filtering and long-length filters. In general, fi ner fre-
quency resolution, that is, long impulse response, is needed
for excellent reproduction, especially in a reverberated room.
The emphasis of this paper is placed on reducing compu-
tation loading. In considering the robustness against uncer-
tainties of HRTFs (head-related transfer function) and head
movement and head shadowing effect at high frequencies,
the proposed CCS is bandlimited to f requencies below 6 kHz
[19]. That is, the CCS only functions at low frequencies and
the binaural signals are directly passed through at high fre-
quencies. The bandlimited implementation approach sug-
gested in [19] is more computationally demanding due to
its fixed operating rate. In this work, we adopted a subband
filtering technique based on a cosine modulated quadrature
mirror filter (QMF) bank [20]. In this design, the approx-
imated perfect reconstruction condition is fulfilled and the
CCS is operated at low rate. Therefore, it can use more ef-
fort at low frequencies for characteristics of human percep-
tual hearing. Another feature of the proposed system is that
CCS filter is designed with frequency-dependent regulariza-
tion [21]. The present approach which differs itself from the
methods using constant regularization [11]providesmore
flexibility in the design stage. In order to verify the pro-
posed CCS, subjective listening experiments were conducted
to compare it to the traditional CCS. The results of subjective
tests will be validated by using analysis of variance (ANOVA).
The intention is to develop the CCS with light computation
loading that performs comparably well as the fullband CCS.
2. MULTICHANNEL INVERSE FILTERING FOR CCS
FROM A MODEL-MATCHING PERSPECTIVE
The CCS aims to cancel the crosstalks in the contralateral
paths from the stereo loudspeakers to the listener’s ears so
that the binaural signals are reproduced at two ears like those
reproduced using a headphone. This problem can be viewed
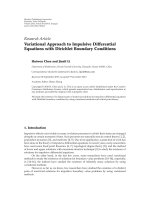
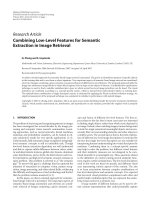
from a model-matching perspective, as shown in Figure 1.
In the block diagram, x(z) is a vector of Q program input
signals, v(z) is a vector of P loudspeaker input signals, and
e(z) is a vector of L error signals. M(z)isanL
× Q matrix of
matching model, H(z)isanL
× P plant transfer matrix, and
C(z)isaP
× Q matrix of the CCS filters. The z
−m
term ac-
counts for the modeling delay to ensure causality of the CCS
filters. Let us neglect the modeling delay for the moment; it is
straightforward to write down the input-output relationship:
e(z)
=
M(z) − H(z)C(z)
x(z). (1)
For arbitrary inputs, minimization of the error output is tan-
tamount to the following optimization problem:
min
C
M − HC
2
F
,(2)
Program input
signals
x(z)
Modeling
delay
z
m
Model
M(z)
L
Q
Desired
signals
d(z)
+
Error
e(z)
w(z)
Reproduced
signals
H(z)
Plant
v(z)
Speaker input
signals
C(z)
CCS filters
L
PP Q
Figure 1: The block diagram of a multichannel model-matching
problem in the CCS design.
where F symbolizes the Frobenius norm [22]. For an L × Q
matrix A, Frobenius norm is defined as
A
2
F
=
Q
q=1
L
l=1
a
lq
2
=
Q
q=1
a
q
2
2
, a
q
being the qth column of A.
(3)
Hence, the minimization problem of Frobenius norm can be
converted to the minimization problem of 2-norm by parti-
tioning the matrices into columns. Specifically, since there is
no coupling between the columns of the matrix C, the min-
imization of the square of the Frobenius norm of the entire
matrix H is tantamount to minimizing the square of each
column independently. Therefore, (2) can be rew ritten into
min
c
q
, q=1,2, ,Q
Q
q=1
Hc
q
− m
q
2
2
,(4)
where c
q
and m
q
are the qth column of the matrices C and
M, respectively. The optimal solution of c
q
can be obtained
by applying the method of least squares to each column:
c
q
= H
+
m
q
, q = 1, 2, , Q,(5)
where H
+
is the pseudoinverse of H [22]. This optimal so-
lution in the least-square sense can be assembled in a more
compact matrix form:
c
1
c
2
··· c
Q
=
H
+
m
1
m
2
··· m
Q
(6a)
or
C
= H
+
M. (6b)
For a matrix H with full-column rank (L
≥ P), H
+
can be
calculated according to
H
+
=
H
H
H
−1
H
H
. (7)
M. R. Bai and C C. Lee 3
Here, H
+
is also referred to as the left-pseudoinverse of H
such that H
+
H = I.
In practice, the number of loudspeakers is usually greater
than the number of ears, that is, L
≤ P. Regularization can be
used to prevent the singularity of H
H
H from saturating the
filter gains [11, 23]:
H
+
=
H
H
H + γI
−1
H
H
. (8)
The regularization parameter γ can either be constant
or frequency-dependent [21]. A frequency-dependent γ is
based on a gain threshold on the maximum of the absolute
values of all entries in C. If the threshold is exceeded, a larger
γ should be chosen. The binary search method can be used
to accelerate the search. It is noted that the procedure to ob-
tain the filter C in (6) is essentially a frequency-domain for-
mulation; inverse Fourier transform along with circular shift
(hence the modeling delay) is needed to obtain causal FIR
(finite impulse response) filters.
3. BANDLIMITED IMPLEMENTATION USING
THE MULTIRATE APPROACH
Bandlimited implementation is chosen in this work for sev-
eral reasons. First, the computation loading is too high to af-
ford a fullband (0 ∼ 20 kHz) implementation. For the ex-
ample of the stereo loudspeaker considered herein, the CCS
would contain 4 filters. If each filter has 3000 taps, the convo-
lution would require 1.2
× 10
4
multiplications and additions
per sample interval. Except for special-purpose DSP engine,
real time implementation for a fullband CCS is usually pro-
hibitive for the sampling rate commonly used in audio pro-
cessing, for example, 44.1 kHz or 48 kHz. Second, at high fre-
quencies, the wavelength could be much smaller than a head
width. Under this circumstance, the CCS would be extremely
susceptible to misalignment of the listener’s head and uncer-
tainties involved in HRTF modeling. Third, at high frequen-
cies, a listener’s head provides natural shadowing for the con-
tralateral paths, which is more robust than direct application
of CCS. The CCS in this study is chosen to be bandlimited
to 6 kHz (the wavelength at this frequency is approximately
5.6 cm). To accomplish this, a 4-channel pseudo-QMF bank
is employed to divide the total audible frequency range into
subbands for CCS and direct transmission, respect ively.
The design strategy of subband filter bank employed in
this paper is the cosine modulated pseudo-QMF. In this
method, a FIR filter must be selected as the prototype. Us-
ing this prototype, an M-channel maximally decimated filter
bank (number of subbands
= up/down sampling factor) is
generated with the aid of cosine modulation. The maximum
attenuation that can be attained by a perfectly reconstruct-
ing (PR) cosine modulated filter bank is about 40 dB. Never-
theless, this PR filter bank would still present an undesirable
ringing problem. To alleviate this problem, the PR condition
is relaxed in the FIR filter design to gain more stopband at-
tenuation. From our experience, as much as 60 dB attenua-
tion is required for acceptable reproduction.
Based on the method in [20], the following analysis and
synthesis filter banks represented by g
k
(z)and f
k
(z), respec-
tively, are employed to minimize phase distort ion and alias-
ing:
g
k
(n) = 2p
0
(n)cos
π
M
(k +0.5)
n −
N
2
+ θ
k
,(9)
f
k
(n) = g
k
(N − n), (10)
where θ
k
= (−1)
k
(π/4), 0 ≤ k ≤ M − 1, and p
0
(n), n =
1, 2, , N are the coefficients of the prototype FIR filter. The
remaining problem is how to minimize the amplitude distor-
tion. The distortion function T(z) for the filter bank is given
as in [20]:
T(z)
=
1
M
M−1
k=0
F
k
(z)G
k
(z). (11)
Z-transform of (10)leadstoF
k
(z) = z
−N
G
k
(z), where
G
k
(z)
is the paraconjugation of G
k
(z). The distortion function can
thusbewritteninfrequencydomainas
T
e
jω
=
1
M
e
− jωN
M
−1
k=0
G
k
e
jω
2
. (12)
AfilterP(z)iscalledaNyquist(M) filter if the following con-
dition is met:
p(Mn)
=
⎧
⎨
⎩
c, n = 0,
0, otherwise,
(13)
where p(n) is the impulse response of P(z)andc is a con-
stant. In frequency domain,
M−1
k=0
P
e
j(ω−2πk/N)
=
Mc. (14)
Equations (12)and(14) indicate that if
|G
k
(e
jω
)|
2
is a
Nyquist (M) filter, or equivalently
|P
0
(e
jω
)|
2
is a Nyquist
(2M) filter, the magnitude of T(z)willbeflat.
In this Q MF desig n, the Kaiser window is used as the FIR
prototype [24]. Given the specifications of transition band-
width Δ f and stopband attenuation A
s
, the parameter β and
the filter order N can be determined according to
β
=
⎧
⎪
⎪
⎪
⎪
⎨
⎪
⎪
⎪
⎪
⎩
0.1102
A
s
− 8.7
if A
s
> 50,
0.5842
A
s
−21
0.4
+0.07886
A
s
−21
if 21 <A
s
< 50,
0ifA
s
< 21,
N
≈
A
s
− 7.95
14.36Δ f
.
(15)
Anoptimizationprocedureisemployedheretomake
P
0
(z)
P
0
(z) an approximate Nyquist (2M)filter,asposedby
the following min-max problem [24]:
min
ω
c
max
n=0
p
0
(n) ∗ p
0
(−n)
↓2M
, (16)
4 EURASIP Journal on Advances in Signal Processing
where the asterisk ∗ denotes the convolution operator. Be-
cause this is a convex problem, optimal cutoff frequency can
always be found [24]. After obtaining the optimal prototype
filter, the analysis and synthesis filters are generated accord-
ing to (9)and(10), respectively. The filter bank can be easily
implemented with techniques such as polyphase structure or
discrete cosine transform (DCT) [20].
4. SUBJECTIVE EXPERIMENTS
In order to compare the performance of the proposed CCS
and the fullband CCS, subjective experiments were under-
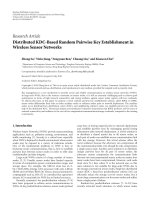
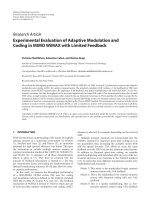
taken in an anechoic room. The experimental arrangement
is shown in Figure 2. This experiment employed a stereo-
phonic two-way loudspeaker system, ELAC BS 103.2. The
microphone and the preamplifier are GRAS 40AC and GRAS
26AM, respectively. The plant transfer function matrices
were measured on an acoustical manikin, KEMAR (Knowles
electronics manikin for acoustic research), along with the
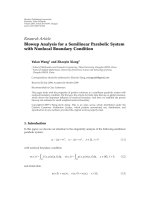
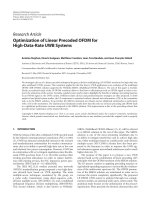
ear model, DB-065. The frequency responses of the plants
are shown in Figure 3 wherein the solid line and dotted line
represent the ipsilateral and the contralateral paths, respec-
tively. Only responses measured on the right ear are shown
because of the assumed symmetry. The x-axis is logarithmic
frequency in Hz and the y-axis is magnitude in dB. The CCS
filters with 3000 taps are designed according to the method
presented in Section 2 with 12 dB threshold. The matrix Q is
defined as
Q
=
Q
11
Q
12
Q
21
Q
22
=
HC. (17)
This matrix attempts to approximate the model mat rix M
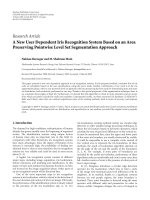
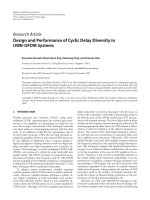
which is set to be an identity matrix here. Figure 4(a) shows
the frequency responses of Q
11 f
and Q
12 f
, where the sub-
script f stands for the fullband method, represented as solid
line and dotted line, respectively. After compensation, the ip-
silateral magnitude is almost flat from 300 Hz to 8 kHz. Some
imperfect match can be seen at low frequencies and at high
frequencies because the CCS filter gain is constrained, that
is, large regularization. On the other hand, the contra lateral
magnitude is degraded to around
−40 dB. Channel separa-
tion, defined as the ratio of the contralateral response and
the ipsilateral response, is employed as a performance index.
The channel separation, Q
12 f
/Q
11 f
, is shown in Figure 4(b)
as the dotted line. T he solid line represents the natural chan-
nel separation, H
12
/H
11
. As mentioned above, the fullband
approach is impractical due to many reasons. The proposed
method in this work is bandlimited to 6 kHz with 48 kHz
sampling rate. The block diagram of the bandlimited CCS is
illustrated in Figure 5. Through the use of the method pre-
sented in Section 3, the prototype FIR filter with 120 taps
and the analysis bank are plotted in Figures 6(a) and 6(b),
respectively. The CCS only functions at the lowest band and
operates at lower sampling rate. The computation load of an
analysis bank or a synthesis bank equals to that of the pro-
totype FIR filter when the polyphase structure is employed.
Since CCS operates at low rate, it is able to sample more fre-
quencies at design stage. In the experiment, the tap of the
Speaker L
Speaker R
Amplifier
KEMAR
Figure 2: The experimental configuration.
10
2
10
3
10
4
Frequency (Hz)
70
60
50
40
30
20
10
0
10
Magnitude (dB)
Ipsilateral path
Contralateral path
Figure 3: The frequency responses of the plants including ipsilateral
and contralateral paths.
bandlimited CCS is 1500. In other words, the frequency (un-
der 6 kHz) resolution of the bandlimited CCS is twice than
that of the fullband CCS. That is, the bandlimited CCS has
finer resolution. Figure 7(a) shows the frequency responses
of Q
11b
and Q
12b
, where the subscript b stands for the ban-
dlimited method, represented as solid line and dotted line,
respectively. The channel separation, Q
12b
/Q
11b
, is shown in
Figure 7(b) as the dotted line. From Figures 4(b) and 7(b),
we can see that the bandlimited CCS gets better channel sep-
aration, especially from 100 Hz to 1 kHz.
Subjective listening exper iment includes two parts: the
source localization test and the sound quality test. Eleven
subjects participated in the test. The listeners were instructed
to sit at the position where KEMAR was. In the first part,
the test stimulus was a pink noise bandlimited to 20 kHz.
Each stimulus was played 5 times in 25 ms duration with
50 ms silent interval. Virtual sound images at 7 prespeci-
fied directions on the right h orizontal plane with increment
30
◦
azimuth are rendered by using HRTFs. Listeners were
M. R. Bai and C C. Lee 5
10
2
10
3
10
4
Frequency (Hz)
70
60
50
40
30
20
10
0
10
Magnitude (dB)
The frequency responses of Q
11 f
The frequency responses of Q
12 f
(a)
10
2
10
3
10
4
Frequency (Hz)
70
60
50
40
30
20
10
0
10
Magnitude (dB)
Natural channel separation
Compensated channel separation
(b)
Figure 4: (a) The frequency responses of Q
11 f
and Q
12 f
.(b)Natural
channel separation and compensated channel separation.
well trained by playing the stimuli of all angles prior to the
test. The experiments were blind tests in which stimuli were
played randomly without informing the subjects the source
direction. The results of localization test are shown in terms
of target angles versus judged angles in Figures 8(a) and 8(b),
corresponding to the cases of fullband CCS and bandlimited
CCS. The size of each circle is proportional to the number of
the listeners who localized the same perceived angle. The 45-
degree line indicates the perfect localization. It is observed
from the results that subjects localized wel l at front (0 de-
gree) and back (180 degrees) no matter what approach is em-
ployed. While the fullband CCS performs well at 30-degree
angle, subjects were confused within the range 60
◦
–120
◦
.On
the other hand, bandlimited CCS performs slightly better
G
0
(z) 4
CCS
4 F
0
(z)
G
1
(z) 4 4 F
1
(z)
G
2
(z) 4 4 F
2
(z)
G
3
(z) 4 4 F
3
(z)
Analysis bank synthesis bank
Figure 5: The block diagram of the bandlimited CCS.
00.10.20.30.40.50.60.70.80.91
Frequency (normalized by π)
100
80
60
40
20
0
Magnitude (dB)
(a)
00.10.20.30.40.50.60.70.80.91
Frequency (normalized by π)
100
80
60
40
20
0
Magnitude (dB)
G
0
(z) G
1
(z) G
2
(z) G
3
(z)
(b)
Figure 6: The magnitude responses of (a) prototype FIR filter and
(b)analysisbank.
within the range 60
◦
–120
◦
. It is interesting to note that ban-
dlimited CCS exists no back-front reversal problem which
means that the subject localizes rear stimulus to front an-
gle. In addition, a one-way analysis of variance (ANOVA)
on the subjective localization result was conducted. These re-
sults were preprocessed into five levels of grade, as described
in Tabl e 1. Figure 9(a) shows the means and spreads (with
6 EURASIP Journal on Advances in Signal Processing
10
2
10
3
Frequency (Hz)
70
60
50
40
30
20
10
0
10
Magnitude (dB)
The frequency responses of Q
11b
The frequency responses of Q
12b
(a)
10
2
10
3
Frequency (Hz)
70
60
50
40
30
20
10
0
10
Magnitude (dB)
Natural channel separation
Compensated channel separation
(b)
Figure 7: (a) The frequency responses of Q
11b
and Q
12b
. (b) Natural channel separation and compensated channel separation.
0 30 60 90 120 150 180
Target azimuth (degree)
0
30
60
90
120
150
180
Judged azimuth (degree)
(a)
0 30 60 90 120 150 180
Target azimuth (degree)
0
30
60
90
120
150
180
Judged azimuth (degree)
(b)
Figure 8: Results of the subjective localization test of azimuth. (a) Fullband CCS. (b) Bandlimited CCS.
95% confidence intervals) of the grades for two kinds of ap-
proaches. The mean of the bandlimited CCS is slightly larger
than that of the fullband CCS as we observed previously.
ANOVA output reveals that two approaches are not statis-
tically significant (p
= 0.2324 > 0.05).
In the second part, the stimulus prefiltered by the full-
band CCS and the band limited CCS were treated as the ref-
erence and the object, respectively. The “double-blind triple
stimulus with hidden reference” method has been employed
in this testing procedure [25]. A listener at a time was in-
volved in three stimuli (“A,” “B,” a nd “C”) where “A”repre-
sented the reference and “B” and/or “C” represented the hid-
den reference and/or the object. A subject was requested to
compare “B”to“A”and“C”to“A” with five-grade impair-
ment scale described in Table 2. The test stimuli contain three
types of music including a bass (low frequency), a triangle
(high frequency), and a popular song (comprehensive effect).
Figure 9(b) shows the means and spreads (with 95% confi-
dence intervals) of the grades for two kinds of approaches. It
seems that the fullband CCS earned a slightly higher grade
than the subband approach since the fullband CCS was used
as the reference. Nevertheless, ANOVA test reveals that the
performance difference between two approaches is not sta-
tistically significant (p
= 0.4109 > 0.05).
Here, the proposed method has been validated that it
performs comparably well as the fullband CCS. In Table 3,
twoapproachesarecomparedintermsofcomputationload-
ing, where MPU and APU represent multiplications and
M. R. Bai and C C. Lee 7
Table 1: Description of five levels of grade for the subjective localization test.
Description Grade
The judged angle is the same as the target angle 5.0
30
◦
difference between the judged angle and the target angle 4.0
Front-back reversal of the judged angle identical to the target angle
3.0
30
◦
difference between front-back reversal of the judged angle and the target angle 2.0
Otherwise
1.0
Fullband Bandlimited
3.8
3.9
4
4.1
4.2
4.3
4.4
4.5
4.6
4.7
Grade
(a)
Fullband Bandlimited
3.8
3.9
4
4.1
4.2
4.3
4.4
4.5
4.6
4.7
4.8
Grade
(b)
Figure 9: Means and spreads (with 95% confidence intervals) of the
grades for two kinds of CCS approaches. (a) Grades of the source
localization experiment. (b) Grades of the sound quality tests.
additions per unit time, respectively. The computation load-
ings are calculated using direct convolution in the time do-
main. The computation loading using the proposed sub-
band filtering appr oach was drastically reduced by approx-
imately eighty percent, as compared to the conventional ap-
proach. However, there are still other fast convolution algo-
rithms that can be adopted for efficient implementation. The
overlap-add methods of block convolution [26], for example,
are compared in the simulation. This method is only used in
CCS filters, while the filter bank is still carried out by using
Table 2: Five-grade impairment scale.
Impairment Grade
Imperceptible 5.0
Perceptible, but not annoying
4.0
Slightly annoying
3.0
Annoying
2.0
Very annoying
1.0
Table 3: The comparison of computation loading of the fullband
CCS and the bandlimited CCS with direct convolution.
Fullband Bandlimited
MPU 12 000 1 980
APU
11 998 1 976
Table 4: The comparison of computation loading of the fullband
CCS and the bandlimited CCS with fast convolution.
Fullband Bandlimited
MPU 1 464 815
APU
1 462 808
direct convolution because of the efficient polyphase imple-
mentation. In the procedure of block convolution, the fast
Fourier transform is used to realize discrete Fourier trans-
form. Moreover, the number of complex multiplications and
additions of the fast Fourier transform is equal to N log
2
N,
where N is the number of the transform point. After using
block convolution, the results of computation l oading are
listed in Table 4.
The shuffler method can be applied due to symmetric as-
sumption. The shuffler structure is shown in Figure 10.It
saves around fifty percent of computation [19]. The multi-
channel shuffler structure can be found in [18].
5. CONCLUSIONS
A bandlimited CCS based on subband filtering has been de-
veloped in the work. The intention is to establish a compu-
tationally efficient CCS without penalty on cancellation per-
formance. The CCS is a bandlimited design which is effective
up to the frequency 6 kHz. To achieve the bandlimited imple-
mentation, a pseudocosine modulated QMF is employed, al-
lowing the CCS to operate at low rate within an approximate
8 EURASIP Journal on Advances in Signal Processing
x
L
C
11
+ C
12
2
v
L
x
R
C
11
C
12
2
v
R
Figure 10: Shuffler filter structure for 2x2 CCS.
PR structure. As a result of this, spatial audio processing can
concentrate more on the low frequency range to better suit
human perceptual hearing.
To compare the proposed CCS to traditional systems,
subjective listening experiments were conducted in an ane-
choic room. The experiments include two parts: source lo-
calization test and sound quality test. By means of the tech-
niques presented in Section 2, the fullband CCS operated at
the sampling rate of 48 kHz requires four 3000-tapped FIR
filters. On the other hand, the bandlimited CCS operated at
the sampling rate of 12 kHz requires only four 1500-tapped
FIR filters. The prototy pe FIR filter has 120 taps. The analy-
sis bank and the synthesis bank are generated from the pro-
totype and implemented via polyphase representation. The
results of subjective tests processed by ANOVA indicate that
the bandlimited CCS performs comparably well as the full-
band CCS not only in localization but also in sound quality.
From Ta ble 3 , the computation loading using the proposed
subband filtering approach was drastically reduced by ap-
proximately eighty percent, as compared to the conventional
approach. After employing fast convolution algorithm, the
difference between two methods is reduced. Even though the
block conv olution is very efficient, it requires more memory
to store temporary data. In conclusion, wh ich method is bet-
ter is dependent upon which one you concern about, speed
or memory. The bandlimited CCS with direct convolution
and shuffler method is an acceptable choice.
ACKNOWLEDGMENT
The work was supported by the National Science Council in
Taiwan, under project number NSC94-2212-E009-019.
REFERENCES
[1] J. Blauert, Spatial Hearing: The Psychophysics of Human Sound
Localization, MIT Press, Cambridge, Mass, USA, 1997.
[2] D. R. Begault, 3-D Sound for Virtual Reality and Multimedia,
AP Professional, Cambridge, Mass, USA, 1994.
[3] A. Sibbald, “Transaural acoustic crosstalk cancellation,” Sen-
saura White Papers, 1999, .
[4] M. R. Schroeder and B. S. Atal, “Computer simulation of
sound transmission in rooms,” IEEE International Convention
Record, vol. 11, no. 7, pp. 150–155, 1963.
[5] P. Damaske and V. Mellert, “A procedure for generating direc-
tionally accurate sound images in the upper- half space using
two loudspeakers,” Acoustica, vol. 22, pp. 154–162, 1969.
[6] D. H. Cooper, “Calculator program for head-related transfer
function,” Journal of the Audio Engineering Society, vol. 30,
no. 1-2, pp. 34–38, 1982.
[7] W. G. Gardner, “Transaural 3D audio,” Tech. Rep. 342, MIT
Media Laboratory, Cambridge, Mass, USA, 1995.
[8] D. H. Cooper and J. L. Bauck, “Prospects for transaural record-
ing,” Journal of the Audio Eng ineering Society,vol.37,no.1-2,
pp. 3–19, 1989.
[9] J. L. Bauck and D. H. Cooper, “Generalized transaural stereo
and applications,” Journal of the Audio Engineering Society,
vol. 44, no. 9, pp. 683–705, 1996.
[10] O. Kirkeby and P. A. Nelson, “Digital filter design for inver-
sion problems in sound reproduction,” Journal of the Audio
Engineering Society, vol. 47, no. 7, pp. 583–595, 1999.
[11] O. Kirkeby, P. A. Nelson, H. Hamada, and F. Orduna-
Bustamante, “Fast deconvolution of multichannel systems us-
ing regularization,” IEEE Transactions on Speech and Audio
Processing, vol. 6, no. 2, pp. 189–194, 1998.
[12] C. Kyriakakis, T. Holman, J S. Lim, H. Hong, and H. Neven,
“Signal processing, acoustics, and psychoacoustics for high
quality desktop audio,” Journal of Visual Communication and
Image Representation, vol. 9, no. 1, pp. 51–61, 1998.
[13] C. Kyriakakis, “Fundamental and technological limitations of
immersive audio systems,” Proceedings of the IEEE, vol. 86,
no. 5, pp. 941–951, 1998.
[14] O. Kirkeby, P. A. Nelson, and H. Hamada, “The “stereo dipole”
- a virtual source imaging system using two closely spaced
loudspeakers,” Journal of the Audio Engineering Society, vol. 46,
no. 5, pp. 387–395, 1998.
[15] M. R. Bai, C W. Tung, and C C. Lee, “Optimal design of
loudspeaker arrays for robust cross-talk cancellation using the
Taguchi method and the genetic algorithm,” Journal of the
Acoustical Society of America, vol. 117, no. 5, pp. 2802–2813,
2005.
[16] T. Takeuchi, P. A. Nelson, and H. Hamada, “Robustness to
head misalignment of virtual sound imaging systems,” Journal
of the Acoustical Society of America, vol. 109, no. 3, pp. 958–
971, 2001.
[17] J. Yang, W S. Gan, and S E. Tan, “Improved sound separa-
tion using three loudspeakers,” Acoustic Research Letters On-
line, vol. 4, no. 2, pp. 47–52, 2003.
[18] J. Yang, W S. Gan, and S E. Tang, “Development of virtual
sound imaging system using triple elevated speakers,” IEEE
Transactions on Consumer Electronics, vol. 50, no. 3, pp. 916–
922, 2004.
[19] W. G. Gardner, 3-D Audio Using Loudspeakers,KluwerAca-
demic, London, UK, 1998.
[20] P. P. Vaidyanathan, Multirate Systems and Filter Banks,
Prentice-Hall, Englewood Cliffs, NJ, USA, 1993.
[21] M. R. Bai and C C. Lee, “De velopment and implementation
of cross-talk cancellation system in spatial audio reproduction
based on subband filtering,” Journal of Sound and Vibration,
vol. 290, no. 3–5, pp. 1269–1289, 2006.
[22] B. Noble, Applied Linear Algebra, Prentice-Hall, Englewood
Cliffs, NJ, USA, 1988.
[23] A. Schuhmacher, J. Hald, K. B. Rasmussen, and P. C. Hansen,
“Sound source reconstruction using inverse boundary ele-
ment calculations,” Journal of the Acoustical Society of America,
vol. 113, no. 1, pp. 114–127, 2003.
[24] Y P. Lin and P. P. Vaidyanathan, “A Kaiser window approach
for the design of prototype filters of cosine modulated filter-
banks,” IEEE Signal Processing Letters, vol. 5, no. 6, pp. 132–
134, 1998.
M. R. Bai and C C. Lee 9
[25] Rec. ITU-R BS.1116-1, “Method for the subjective assessment
of small impairments in audio systems including multichan-
nel sound systems,” International Telecommunications Union,
Geneva, Switzerland, 1992–1994.
[26] A. V. Oppenheim, R. W. Schafer, and J. R. Buck, Discrete-Time
Signal Processing, Prentice-Hall, Upper Saddle River, NJ, USA,
2nd edition, 1999.
Mingsian R. Bai was born in 1959 in Taipei,
Taiwan. He received the Bachelor’s degree
in power mechanical engineering from Na-
tional Tsing-Hwa Un iversity in 1981. He
also received the Master’s degree in busi-
ness management from National Chen-Chi
University in 1984. He left Taiwan in 1984
toentergraduateschoolofIowaStateUni-
versity and later received the M.S. degree
in mechanical engineering in 1985 and the
Ph.D. degree in engineering mechanics and aerospace engineering
in 1989. In 1989, he joined the Department of Mechanical Engi-
neering of National Chiao-Tung University in Taiwan as an Asso-
ciate Professor and became a Professor in 1996. He was also a Vis-
iting Scholar to Center of Vibration and Acoustics, Penn State Uni-
versity, University of Adelaide, Australia, and Institute of Sound
and Vibration Research (ISVR), UK, in 1997, 2000, and 2002, re-
spectively. His current interests encompass acoustics, audio signal
processing, electroacoustic transducers, vibroacoustic diagnostics,
active noise and vibration control, and so forth. He h as over 100
published papers and 13 granted or pending patents. He is a Mem-
ber of the Audio Engineering Society (AES), Acoustical Society of
America (ASA), Acoustical Society of Taiwan, and Vibration and
Noise Control Engineering Society in Taiwan.
Chih-Chung Lee was born in 1979 in
Taipei, Taiwan. He received the B.S. deg ree
and the M.S. degree in mechanical engi-
neering from National Chiao-Tung Univer-
sity in 2001 and 2003, respectively. His Mas-
ter’s thesis is on personal 3D virtual cin-
ema based on panel speaker array. He is cur-
rently studying the Ph.D. degree in mechan-
ical engineering from National Chiao-Tung
University .