Báo cáo hóa học: " Automatic Image Enhancement by Content Dependent Exposure Correction" doc
Bạn đang xem bản rút gọn của tài liệu. Xem và tải ngay bản đầy đủ của tài liệu tại đây (5.54 MB, 12 trang )
EURASIP Journal on Applied Signal Processing 2004:12, 1849–1860
c
2004 Hindawi Publishing Corporation
Automatic Image Enhancement by Content Dependent
Exposure Correction
S. Battiato
University of Catania, Department of Mathematic and Informatics, 95125 Catania, Italy
Email:
A. Bosco
STMicroelectronics, M6 Site, Zona Industriale, 95121 Catania, Italy
Email:
A. Castorina
STMicroelectronics, M6 Site, Zona Industriale, 95121 Catania, Italy
Email: alfi
G. Messina
STMicroelectronics, M6 Site, Zona Industriale, 95121 Catania, Italy
Email:
Received 7 August 2003; Revised 8 March 2004
We describe an automatic image enhancement technique based on features extraction methods. The approach takes into account
images in Bayer data format, captured using a CCD/CMOS sensor and/or 24-bit color images; after identifying the visually signif-
icant features, the algorithm a djusts the exposure le vel using a “camera response”-like function; then a final HUE reconstruction
is achieved. This method is suitable for handset devices acquisition systems (e.g., mobile phones, PDA, etc.). The process is also
suitable to solve some of the typical drawbacks due to several factors such as poor optics, absence of flashgun, and so forth.
Keywords and phrases: Bayer pattern, skin recognition, features extraction, contrast, focus, exposure correction.
1. INTRODUCTION
Reduction of processing time and quality enhancement of ac-
quired images is becoming much more significant. The use
of sensors with greater resolution combined with advanced
solutions [ 1, 2, 3, 4] aims to improve the quality of result-
ing images. One of the main problems affecting image qual-
ity, leading to unpleasant pictures, comes from improper ex-
posure to light. Beside the sophisticated features incorpo-
rated in today’s cameras (i.e., automatic gain control algo-
rithms), failures are not unlikely to occur. Some techniques
are completely automatic, cases in point being represented
by those based on “average/automatic exposure metering”
or the more complex “matrix/intelligent exposure metering.”
Others, again, accord the photographer a certain control over
the selection of the exposure, thus allowing space for per-
sonal taste or enabling him to satisfy part icular needs.
Inspite of the great variety of methods [5, 6], for regulat-
ing the exposure and the complexity of some of them, it is
not rare for images to be acquired with a nonoptimal or in-
correct exposure. This is particularly true for handset devices
(e.g., mobile phones) where several factors contribute to ac-
quire bad-exposed pictures: poor optics, absence of flashgun,
not to talk about “difficult” input scene lighting conditions,
and so forth.
There is no exact definition of what a correct exposure
should be. It is possible to abstract a gener a lization and to
define the best exposure that enables one to reproduce the
most important regions (according to contextual or percep-
tive criteria) with a level of gray or brightness, more or less
in the middle of the possible range.
Using postprocessing techniques an effective enhance-
ment should be obtained. Typical histogram specification,
histogram equalization, and gamma correction to improve
global contrast appearance [7] only stretch the global distri-
bution of the intensity. More adaptive criterions are needed
to overcome such drawback. In [8, 9] two adaptive his-
togram equalization techniques, able to modify intensity’s
1850 EURASIP Journal on Applied Signal Processing
Average
RG
B
R
G
B
G
2
B
RG
1
Figure 1: Bayer data subsampling generation.
distribution inside small regions are presented. In particular
the method described in [9], splits the input image into two
or more equal area subimages based on its gray-level prob-
ability density function. After having equalized each subim-
age, the enhanced image is built taking into account some
local property, preserving the original image’s average lu-
minance. In [10] point processing and spatial filtering are
combined together while in [11] a fuzzy logic approach to
contrast enhancement is presented. Recent approaches work
in the compressed domain [12] or use advanced techniques
such as curvelet transform [13], although both methods are
not suited for real-time processing.
The new exposure correction technique described in this
paper is designed essentially for mobile sensors applications.
This new element, present in newest mobile devices, is partic-
ularly harmed by “backlight” when the user utilizes a mobile
device for video phoning. The detection of skin characteris-
tics in captured images allows selection and proper enhance-
ment and/or tracking of regions of interest (e.g., faces). If no
skin is present in the scene the algorithm switches automat-
ically to other features (such as contrast and focus) track-
ing for visually relevant regions. This implementation differs
from the algorithm described in [14] because the whole pro-
cessing can also be performed directly on Bayer pattern im-
ages [15], and simpler statistical measures were used to iden-
tify information carrying regions; furthermore the skin fea-
ture has been added.
The paper is organized as follows. Section 2 describes
the different features extraction approaches and the expo-
sure correction technique used for a utomatic enhancement.
The “arithmetic” complexity [16] of the whole process is es-
timated in Section 3.InSection 4 experimental results show
the effectiveness of the proposed techniques. Also some com-
parisons with other techniques [7, 9] are reported. Section 5
closes the paper tracking directions for future works.
2. APPROACH DESCRIPTION
The proposed automatic exposure correction algorithm is
defined as follows.
(1) Luminance extraction. If the algorithm is applied on
Bayer data, in place of the three full color planes, a sub-
sampled (quarter size) approximated input data (see
Figure 1)isused.
(2) Using a suitable features extraction technique the algo-
rithm fixes a value to each region. This operation per-
mits to seek visually relevant regions (for contrast and
focus the regions are block-based, for skin recognition
the regions are associated to each pixel).
(3) Once the “visually important” pixels are identified
(e.g., the pixels belonging to skin features) a global
tone correction technique is applied using as main pa-
rameter the mean gray levels of the relevant regions.
2.1. Features extraction: contrast and focus
To be able to identify regions of the image that contain more
information, the luminance plane is subdivided in N blocks
of equal dimensions (in our experiments we employed N =
64 for VGA images). For each block, statistical measures of
“contrast” and “focus” are computed. Therefore it is assumed
that well-focused or high-contrast blocks are more relevant
compared to the others. Contrast refers to the range of tones
present in the image. A high contrast leads to a higher num-
ber of perceptual significance regions inside a block.
Focus characterizes the sharpness or edgeness of the
block and is useful in identifying regions where high-
frequency components (i.e., details) are present.
If the aforementioned measures were simply computed
on highly underexposed images, then the regions having bet-
ter exposure would always have higher contrast and edgeness
compared to those that are obscured. In order to perform a
visual analysis revealing the most important features regard-
less of lighting conditions, a new “visibility image” is con-
structed by pushing the mean gray level of the input green
Bayer pattern plane (or the Y channel for color images) to
128. The push operation is performed using the same func-
tion that is used to adjust the exposure level and it will be
described later.
The contrast measure is computed by simply building a
histogram for each block and then calculating its deviation
(2) from the mean value (3).Ahighdeviationvaluedenotes
good contrast and vice versa. In order to remove irrelevant
peaks, the histogram is slightly smoothed by replacing each
entry with its mean in a ray 2 neighborhood. Thus, the orig-
inal histogram ent ry is replaced with the gray level
˜
I[i]:
˜
I[i]
=
I[i − 2] + I[i − 1] + I[i]+I[i +1]+I[i +2]
5
. (1)
Histogram deviation D is computed as
D =
255
i=0
|i − M|·
˜
I[i]
255
i=0
˜
I[i]
,(2)
where M is the mean value:
M =
255
i=0
i ·
˜
I[i]
255
i=0
˜
I[i]
. (3)
The focus measure is computed by convolving each block
with a simple 3 × 3 Laplacian filter.
In order to discard irrelevant high-frequency pixels
(mostly noise), the outputs of the convolution at each pixel
Content-Dependent Exposure Correction 1851
m
1
m
2
m
3
m
4
m
5
m
6
m
7
m
8
m
9
m
10
m
11
m
12
m
13
m
14
m
15
m
16
m
17
m
18
m
19
m
20
m
21
m
22
m
23
m
24
m
25
(a) (b) (c) (d)
Figure 2: Features extraction pipeline (for focus and contrast w ith N = 25). Visual relevance of each luminance block (b) of the input image
(a) is based on relevance measures (c) able to obtain a list of relevant blocks (d).
are thresholded. The mean focus value of each block is com-
puted as
F =
N
i=1
thresh[lapl(i), Noise]
N
,(4)
where N is the number of pixels and the thresh(·)operator
discards values lower than a fixed threshold Noise. Once the
values F and D are computed for all blocks, relevant regions
will be classified using a linear combination of both values.
Features extraction pipeline is illustra ted in Figure 2.
2.2. Features extraction: skin recognition
As before a visibility image obtained by forcing the mean gray
level of the luminance channel to be about 128 is built.
Most existing methods for skin color detection usually
threshold some sort of measure of the likelihood of skin
colors for each pixel and treat them independently. Human
skin colors for m a special category of colors, distinctive from
the colors of most other natural objects. It has been found
that human skin colors are clustered in various color spaces
[17, 18]. The skin color variations between people are mostly
due to intensity differences. These variations can therefore be
reduced by using chrominance components only.
Yang et al . [ 19] have demonstrated that the distribu-
tion of human skin colors can be represented by a two-
dimensional Gaussian function on the chrominance plane.
The center of this distribution is determined by the mean
vector
µ and its shape is determined by the covariance matrix
Σ; both values can be estimated from an appropriate training
data set. The conditional probability p(
x
|s)ofablockbe-
longing to the skin color class, given its chrominance vector
x is then represented by
p
x
s
=
1
2π
|Σ|
−1/2
exp
−
d(
x)
2
2
,(5)
where d(
x) is the so-called Mahalanobis distance from the
vector
x to the mean vector
µ andisdefinedas
d(
x)
2
= (
x −
µ)
Σ
−1
(
x −
µ). (6)
The value d(
x) determines the probability that a given
block belongs to the skin color class. The larger the dis-
tance d(
x), the lower the probability that the block belongs
to the skin color class s. Such class has been experimentally
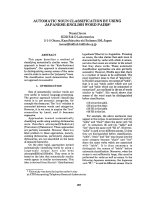
(a) (b) (c)
Figure 3: Skin recognition examples on RGB images: (a) original
images acquired by Nokia 7650 phone (first and second row) with
VGA sensor and compressed in JPEG format; (b) simplest threshold
method output; and (c) probabilistic threshold output. Third image
(a) is a standard test image.
derived using a large data set of images acquired at differ-
ent conditions and resolution using CMOS-VGA sensor on
“STV6500-E01” evaluation kit equipped with “502 VGA sen-
sor”[20].
Due to the large quantity of color spaces, distance mea-
sures, and two-dimensional distributions, many skin recog-
nition algorithms can be used. T he skin color algorithm is
independent of exposure correction, thus we introduce two
different alternative techniques aimed to recognize skin re-
gions (as shown in Figure 3).
(1) By using the input YCbCr image and the conditional
probability (5), each pixel is classified as belonging to
a skin region or not. Then a new image with normal-
ized gray-scale values is derived, where skin areas are
1852 EURASIP Journal on Applied Signal Processing
(a) (b)
10.90.80.70.60.50.40.30.20.10
g
0
0.1
0.2
0.3
0.4
0.5
0.6
0.7
0.8
0.9
1
r
(c)
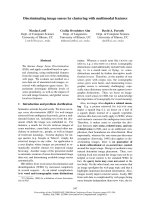
Figure 4: Skin recognition examples on Bayer pattern image: (a)
original image in Bayer data; (b) recognized skin with probabilis-
tic approach; and (c) threshold skin values on r − g bidirectional
histogram (skin locus).
properly highlighted (Figure 3c). The higher the gray
value the higher the probability to compute a reliable
identification.
(2) By processing an input RGB image, a 2D chrominance
distribution histogram (r, g) is computed, where r =
R/(R+G+B)andg = G/(R+G+B). Chrominance val-
ues representing skin are clustered in a specific area of
the (r, g) plane, called “skin locus”(Figure 4c), as de-
fined in [21]. Pixels having a chrominance value be-
longing to the skin locus will be selected to correct ex-
posure.
For Bayer data, the skin recognition algorithm works on the
RGB image created by subsampling the original picture, as
described in Figure 1.
2.3. Exposure correction
Once the visually relevant regions are identified, the expo-
sure correction is carried out using the mean gray value
of those regions as reference point. A simulated camera re-
sponse curve is used for this purpose, which gives a n esti-
mate of how light values falling on the sensor become final
pixel values (see Figure 5). Thus it is a function:
f (q)
= I,(7)
where q represents the “light” quantity and I the final pixel
10−1−2−3−4−5−6
q
0
50
100
150
200
250
300
Pixel value
Figure 5: Simulated camera response.
value [1]. This function can be expressed [14, 22] by using a
simple parametric closed form representation:
f (q) =
255
1+e
−(Aq)
C
,(8)
where parameters A and C can be used to control the shape
of the curve and q is supposed to be expressed in 2-based log-
arithmic unit (usually referred as “stops”). These parameters
could be estimated, depending on the specific image acquisi-
tion device, using the techniques described in [22] or chosen
experimentally. The offset from the ideal exposure is com-
puted using the f curve and the average gray level of visually
relevant regions avg as
∆ = f
−1
(Trg) − f
−1
(avg), (9)
where Trg is the desired target gray l evel. Trg should be
around 128 but its value could be slightly changed especially
when dealing with Bayer pattern data where some postpro-
cessing is often applied.
The luminance value Y(x, y) of a pixel (x, y) is modified
as follows:
Y
(x, y) = f
f
−1
Y(x, y)
+ ∆
. (10)
Note that all pixels are corrected. Basically the previ-
ous step is implemented as a lookup table (LUT) transform
(Figure 6 shows two correction curves with different A, C pa-
rameters). Final color reconstruction is done using the same
approach described in [23] to prevent relevant HUE shifts
and/or color desaturation:
R
= 0.5 ·
Y
Y
· (R + Y)+R − Y
, (11)
G
= 0.5 ·
Y
Y
· (G + Y)+G − Y
, (12)
B
= 0.5 ·
Y
Y
· (B + Y)+B − Y
, (13)
where R, G,andB are the input color values.
Note that when Bayer pattern is used (10) is directly ap-
plied on RGB pixels.
Content-Dependent Exposure Correction 1853
300250200150100500
Input
0
50
100
150
200
250
300
Output
(a)
300250200150100500
Input
0
50
100
150
200
250
300
Output
(b)
Figure 6: LUTs derived from curves with (a) A = 7andC = 0.13 and (b) A = 0.85 and C = 1.
Output imageRGB scaling
8bits8bits 24bits
Corrected Y
Input image
Y correction
Input image
Y channel
Corrective curve
Mean of relevant
blocks
Input image
Y channel
Relevant blocks
identification
Measures
computation
Blocks
subdivision
Visibility image
Y channel
8bits 8bits
Mean of skin
pixels
8bits
Input image
Y channel
Skin pixels % >T
Visibility image
Visibility image
construction
Input image
24 bits24 bits24 bits24 bits
24 bits
Skin
identification
Figure 7: Automatic exposure correction pipeline: given a color image as input (for Bayer data image the pipeline is equivalent), the visibility
image is extracted using a forced gray-level mean of about 128, then the skin percentage measure is achieved to seek if the input image
contains skin features. In the case of skin feature existence (the value is more than the threshold T), the mean of selected skin pixel is
achieved. If skin is not present the contrast and focus measures are computed and the mean of relevant blocks is performed. Finally, by fixing
the correction curve, the exposure adjustment of luminance channel is accomplished.
3. COMPLEXITY ANALYSIS
The computational resources required by the algorithm de-
scribed are negligible and indeed the whole process is well
suited for real-time applications. Instead of the asymptotic
complexity, the arithmetic complexity has b een described
to estimate the algorithm real-time execution [16]. More
precisely, the sum of operations per pixel has been com-
puted.
The following weights will be used:
(1) w
a
for basic arithmetic operations: additions, subtrac-
tions, comparisons, and so forth;
(2) w
m
for semicomplex arithmetic operations: multipli-
cations, and so forth;
(3) w
l
for basic bits and logical operations: bits-shifts, log-
ical operations, and so forth;
(4) w
c
for complex arithmetic operations: divisions, expo-
nentials, and so forth.
First the main functions of the algorithm will be analyzed;
then the overall C complexity will be estimated.
A simple analysis of the computational cost can be car-
ried out exploiting the main processing blocks composing
the working flow of Figure 7 and considering the worst-case
1854 EURASIP Journal on Applied Signal Processing
scenario, when the algorithm is applied directly on the RGB
image. The following assumptions are considered:
(1) the image consists in N × M = tot pixels and V × H =
num blocks;
(2) the inverse f
−1
of the f function is stored in a 256-
element LUT;
(3) the value calculated by the function f (10)isestimated
by scanning the curve bottom-up (if ∆ > 0) searching
for the first LUT index I,whereLUT[i] > LUT[ y]+
∆,ortop-down(if∆ < 0) searching for the first LUT
index i where LUT[i] < LUT[y]+∆.Inbothcasesi
becomes the value of gray-level y after correction.
By using the above-mentioned assumptions the correction
of the Y channel can be done employing two 256-element
LUTs, the first contains the f
−1
function and the second the
outputs of (10) for each of the 256 possible gray levels. The
second LUT can be initialized with a linear search for each
gray level.
Visibility image construction
The visibility image is obtained by computing the mean of
the extracted Y and the offset from desired exposure by ap-
plying (9). Once the offset is known the visibility image is
built using equations (10)to(13).
(1) Initialization step:
(a) mean computation: 1w
a
+(1/ tot)w
c
;
(b) offset computation: (3/ tot)w
a
;
(c) corrective curve uploading: (2k/ tot)w
a
,wherek
has a mean value of about 70 in the worst case.
(2) Color correction:
6w
a
+6w
m
+3w
c
. (14)
Therefore
C
1
=
7+
2k +3
tot
w
a
+6w
m
+
3+
1
tot
w
c
. (15)
Skin identification
Since the skin probabilities are computed on Cr, Cb channels
defined in the 0–255 range (after the 128-offset addition) the
probabilities for each possible Cr, Cb pair can be precom-
puted and stored in a 256
× 256 LUT. The dimensions of this
LUT, due to its particular shape (Figure 8), can be reduced
up to 136 × 86 discarding the pairs having zero value:
(1) lookup of skin probabilities (simple access to LUT):
1w
a
;
(2) thresholding of skin probabilities: 1w
a
;
(3) computation of skin mean gray value: 1w
a
+(1/ tot)w
c
.
Therefore
C
2
= 3w
a
+
1
tot
w
c
. (16)
300
250
200
150
100
50
0
Cr
0
50
100
150
200
250
300
Cb
−0.02
0
0.02
0.04
0.06
Skin prob.
Figure 8: Skin precomputed LUT.
Measures computation
The mean, focus, and contrast of each block are computed.
(1) Mean values of each block: (num ×w
c
)/ tot (since ac-
cumulated gray levels inside each block can be ob-
tained from the visibility image and only the divisions
have to be done).
(2) Focus computation:
1w
l
+6w
a
+1w
a
+
num
tot
w
c
. (17)
(3) Contrast computation:
256
11w
a
+ w
m
+ w
c
+1w
c
num
tot
. (18)
Therefore:
C
3
=
7 + 2816
num
tot
w
a
+ w
l
+
256
num
tot
w
m
+
259
num
tot
w
c
.
(19)
Relevant blocks identification
Once focus and contrast are obtained, blocks are selected us-
ing their linear combination value:
(1) linear combination of focus and contrast: (num /
tot)(1w
a
+2w
m
);
(2) comparison between the linear combination and a se-
lection value: (num / tot)w
m
.
Therefore
C
4
=
num
tot
1w
a
+3w
m
. (20)
Content-Dependent Exposure Correction 1855
Image correction
This step can be considered computationally equivalent to
the visibility image construction since the only difference is
the mean value used for corrective LUT loading, therefore:
C
5
=
7+
2k +3
tot
w
a
+6w
m
+
3+
1
tot
w
c
. (21)
The algorithm complexity is then obtained by adding all the
above values:
C =
5
i=1
C
i
= w
l
+
21 +
4k +6
tot
+ 2817
num
tot
w
a
+
12 + 259
num
tot
w
m
+
6+
2
tot
+ 259
num
tot
w
c
.
(22)
The overall complexity is hence well suited for real-time ap-
plications (note that the ratio num / tot will always be very
small, since tot num). For example given a 640×480 VGA
input image (tot = 307 200), a fixed num = 64 blocks, and
the worst k = 70, the complexity becomes
C =
5
i=1
C
i
= w
l
+
21 +
76
307200
+ 2817
64
307200
w
a
+
12 + 259
64
307200
w
m
+
6+
2
307200
+ 259
64
307200
w
c
.
(23)
Therefore
C =
5
i=1
C
i
= w
l
+21.587w
a
+12.054w
m
+6.054w
c
. (24)
That is cost-effective and suitable for real-time processing ap-
plications.
4. EXPERIMENTAL RESULTS
The proposed technique has been tested using a large
database of images acquired at different resolutions, with dif-
ferent acquisition devices, both in Bayer and RGB format. In
Figure 7 the exposure correction pipeline is illustrated. The
whole process is organized as follows: the “visibility” image
is extracted from the input image, and then the skin percent-
age measure is achieved to determine if the input image con-
tains skin features; once the type of features is known the ex-
traction of the mean values is performed, and finally the cor-
rection is accomplished. In the Bayer case the algorithm was
inserted in a real-time framework, using a CMOS-VGA sen-
sor on STV6500-E01 evaluation kit equipped with 502 VGA
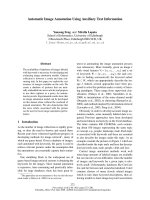
sensor [20]. In Figure 9 screen shots of the working environ-
(a)
(b)
Figure 9: Framework interface for STV6500-E01 EVK 502 VGA
sensor: (a) before and (b) during real-time skin dependent exposure
correction. The small window with black background represents the
detected skin.
ment are shown. Figure 10b illustrates the visually relevant
blocks found during the features extraction step. Examples
of skin detection by using real-time processing are reported
in Figure 11. In the RGB case the algorithm could be imple-
mented as postprocessing step. Examples of skin and con-
trast/focus exposure correction are respectively shown in Fig-
ures 10 and 12.
For sake of comparisons we have chosen both global and
adaptive techniques, able to work in real-time processing:
standard global histogram equalization and gamma correc-
tion [7] and adaptive luminance preservation equalization
technique [9]. The parameters of gamma correction have
been manually fixed to the mean value computed by the pro-
posed algorithm. Experiments and comparisons with exist-
ing methods are shown in Figures 13, 14,and15.
In Figure 13a the selected image has been captured by us-
ing an Oly mpus C120 camera. It is evident that an overexpo-
sure is required. Both equalization algorithms in Figures 13b
and 13c have introduced excessive contrast correction (the
faces and the high frequencies of the two persons have been
destroyed). The input image of Figure 14a has been captured
by using an Olympus E10 camera. In this case the adaptive
equalization algorithm in Figure 14b has performed a better
enhancement than in the previous example (Figure 13b), but
the image still contains an excessive contrast correction (the
face has lost skin luminance). The equalization in Figure 14c
1856 EURASIP Journal on Applied Signal Processing
(a) (b) (c)
Figure 10: Experimental results by postprocessing: (a) original color input image, (b) contrast and focus visually significant blocks detected,
and (c) exposure-corrected image obtained from RGB image.
(a) (b) (c)
(d) (e)
Figure 11: Experimental results by real-time and postprocessing: (a) original Bayer input image, (b) Bayer skin detected in real-time, (c)
color interpolated image from Bayer input, (d) RGB skin detected in postprocessing, and (e) exposure-corrected image obtained from RGB
image.
has completely failed the objective due to the large amount
of background lightness. The exclusion of the skin features
extraction phase is evident looking at the enhancement dif-
ference between Figures 14e and 14f. Finally, Figure 15 shows
apoorlyexposedimageinFigure 15a acquired by using an
Olympus C40Z camera. Both equalization algorithms Fig-
ures 15b and 15c have introduced excessive contrast correc-
tion (the clouds and the grass are becoming darker).
Content-Dependent Exposure Correction 1857
(a) (b)
(c) (d)
Figure 12: Experimental results: (a) original images acquired by Nokia 7650 VGA sensor compressed in JPEG format, (b) corrected output,
(c) image acquired with CCD sensor (4.1 megapixels) Olympus E-10 camera, and (d) corrected output image.
(a) (b) (c)
(d) (e)
Figure 13: Experimental results with relative luminance histograms: (a) input image, (b) adaptive equalized image using the technique
described in [9], (c) equalized image, (d) gamma correction output with fixed average value defined by the proposed method, and (e)
proposed algorithm output. The selected image (a) has been captured by using an Olympus C120 camera.
1858 EURASIP Journal on Applied Signal Processing
(a) (b) (c)
(d) (e) (f)
Figure 14: Experimental results with relative luminance histograms: (a) input image, (b) adaptive equalized image using the technique
described in [9], (c) equalized image, (d) gamma correction output with fixed average value defined by the proposed method, (e) proposed
algorithm forced without skin feature detection, and (f) proposed algorithm output. The selected image (a) has been captured by using an
Olympus E10 camera.
(a) (b) (c)
(d) (e)
Figure 15: Experimental results with relative luminance histograms: (a) input image, (b) equalized image, (c) adaptive equalized image
using the technique described in [9], (d) gamma correction output with fixed average value computed by the proposed method, and (e)
proposed algorithm output. The selected image (a) has been captured by using an Olympus C40Z camera.
Almost all gamma-corrected images in Figures 13d, 14d,
and 15d contain excessive color desaturation.
Results show how often histogram equalization, that do
not take into account images features, leads to excessive con-
trast enhancement while simple gamma correction leads to
excessive color desaturation. Therefore the features analysis
capability of the proposed algorithm permits contrast en-
hancement taking into account some strong peculiarity of
the input image.
5. CONCLUSIONS
A method for automatic exposure correction, improved by
different feature extraction techniques, has been described.
Content-Dependent Exposure Correction 1859
The approach is able to analyze the Bayer data c aptured
by a CCD/CMOS sensor, or the corresponding color gener-
ated picture; once the skin key features have been identified,
the algorithm adjusts the exposure level using a “camera re-
sponse”-like function. The method can solve some of the typ-
ical drawbacks featured by handset devices due to poor op-
tics, absence of flashgun, difficult scene lighting conditions,
and so forth. The overall computation time needed to apply
the proposed algorithm, is negligible, thus it is well suited for
real-time applications. Experiments show the effectiveness of
the techniques in both cases. Future works will investigate the
use of curvelet transform for enhanced exposure correction
[13].
REFERENCES
[1] S. Battiato, A. Castorina, and M. Mancuso, “High dynamic
range imaging for digital still camera: an overview,” Journal of
Electronic Imaging, vol. 12, no. 3, pp. 459–469, 2003.
[2] A. Bosco, M. Mancuso, S. Battiato, and G. Spampinato, “Tem-
poral noise reduction of Bayer matrixed video data,” in Proc.
IEEE International Conference on Multimedia and Expo (ICME
’02), vol. 1, pp. 681–684, Lausanne, Switzerland, August 2002.
[3] M. Mancuso, A. Bosco, S. Battiato, and G. Spampinato,
“Adaptive temporal filtering for CFA video sequences,” in
Proc. IEEE Advanced Concepts for Intelligent Vision Systems
(ACIVS ’02), pp. 19–24, Ghent University, Belgium, Septem-
ber 2002.
[4] G. Messina, S. Battiato, M. Mancuso, and A. Buemi, “Improv-
ing image resolution by adaptive back-projection correction
techniques,” IEEE Transactions on Consumer Electronics, vol.
48, no. 3, pp. 409–416, 2002.
[5]J.Holm,I.Tastl,L.Hanlon,andP.Hubel, “Colorprocess-
ing for digital photography,” in Colour Engineering: Achieving
Dev ice Independent Colour,P.GreenandL.MacDonald,Eds.,
John Wiley & Sons, New York, NY, USA, June 2002.
[6] M. Mancuso and S. B attiato, “An introduction to the digital
still camera technology,” ST Journal of System Research, vol. 2,
no. 2, pp. 1–9, 2001.
[7] R. C. Gonzalez and R. E. Woods, Digital Image Processing,
Addison-Wesley, Reading, Mass, USA, 1993.
[8] J. A. Stark, “Adaptive image contrast enhancement using gen-
eralizations of histogram equalization,” IEEE Trans. Image
Processing, vol. 9, no. 5, pp. 889–896, 2000.
[9] Y. Wang, Q. Chen, and B. Zhang, “Image enhancement
based on equal area dualistic sub-image histogram equaliza-
tion method,” IEEE Transactions on Consumer Electronics, vol.
45, no. 1, pp. 68–75, 1999.
[10] J. A. S. Centeno and V. Haertel, “An adaptive image enhance-
ment algorithm,” Pattern Recognition, vol. 30, no. 7, pp. 1183–
1189, 1997.
[11] H. D. Cheng and H. Xu, “A novel fuzzy logic approach to
contrast enhancement,” Pattern Recognition,vol.33,no.5,
pp. 809–819, 2000.
[12] J. Tang, E. Peli, and S. Acton, “Image enhancement using a
contrast measure in the compressed domain,” IEEE Signal
Processing Letters, vol. 10, no. 10, pp. 289–292, 2003.
[13] J L. Starck, F. Murtagh, E. Candes, and D. L. Donoho, “Gray
and color image contrast enhancement by the curvelet trans-
form,” IEEE Trans. Image Processing, vol. 12, no. 6, pp. 706–
717, 2003.
[14] S. A. Bhukhanwala and T. V. Ramabadran, “Automated global
enhancement of digitized photographs,” IEEE Transactions on
Consumer Electronics, vol. 40, no. 1, pp. 1–10, 1994.
[15] B. E. Bayer, “Color imaging array,” US Patent 3 971 065,1976.
[16] J. Reichel and M. J. Nadenau, “How to measure arithmetic
complexity of compression algorithms: a simple solution,” in
Proc. IEEE International Conference on Multimedia and Expo
(ICME ’00), vol. 3, pp. 1743–1746, New York, NY, USA, July–
August 2000.
[17] S. L. Phung, A. Bouzerdoum, and D. Chai, “A novel skin color
model in YCbCr color space and its application to human face
detection,” in Proc. IEEE International Conference on Image
Processing (ICIP ’02), vol. 1, pp. 289–292, Rochester, NY, USA,
September 2002.
[18]B.D.Zarit,B.J.Super,andF.K.H.Quek, “Comparisonof
five color models in skin pixel classification,” in Proc. IEEE
International Workshop on Recognition, Analysis, and Tracking
of Faces and Gestures in Real-Time Systems (RATFG-RTS ’99),
pp. 58–63, Corfu, Greece, September 1999.
[19] J. Yang, W. Lu, and A. Waibel, “Skin-color modeling and
adaptation,” Tech. R ep. CMU-CS-97-146, School of Com-
puter Science, Carnegie Mellon University, Pittsburgh, Pa,
USA, 1997.
[20] Colour S ensor Evaluation Kit VV6501, STMicroelectron-
ics, Edinburgh, www.st.com/stonline/products/applications/
consumer/ cmos
imaging/sensors/6501.htm.
[21] M. Soriano, B. Martinkauppi, S. Huovinen, and M. Laakso-
nen, “Skin color modeling under varying illumination con-
ditions using the skin locus for selecting training pixels,” in
Proc. Workshop on Real-time Image Sequence Analysis (RISA
’00), pp. 43–49, Oulu, Finland, August-September 2000.
[22] S. Mann, “Comparametric equations with practical applica-
tions in quantigraphic image processing,” IEEE Trans. Image
Processing, vol. 9, no. 8, pp. 1389–1406, 2000.
[23] S. Sakaue, M. Nakayama, A. Tamura, and S. Maruno, “Adap-
tive gamma processing of the video cameras for the expansion
of the dynamic range,” IEEE Transactions on Consumer Elec-
tronics, vol. 41, no. 3, pp. 555–562, 1995.
S. Battiato received the Ph.D. degree in
1999 in applied mathematics and computer
science from Catania University. From 1999
to 2003 he was at STMicroelectronics in the
Advanced System Technology (AST) Cata-
nia Laboratory with the Imaging Group. He
is currently a Researcher And Teaching As-
sistant in the Department of Mathematic
and Informatics at the University of Cata-
nia. His current research interests lie in the
areas of digital image processing, pattern recognition, and com-
puter vision. He acts as a reviewer for several leading international
conferences and journals, and he is author of several papers and
international patents.
A. Bosco was born in Catania, Italy, in 1972.
He received the M.S. degree in computer
science in 1997 from the University of Cata-
nia with a thesis in the field of image pro-
cessing about tracking vehicles in video se-
quences. He joined STMicroelectronics in
June 1999 as a System Engineer in the Dig-
ital Still Camera and Mobile Multimedia
Group. Since then, he has been working on
distortion artifacts of CMOS imagers and
noise reduction, both for still pictures and video. His current ac-
tivities deal with image quality enhancement and noise reduction.
Some of his works have been patented and published in various
papers in the image processing field.
1860 EURASIP Journal on Applied Signal Processing
A. Castorina received his M.S. degree in
computer science in 2000 from the Uni-
versity of Catania. His thesis is about wa-
termarking algorithms for digital images.
Since September 2000 he has been work-
ing in STMicroelectonics in the AST Digital
Still Camera Group as System Engineer. His
current activities include image enhance-
ment and high dynamic range imaging.
G. Messina received his M.S. degree in com-
puter science in 2000 from the Univer-
sity of Catania. His thesis is about statis-
tical methods for textures discrimination.
Since March 2001 he has been working at
STMicroelectronics in the Advanced System
Technology (AST) Imaging Group as Sys-
tem Engineer. His current research interests
are in the area of image processing, resolu-
tion enhancement, analysis-synthesis of tex-
ture, and color interpolation. He is author of several papers and
patents in image processing field.