Báo cáo hóa học: " Robust Face Detection in Airports" doc
Bạn đang xem bản rút gọn của tài liệu. Xem và tải ngay bản đầy đủ của tài liệu tại đây (1.24 MB, 7 trang )
EURASIP Journal on Applied Signal Processing 2004:4, 503–509
c
2004 Hindawi Publishing Corporation
Robust Face Detection in Airports
Jimmy Liu Jiang
School of Computing, National University of Singapore, Science Drive 2, Singapore 117559
Email: liujiang@pacific.net.sg
Kia-Fock Loe
School of Computing, National University of Singapore, Science Drive 2, Singapore 117559
Email:
Hong Jiang Zhang
Microsoft Research Asia, Beijing Sigma Cente r, Beijing 100080, China
Email:
Received 25 December 2002; Revised 3 October 2003
Robust face detection in complex airport environment is a challenging task. The complexity in such detection systems stems from
the variances in image background, view, illumination, articulation, and facial expression. This paper presents the S-AdaBoost, a
new variant of AdaBoost developed for the face detection system for airport operators (FDAO). In face detection application, the
contribution of the S-AdaBoost algorithm lies in its use of AdaBoost’s distribution weight as a dividing tool to split up the input
face space into inlier and outlier face spaces and its use of dedicated classifiers to handle the inliers and outliers in their corre-
sponding spaces. The results of the dedicated classifiers are then nonlinearly combined. Compared with the leading face detection
approaches using both the data obtained from the complex airport environment and some popular face database repositories,
FDAO’s experimental results clearly show its effectiveness in handling real complex environment in airports.
Keywords and phrases: S-AdaBoost, face detection, divide and conquer, inlier, outlier.
1. INTRODUCTION
Ahumanfacedetection[1, 2, 3]systemcanbeusedfor
video surveillance and identity detection. Various ap-
proaches, based on feature abstraction and statistical analy-
sis, have been proposed. Among them, Rowley and Kanade’s
neural network approach [4], Viola’s asymmetric AdaBoost
cascading approach [1], and support vector machine (SVM)
approach [5] are a few of the leading ones. In the real world,
the complex environment associated with the face pattern
detection often makes the detection very complicated.
Boosting is a method used to enhance the performance of
the weak learners (classifiers). The first provable polynomial-
time boosting model [6] was developed from the probably
approximately correct (PAC) theory [7], followed by the Ad-
aBoost model [8], which has been developed into one of the
simplest yet effective boosting algorithms in recent years.
In pattern detection and classification scenarios, the
training input patterns are resampled in AdaBoost after ev-
ery round of iteration. Easy patterns in the training set are
assigned lower distribution weights; whereas the difficult pat-
terns, which are often misclassified, are given higher distri-
bution weights. After certain rounds of iteration, based on
the values of the distribution weights assigned to the training
input patterns, input training patterns can be classified into
inliers (easy patterns) and outliers (difficult patterns).
When AdaBoost is used to handle scenarios in complex
environment with many outliers, its limitations have been
pointedoutbymanyresearchers[9, 10, 11, 12, 13, 14]. Some
discussions and approaches [15, 16, 17, 18, 19]havebeen
proposed to address these limitations.
Based on the distribution weights associated with the
training patterns and applying the divide and conquer prin-
ciple, a new AdaBoost algorithm, S-AdaBoost (suspicious
AdaBoost), is proposed to enhance AdaBoost’s capability of
handling outliers in real-world complex environment.
The rest of the paper is organized as follows. Section 2
introduces S-AdaBoost structure, describes S-AdaBoost’s di-
vider, classifiers, and combiner, as well as compares the S-
AdaBoost algorithm with other leading approaches on some
benchmark databases. Section 3 introduces face detection for
airport operators (FDAO) system and discusses S-AdaBoost
algorithm in the domain of face pattern detection in the com-
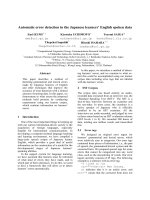
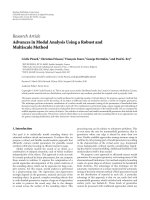
plex airport environment (as shown in Figure 1), where clear
frontal-view potential face images cannot be assumed, and
504 EURASIP Journal on Applied Signal Processing
Figure 1: Typical scenarios in complex airport environment.
where minimum outliers are not norms. Section 3 also com-
pares the performance of FDAO with other leading face de-
tection approaches and followed by discussions in Section 4.
2. S-ADABOOST IN CLASSIFICATION
2.1. Input pattern analysis in S-AdaBoost
The divide and conquer principle is used in S-AdaBoost to di-
vide the input pattern space S into a few subspaces and con-
quer the subspaces through simple fittings (decision bound-
aries) to the patterns in the subspaces. Input space can be
denoted by
S =
P = (X, Y)
,(1)
where
X ={x
i
} denotes the input patterns,
Y ={y
i
} denotes the classification results,
P ={p
i
={(x
i
, y
i
)}} denotes the input pattern and
classification result pairs.
In S-AdaBoost, patterns in S can be divided into a few
subsets relative to a classifier T(x):
S = S
no
+ S
sp
+ S
ns
+ S
hd
,(2)
where,
S
no
={P
no
}:normalpatterns(patternscanbeeasily
classified by T(x)),
S
sp
={P
sp
}: special patterns (patterns can be classified
correctly by T(x)withbearableadjustment),
S
ns
={P
ns
}: patterns with noise (noisy patterns),
S
hd
={P
hd
}: hard-to-classify patterns (patterns hard
to be classified by T(x)).
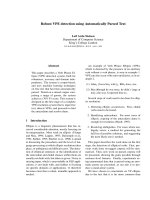
A t ypical input pattern space is shown in Figure 2.The
first two subspaces are further collectively referred to as ordi-
nary pattern space (inlier space), and the last two are collec-
tively called outliers space in S-AdaBoost:
S
od
= S
no
+ S
sp
,
S
ol
= S
ns
+ S
hd
.
(3)
As shown in Figure 2, it is noticed that classifying all pat-
terns in S using a single classifier T(x) with a simple decision
Normal patterns
Patterns with noise
Special patterns
Hard-to-classify patterns
Figure 2: Input pattern space.
boundary can be difficult sometimes. Nevertheless, after di-
viding S into S
od
and S
ol
, it is relatively easier for an algorithm
like AdaBoost to classify S
od
well with a not very complicated
decision boundary. However, to correctly classify both S
od
and S
ol
well using only one classifier T(x)inS, the trade-off
between the complexity and generalization of the algorithm
needs to be considered. It is well understood that more com-
plex T(x) yields lower training errors yet runs the risk of poor
generalization [1]. It is confirmed by a number of researchers
[4, 5, 6, 7, 8, 9] that if a system is to use AdaBoost alone to
classify both S
od
and S
ol
well, T(x) will focus intensively on
P
ns
and P
hd
in S
ol
and the generalization characteristic of the
system will be affected in real-world complex environment.
2.2. S-AdaBoost machine
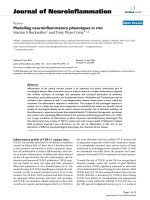
During training, instead of using single classifier (as shown
in Figure 3) to fit all the training samples (often with outliers)
as done in AdaBoost, S-AdaBoost uses an AdaBoost V(v)as
a divider to divide the patterns in the training input space S
into two separate sets in S
od
and S
ol
. One set in S
od
is used to
train the AdaBoost classifier T
od
(x), which has good general-
ization characteristic, and the other set in S
ol
is used to train
a dedicated outlier classifier T
ol
(x), which has good localiza-
tion capability. The structure of the S-AdaBoost machine is
shown in Figure 4.
As the divider is used to separ ate the training input pat-
terns to train the two dedicated classifiers, it is no longer
needed in testing phase. The dedicated classifiers can make
their independent classifications for any new inputs from the
entire pattern space.
2.3. S-AdaBoost divider
An AdaBoost V(v) in the S-AdaBoost machine divides the
original training set into two separate sets contained in S
od
and S
ol
, respectively. The same AdaBoost algorithm is used
in both the divider V(v) and the classifier T
od
(x)toensure
the optimal performance of the classifier T
od
(x).
In AdaBoost, input patterns are associated with dist ribu-
tion weights. The distribution weights of the more “outlying”
Robust Face Detection in Airports 505
Normal patterns
Patterns with noise
Special patterns
Decision boundary
Hard-to-classify patterns
Figure 3: Single classifier for the input pattern space.
Input
patterns
AdaBoost
divider
Ordinary
patterns
AdaBoost
classifier
Combiner
Result
Outliers
Outlier
classifier
Figure 4: S-AdaBoost machine in training.
patterns increase after each iteration; and the distribution
weights of the more “inlying” (or more “ordinary”) patterns
decrease after every iteration. When the distribution weight
of a pattern reaches certain threshold, the chance of the pat-
tern being an “outlier” is high. This property is used in V(v)
to divide the input patterns into inliers (ordinary patterns)
and outliers. The pseudocode of the AdaBoost divider V(v)
based on a given weak learning algorithm W for a two-class
classification can be described as in Algorithm 1.
It is task specific to choose the optimal value for the
threshold v. The implication of the optimal value will be dis-
cussed in the following sections.
2.4. S-AdaBoost’s classifiers and combiner
After the training sets in input space S being divided into S
od
and S
ol
, P
no
and P
sp
are used to train the T
od
(x) classifier,
whereas P
ns
and P
hd
are used to train the T
ol
(x) classifier in
the S-AdaBoost machine.
After certain rounds of iteration, T
od
(x) classifier focuses
more on the relative difficult P
sp
and less on the relative easy
P
no
in forming the decision boundary. As P
sp
are not out-
liers, the accuracy and generalization of the classifier T
od
(x)
is maintained. Making use of the randomness nature of P
ns
,
T
ol
(x), a classifier with good localization characteristic, can
identify the local clustering of P
hd
and at the same time iso-
late P
ns
from P
hd
.
Given: Weak learning algorithm W.
Training patterns: S = P ={p
i
= (x
i
, y
i
)} for
i = 1toM,
where M stands for the number of the training
patterns;
x
i
∈ X stands for the input patterns;
y
i
∈ Y ={−1,1} stands for the targeted
output;
number of iteration T;
the threshold value v.
L0: Initialize the two subspaces:
S
od
= S; S
ol
={·};
m
= M.
L1: Initialize distribution D (distribution weights of
training patterns):
set D
1
(i) =
1
m
for all i
= 1tom;
set iteration count t = 1;
set divide = 0;
set initial error rate
1
= 0.
L2: Iterate while
t
< 0.5andt ≤ T.CallW
algorithm with distribution D
i
:
obtain from W the hypothesis
h
t
: X −→ Y;
calculate the weighted error r ate:
t
=
i:h
t
(x
i
)!=y
i
D
t
(i);
set β
t
=
t
(1 −
t
)
;
update the new distribution D for i
= 1tom:
D
t+1
(i) =
D
t
(i)β
Sign(h
t
(x
i
)=y
i
)
t
z
t
,
where Z
t
is a normalization factor chosen such
that the new distribution D
t+1
is a normalized
distribution.
t ++.
For i
= 1tom,
BEGIN
If D
t
(i) > the threshold value v,
BEGIN
m
= m − 1;
S
od
= S
od
− P
i
;
S
ol
= S
ol
+ P
i
;
divide = 1.
END
If divide
= 1,
go to L1.
END
L3: Export the ordinary pattern subspace S
od
and the
outlier subspace S
ol
.
Algorithm 1
Noticing that classifiers T
od
(x)andT
ol
(x)areofdiffer ent
structure and nature, a nonlinear combiner C¸ instead of a
linear one is used to combine the classification results from
T
od
(x)andT
ol
(x) to generate the final classification result.
506 EURASIP Journal on Applied Signal Processing
If threshold v ≤ 0, then
{ S
od
={·};
all the patterns in S are treated as outliers;
the S-AdaBoost becomes a l arge memory network;
T
ol
(x) determines the performance of S-AdaBoost.
}
If threshold v ≥ 1, then
{ S
ol
={·};
no patterns in S are treated as outliers;
the performance of S-AdaBoost is determined by T
od
(x);
S-AdaBoost machine becomes AdaBoost machine.
}
Algorithm 2
2.5. Choose threshold v value in S-AdaBoost divider
Threshold v plays a very important role in S-AdaBoost. This
is noticed from Algorithm 2. AdaBoost can be considered as
a special implementation of S-AdaBoost when threshold v
value is greater than or equal to 1.
The optimal value of threshold v is associated with the
classification task itself and the nature of patterns in S.Ex-
periments were conducted to determine the optimal value
for threshold v (as shown in Sections 2.6 and 3). From the ex-
periments conducted, as a guideline, S-AdaBoost performed
reasonably well when the value of threshold v was around
1/(M×∂
2
), where M is the number of training patterns and ∂
is the false positive rate of S-AdaBoost when threshold v = 1
(the AdaBoost’s false positive rate).
2.6. Experiments on benchmark databases
From the “soft margin” approach, the regularized AdaBoost
[19] has been regarded as one of the most effective classi-
fiers handling outliers; mistrust is introduced to be associ-
ated with the training patterns to alleviate the distortion that
an outlier can cause to the margin distribution. The mis-
trust values are calculated based on the weights calculated for
those training patterns. Considering that the regularized Ad-
aBoost approach demands vast computational resources to
obtain the optimal parameters, S-AdaBoost is simpler, faster,
and easy to be implemented.
Experiments were conducted to test the effectiveness
of the S-AdaBoost algorithm on the GMD benchmark
databases [20], which include samples from UCI [21],
DELVE [22], and Statlog [23] benchmark repositories. The
test results obtained from some leading algorithms, namely,
AdaBoost, SVM, regularized AdaBoost [19], and S-AdaBoost
(when threshold v is set to 1/(M × ∂
2
), where ∂ is the error
rate of AdaBoost machine) were shown in Table 1 . Ten cross-
validation method was used in all the experiments, the means
and standard deviations of the results are both listed.
From Ta ble 1, it is shown that S-AdaBoost performs the
best in terms of general performance and achieves the best re-
sults in 10 out of 13 tests; S-AdaBoost outperforms AdaBoost
in all the 13 tests as well as outperforms SVM and regularized
Table 1: Error rates of some leading approaches on benchmark
databases.
Database AdaBoost SVM Reg. AdaBoost S-AdaBoost
Banana 10.8 ± 0.811.0 ± 0.710.9 ± 0.710.6 ± 0.5
B. Cancer 30.8 ± 4.026.3 ± 4.526.5 ± 4.326.1 ± 4.3
Diabetes 26.8 ± 2.0 23.7 ± 2.0 23.8 ± 2.3 23.5 ± 1.6
German 27.5 ± 2.422.8 ± 2.024.3 ± 2.323.8 ± 2.4
Heart 20.8 ± 3.216.4 ± 3.216.5 ± 3.315.9 ± 3.1
Image 2.9 ± 0.92.8 ± 0.52.7 ± 0.42.7 ± 0.5
Ringnorm 1.9 ± 0.41.6 ± 0.21.6 ± 0.11.7 ± 0.2
F. Sonar 35.7 ± 1.632.0 ± 1.634.2 ± 1.831.6 ± 1.8
Splice 10.4 ± 1.110.6 ± 0.79.5 ± 1.09.3 ± 0.8
Thyroid 4.5 ± 2.14.9 ± 1.84.6 ± 2.04.3 ± 2.0
Titanic 23.1 ± 1.422.2 ± 1.222.6 ± 1.222.2 ± 1.1
Twonorm
3.0 ± 0.22.7 ± 0.22.7 ± 0.32.7 ± 0.2
Waveform 10.6 ± 1.39.8 ± 1.39.8 ± 1.19.6 ± 1.0
Average 16.1 14.5 14.6 14.1
AdaBoost, which are the two leading approaches in handling
complex environment.
3. S-ADABOOST FOR FACE DETECTION IN AIRPORT
3.1. FDAO
Real-time surveillance cameras are used in FDAO (as shown
in Figure 5) to scan crowds and detect potential face images.
An international airport has been chosen as the piloting com-
plex environment to test the effectiveness of FDAO. Poten-
tial face images are to be detected in complex airport back-
grounds, which include different configurations of illumina-
tion, pose, occlusion, and even make-up.
3.2. FDAO system training
Two CCD cameras with a resolution of 320 × 256 pixels were
installed in the airport to collect training images for FDAO.
Out of all the images collected, 5000 images with one or mul-
tiple face images were selected for this experiment. The 5000
raw images were further divided into two separate datasets,
one of the datasets contained 3000 raw images and the other
contained the remaining 2000 raw images. More than 7000
face candidates were cropped by hand from the 3000-image
dataset as the training set for FDAO, and the 2000-image
dataset was chosen as the test set. Five thousand nonface im-
ages (including images of carts, luggage, and pictures from
some public image banks, etc.) were used (2500 images as
the training set and the remaining 2500 images as the test
set) as nonface image dataset. All the above training images
were resized to 20×20 pixels and the brightness of the images
were normalized to the mean of zero and standard deviation
of one before being sent for training.
The preprocessor (as show n in Figure 5)actsasafilterto
generate a series of potential face patches with 20 × 20-pixel
resolution from the input image with the brightness normal-
ized to the mean of zero and the standard deviation of one.
Robust Face Detection in Airports 507
Raw
images
Pre-
processor
Potential
face
images
AdaBoost
face
identifier
Outlier
classifier
MLP
combiner
Face
Nonface
Figure 5: FDAO.
Simple edge detection techniques are used to remove some
of the obvious nonface patches. The preprocessor is designed
in such a way to generate extra candidates than the real num-
ber of faces from the original images to avoid face images not
being detected.
The ordinary pattern (inlier) classifier T
od
(x) and the
AdaBoost divider V(v) (as shown in Figure 5) share the same
structure. The base classifier is implemented by a fully con-
nected three-layer (400 input nodes, 15 hidden nodes, and
1 output node) back-propagation (BP) neural network. BP
neural network is chosen due to its good generalization ca-
pability. As face patterns are highly nonlinear, the nonlinear
distributed representation and the highly connected struc-
ture of the BP base classifier suit the nature of the face detec-
tion problem.
The outlier classifier T
ol
(x) is implemented by a three-
layer radial basis function (RBF) neural network (400 in-
put nodes, dynamic number of hidden nodes, and 1 output
node). The RBF neural network is chosen due to its good
localization characteristic. The radii of the hidden nodes in
the RBF neural network are also set to be very small to
enhance RBF network’s good local clustering characteristic,
which helps to isolate the noisy patterns P
ns
from the hard-
to-classify patterns P
hd
.
Two confidence-values outputs from the above classifiers
are used as the inputs to the combiner C¸ . The combiner C¸
is implemented by a three-layer BP neural network (2 input
nodes, 3 hidden nodes, and 1 output node).
The reason of choosing a nonlinear network to imple-
ment the combiner C¸ instead of using a linear one is due
to the consideration that the hidden layer nodes in nonlin-
ear network enable the neural network to learn the complex
relationship between the two confidence-values outputs by
the two different neural network classifiers. As the RBF net-
work and BP-based AdaBoost used to implement the dedi-
cated classifiers are of different structure and nature, a non-
linear combiner is able to learn their complex relationship
better than a linear one.
3.3. Testing result analysis
To test the effectiveness of S-AdaBoost’s face detection ca-
pability, the performance of FDAO (when threshold v was
setat1/(M
× ∂
2
)) was compared with other leading ap-
proaches. Rowley and Kanade’s neural network approach [4],
Viola’s asymmetric AdaBoost cascading approach [1], and
SVM approach [5] were implemented. To compare various
Table 2: Error rates of different approaches.
Approach Rowley Viola SVM S-AdaBoost
Detection
error rate
29.4% 27.1% 27.7% 25.5%
±±± ±
3.2% 2.9% 3.0% 3.5%
approaches using consistent methodology, the detection error
rate δ of the four algorithms is computed in our test: detec-
tion error rate δ = (number of face images wrongly classified
as nonface images + number of nonface images wrongly clas-
sified as face images)/ number of faces in the test set.
To compare the effectiveness of different approaches in
real complex airport environment, the same training and
testing face as well as nonface datasets (as used in FDAO)
were used in our experiment. During testing, the prepro-
cessed data (20 × 20 images) were fed directly to T
od
(x)and
T
ol
(x). The testing results obtained from various approaches
are listed in Tabl e 2 .
Compared with the other three leading approaches on
FDAO databases, it is shown that the S-AdaBoost approach
performs the best in the experiment. Detail analysis of the S-
AdaBoost in FDAO reviews that quite a number of “noisy”
patterns and outliers are actually filtered to the T
ol
(x), which
results in optimal performance of T
od
(x). The nonlinear
combiner also contributes to the good performance of the
system.
SVM-based face detection approaches use a small set
of support vectors to minimize the structure risk. A lin-
early constrained quadratic programming problem, which is
time and memory intensive, needs to be solved in the same
time to estimate the optimal hyperplane. In the real world,
the outliers are often misclassified as the support vectors in
SVM-based approaches. Compared w ith the SVM-based ap-
proaches, S-AdaBoost is faster and divides the input patterns
into inliers (ordinary patterns) and outliers to make sure the
outliers are not influencing the classification of the ordinary
patterns. Viola and Jones’ approach is a rapid approach able
to process the 15 fps (frame per second) 384 × 288 pixel
gray-level input images in real time. Through introducing
“integral image” representation scheme and using cascad-
ing multi-AdaBoost for feature selection and background-
clearing, the system achieves very good performance. Com-
pared with the Viola and Jones’ approach, which uses more
than 30 layers of AdaBoost machines in their implementa-
tion, S-AdaBoost uses just two layers of AdaBoost machine.
It is less complex and can work in the normal CCD camera’s
rate of 60 fps.
Further comparison between the results in Table 1 and
those in Table 2 shows that S-AdaBoost outperforms other
methods more in Table 2 than in Ta ble 1,whichmightbedue
to the fact that the data collected in FDAO is more “raw” and
“real” than the data collected in the benchmark datasets in
Table 1.
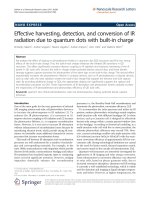
To further compare, 50 testing images (.
cmu.edu/demos/faceindex/ Submissions 1–13 on 19, Octo-
ber, 2002 and Submissions 4–40 on 18, October, 2002) were
508 EURASIP Journal on Applied Signal Processing
sent to CMU face detection test program (.
cmu.edu/cgi-bin/demos/findface.cgi) for analysis. The false
positive rate obtained from the 50 testing images set was
58% and the number of false face images detected was 28.
In FDAO system, the false positive rate obtained on the same
50 testing images set was 20% and the number of false face
images detected was 8. Some of the detected faces by CMU
(left two pictures) and S-AdaBoost system (right two pic-
tures) are shown in Figure 6 (CMU program has 2 correct
detections and 1 wrong detection in the first picture and 1
wrong detection in the second picture, whereas, S-AdaBoost
has 3 correct detections in the first picture and no wrong de-
tection in the second picture).
3.4. AdaBoost divider and the threshold v value
in FADO
The AdaBoost divider plays a very important role in the
S-AdaBoost architecture. From the algorithm described in
Section 2.3, it is observed that initially all the training pat-
terns are assigned equal distribution weights (in L1). After
certain rounds of iterations, the difficult patterns are assigned
higher distribution weight (in L2); if the distribution weights
exceed a threshold value v, S-AdaBoost treats those t raining
pattern as outliers (in L3), which include the patterns with
noise and the hard-to-classify patterns.
To test how good AdaBoost is at separating the patterns
and to further analyze the influence of the threshold v on the
overall performance of the system, a series of experiments
was conducted. T hrough choosing different threshold v val-
ues, different sets of T
od
(x)andT
ol
(x) were generated, and
different S-AdaBoost machines were thus trained to generate
the corresponding test results. To measure the effectiveness
of the S-AdaBoost machine, two error rates were measured,
namely, the false positive rate as well as the detection error
rate δ defined in Section 3.3. The experimental results are
shown in Figure 7.
In Figure 7, the Y-axis denotes the error rate, while X-
axis (not proportional) denotes the value of threshold v.Itis
found that with the threshold v gradually increased from 0
(when all patterns were treated as outliers), the error rates of
S-AdaBoost decreased slowly, then the error rates dropped
faster and became stable for a while before they went up
slowly (finally, the false positive rate reached ∂ and the de-
tection error rate reached δ). After examining the patterns in
S
ol
for different threshold values, it was observed that when
threshold v was small, most of the patterns in S were in
S
ol
, and the system’s generalization char acteristic was poor,
which resulted in high error rates. Along with the increment
of threshold v,moreandmoreP
no
and P
sp
were divided into
S
od
and more genuine clusterings of P
hd
were detected in S
ol
;
the error rates went down faster and then reached an optimal
range with threshold v increased further; some P
hd
and P
ns
patterns divided into S
od
; T
od
(x) t ried progressively harder to
adopt these outlying patterns, which resulted in slow rising
of error rates. The false positive rate reached ∂ and detection
error rate reached δ when all the patterns in S were divided
into S
od
like the experiments described in Section 2.6. Testing
results showed that S-AdaBoost performed reasonably well
Figure 6: Faces detected by CMU program and S-AdaBoost.
Error rate
0.65
0.46
0.31(∂)
0.26(δ)
0.18
0.001 0.003 0.1
t
False positive rate
Detection error rate
Figure 7: Error rates.
when the value of threshold v was around 1/(M × ∂
2
), where
M was the number of training patterns.
4. DISCUSSION AND CONCLUSIONS
S-AdaBoost, a new variant of AdaBoost, is more effective
than the conventional AdaBoost in handling outliers in real-
world complex environment. FDAO is introduced as a prac-
tical system to support the above claim. Experimental results
on benchmark databases and comparison with other lead-
ing face detection methods on FDAO datasets clearly show
S-AdaBoost’s effectives in handling pattern classification ap-
plication in complex environment and FDAO’s capability in
boosting face detection in airport environment. Future im-
provements will focus on theory exploration of the threshold
value and better understanding of the dividing mechanism
in the S-AdaBoost architecture.
Robust Face Detection in Airports 509
REFERENCES
[1] P. Viola and M. Jones, “Fast and robust classification us-
ing asymmetric AdaBoost and a detector cascade,” in Neu-
ral Information Processing Systems, pp. 1311–1318, Vancouver,
British Columbia, Canada, December 2001.
[2] M H. Yang, D. J. Kriegman, and N. Ahuja, “Detecting faces in
images: a survey,” IEEE Trans. on Pattern Analysis and Machine
Intelligence, vol. 24, no. 1, pp. 34–58, 2002.
[3] S. Z. Li, L. Zhu, Z. Q. Zhang, A. Blake, H. J. Zhang, and
H. Shum, “Statistical learning of multi-view face detection,”
in Proc. 7th European Conference on Computer Vision, pp. 67–
81, Copenhagen, Denmark, May 2002.
[4] H. A. Rowley, S. Baluja, and T. Kanade, “Neural network-
based face detection,” IEEE Trans. on Pattern Analysis and
Machine Intelligence, vol. 20, no. 1, pp. 23–38, 1998.
[5] E. Osuna, R. Freund, and F. Girosi, “Training support vec-
tor machines: an application to face detection,” in Proc. IEEE
Computer Society Conference on Computer Vision and Pattern
Recognition, pp. 130–136, San Juan, Puerto Rico, June 1997.
[6] L. G. Valiant, “A theory of the learnable,” Communications of
the ACM, vol. 27, no. 11, pp. 1134–1142, 1984.
[7] R. E. Schapire, “The strength of weak learnability,” Journal of
Machine Learning Research, vol. 5, no. 2, pp. 197–227, 1990.
[8] Y. Freund and R. E. Schapire, “Experiments with a new boost-
ing algorithm,” in Proc. 13th International Conference on Ma-
chine Learning, pp. 148–156, Bari, Italy, July 1996.
[9] T. G. Dietterich and E. B. Kong, “Machine learning bias, statis-
tical bias, and statistical variance of decision tree algorithms,”
Tech. Rep., Department of Computer Science, Oregon State
University, Corvallis, Ore, USA, 1995, r.
oregonstate.edu/
∼tgd/publications/index.html.
[10] J. R. Quinlan, “Bagging, boosting, and C4.5,” in Proc. 13th Na-
tional Conference on Artificial Intelligence, pp. 725–730, Port-
land, Ore, USA, August 1996.
[11] T. G. Dietterich, “An experimental comparison of three meth-
ods for constructing ensembles of decision trees: bagging,
boosting, and randomization,” Journal of Machine Learning
Research, vol. 40, no. 2, pp. 139–157, 2000.
[12] A. J. Grove and D. Schuurmans, “Boosting in the limit: max-
imizing the margin of learned ensembles,” in Proc. 15th Na-
tional Conference on Artificial Intelligence, pp. 692–699, Madi-
son, Wis, USA, July 1998.
[13] G. R
¨
atsch, “Ensemble learning methods for classification,”
M.S. thesis, Department of computer Science, University of
Potsdam, April 1998.
[14] W. Jiang, “Some theoretical aspects of boosting in the pres-
ence of noisy data,” in Proc. 18th International Conference
on Machine Learning, pp. 234–241, San Francisco, Calif, USA,
June 2001.
[15] A. Krieger, C. Long , and A. Wyner, “Boosting noisy data,” in
Proc. 18th International Conference on Machine Learning,pp.
274–281, Williamstown, Mass, USA, January 2001.
[16] J. Friedman, T. Hastie, and R. Tibshirani, “Additive logistic
regression: a statistical view of boosting,” Tech. Rep., Stanford
University, Stanford, Calif, USA, 1998.
[17] Y. Freund, “An adaptive version of the boost by majority al-
gorithm,” in Proc. 12th Annual Conference on Computational
Learning Theory, pp. 102–113, Santa Cruz, Calif, USA, 1999.
[18] C. Domingo and O. Watanabe, “MAdaBoost: a modification
of AdaBoost,” in Proc. 13th Annual Conference on Computa-
tional Learning Theory, pp. 180–189, Sydney, Australia, De-
cember 2000.
[19] G. R
¨
atsch, T. Onoda, and K R. M
¨
uller, “Soft margins for Ad-
aBoost,” Journal of Machine Learning Research, vol. 42, no. 3,
pp. 287–320, 2001.
[20] G. R
¨
atsch, http://www.first.gmd.de/∼raetsch/.
[21] UCI Machine Learning Repository, />∼mlearn/MLRepository.html.
[22] Data for Evaluating Learning in Valid Experiments, http://
www.cs.toronto.edu/∼delve/.
[23] The StatLog Repository, />Jimmy Liu Jiang received his B.S. degree in
Computer Science from the University of
Science and Technology of China in 1988,
and his M.S. degree in computer science
from the National University of Singapore
in 1992, sp ecialized in pattern recognition
and artificial intelligence. From 1999 to
2003, he completed the Ph.D. degree study
in the National University of Singapore,
specialized in imperfect data learning. His
current research interests include image understanding and bio-
informatics.
Kia-Fock Loe is an Associate Professor in
the Department of Computer Science at the
National University of Singapore. He ob-
tained his Ph.D. degree from the Univer-
sity of Tokyo. His current research interests
are neural network, machine learning, pat-
tern recognition, computer vi sion, and un-
certainty reasoning.
Hong Jiang Zhang received his Ph.D. de-
gree from the Technical University of Den-
mark and his B.S. from Zhengzhou Univer-
sity, China, both in electrical engineering, in
1991 and 1982, respectively. From 1992 to
1995, he was with the Institute of Systems
Science, National University of Singapore,
whereheledseveralprojectsinvideoand
image content analysis and retrieval and
computer vision. He also worked at MIT
Media Lab in 1994 as a Visiting Researcher. From 1995 to 1999,
he was a Research Manager at Hewlett-Packard Labs, where he was
responsible for research and technology transfers in the areas of
multimedia management, intelligent image processing, and Inter-
net media. In 1999, he joined Microsoft Research Asia, where he is
currently a Senior Researcher and Assistant Managing Director in
charge of media computing and information processing research.
Dr. Zhang has authored 3 books, over 260 referred papers, 7 spe-
cial issues of international journals on image and video processing,
content-based media retrieval, and computer vision, as well as over
50 patents or pending applications. He currently serves on the ed-
itorial b oards of five IEEE/ACM journals and a dozen committees
of international conferences.