Báo cáo hóa học: " Channel Estimation and Data Detection for MIMO Systems under Spatially and Temporally Colored Interference" potx
Bạn đang xem bản rút gọn của tài liệu. Xem và tải ngay bản đầy đủ của tài liệu tại đây (759.47 KB, 11 trang )
EURASIP Journal on Applied Signal Processing 2004:5, 685–695
c
2004 Hindawi Publishing Corporation
Channel Estimation and Data Detection for MIMO
Systems under Spatially and Temporally
C olored Interference
Yi Song
Department of Electrical and Computer Engineering, Queen’s University, Kingston, Ontario, Canada K7L 3N6
Email:
Stev en D. Blostein
Department of Electrical and Computer Engineering, Queen’s University, Kingston, Ontario, Canada K7L 3N6
Email:
Received 20 December 2002; Revised 6 November 2003
The impact of interference on multiple-input multiple-output (MIMO) systems has recently attracted interest. Most studies of
channel estimation and data detection for MIMO systems consider spatially and temporally white interference at the receiver.
In this paper, we address channel estimation, interference correlation estimation, and data detection for MIMO systems under
both spatially and temporally colored interference. We examine the case of one dominant interferer in which the data rate of the
desired user could be the same as or a multiple of that of the interferer. Assuming known temporal interference correlation as a
benchmark, we derive maximum likelihood (ML) estimates of the channel matrix and spatial interference correlation matrix, and
apply these estimates to a generalized version of the Bell Labs Layered Space-Time (BLAST) ordered data detection algorithm. We
then investigate the performance loss by not exploiting interference correlation. For a (5, 5) MIMO system undergoing indepen-
dent Rayleigh fading, we observe that exploiting both spatial and temporal interference correlation in channel estimation and data
detection results in potential gains of 1.5 dB and 4 dB for an interferer operating at the same data rate and at half the data rate,
respectively. Ignoring temporal correlation, it is found that spatial correlation accounts for about 1 dB of this gain.
Keywords and phrases: multiple-input multiple-output, interference, channel estimation, data detection.
1. INTRODUCTION
Wireless systems with multiple transmitting and receiving
antennas have been shown to have a l arge Shannon channel
capacity in a rich scattering environment [1, 2 ]. By transmit-
ting par allel data streams over a multiple-input multi-output
(MIMO) channel, it was shown that the Shannon capacity of
the MIMO channel increases significantly with the number
of transmitting and receiving antennas [2]. Layered space-
time architectures were proposed for high-rate transmission
in [3, 4]. Space-time coding techniques have also been inves-
tigated [5, 6].
While substantial research efforts have focussed on
point-to-point MIMO link performance, the impact of in-
terference on MIMO systems has received less interest. In
a cellular environment, cochannel interference (CCI) from
other cells exists due to channel reuse. In [7], channel capac-
ities in the presence of spatially colored interference were de-
rived under different assumptions of knowledge of the chan-
nel matrix and interference statistics at the transmitter. The
impact of spatially colored interference on MIMO channel
capacity was studied in [8, 9, 10]. The capacity of MIMO
systems with interference in the limiting case of a large num-
ber of antennas was studied in [11]. The overall capacity of
a group of users, each employing a MIMO link, was inves-
tigatedin[12]. The output signal-to-interference power ra-
tio (SIR) was analytically calculated in [13], when a single
data stream is transmitted over independent Rayleigh MIMO
channels. While the majority of the studies deals with chan-
nel capacity, in this paper we focus on the achievable sy mbol
error rate performance of a MIMO link with interference.
Prior results on estimation of vector channels and spa-
tial interference statistics for code division multiple access
(CDMA) single-input multiple-output systems can be found
in [14]. Most studies of channel estimation and data de-
tection for MIMO systems assume spatially and temporally
white interference. For example, in [15], maximum likeli-
hood (ML) estimation of the channel matrix using training
sequences was presented assuming temporally white interfer-
ence. Assuming perfect knowledge of the channel matrix at
686 EURASIP Journal on Applied Signal Processing
the receiver, ordered zero-forcing (ZF) and minimum mean-
squared error (MMSE) detection were studied for both spa-
tially and temporally white interference in [4, 16], respec-
tively. However, in cellular systems, the interference is, in
general, both spatially and temporally colored.
In this paper, we propose and study a new algorithm that
jointly estimates the channel matrix and the spatial interfer-
ence correlation matrix in an ML framework. We develop a
multi-vector-symbol MMSE data detector that exploits in-
terference correlation. In the case of a single dominant in-
terferer and large signal-to-noise ratio (SNR), we show that
spatial and temporal second-order interference statistics can
be decoupled in the form of a matrix Kronecker product. In
finite SNR, the decoupling of spatial and temporal statistics
of interference-plus-noise is only an approximation. We also
determine the conditions where this approximation breaks
down.
Although temporal interference correlation is difficult to
estimate in practice, our objectives are to determine the per-
formance benchmark achieved if temporal correlation was
known. As sources of temporal correlation, we consider cases
in which the data rate of the desired user is either the same as
or a multiple of that of the interferer. The new ML algorithm
serves as a performance benchmark when temporal and spa-
tial interference correlation are exploited in joint channel es-
timation and data detection. We also assess the performance
improvement obtained in more practical cases where only
part of the correlation information is exploited, including the
performance obtained by assuming temporally white inter-
ference, that is, ignoring temporal correlation.
The paper is organized as follows. In Section 2,we
present our system model of temporal and spatial interfer-
ence. In Section 3, we derive ML estimates of channel and
spatial interference correlation matrices assuming known
temporal interference correlation. In Section 4,one-vector-
symbol detection is extended to a multi-vector-symbol ver-
sion which is used to exploit temporal interference correla-
tion. In Section 5, we consider the case of one interferer and
large SNR and assess the benefits of taking temporal and/or
spatial interference correlation into account for channel esti-
mation and data detection. We then examine the level of SNR
at which the approximation of separate spatial and temporal
interference-plus-noise statistics break down. In cases where
the spatial and temporal correlation are not separable, the
performance improvement obtained by exploiting the spa-
tial correlation is evaluated. For reference, comparisons are
made to the well-known direct matrix inversion (DMI) al-
gorithm [17], generalized to multiple input signals, a batch
method that does not require estimates of channel and spa-
tial interference correlation matrices.
In this paper, the notation (
·)
T
refers to transpose, (·)
∗
refers to conjugate, (·)
†
refers to conjugate transpose, and I
N
refers to an N × N identity matrix.
2. SYSTEM MODEL
We consider a single-user link consisting of N
t
transmitting
and N
r
receiving antennas, denoted as (N
t
, N
r
). The desired
user transmits data frame by frame. Each frame has M data
vectors. The first N data vectors are used for training , so that
the desired user’s channel matrix and interference statistics
can be estimated, and the remaining data vectors are for in-
formation transmission. In a slow flat fading environment,
the received signal vector at time j is expressed as
y
j
= Hx
j
+ n
j
, j = 0, , M − 1, (1)
where x
j
is the transmitted data vector, H is the N
r
× N
t
spatial channel gain matrix, and the interference vector n
j
is zero-mean circularly symmetric complex Gaussian. We as-
sume that the channel matrix H is fixed during one frame.
This is a reasonable assumption since high-speed data ser-
vices envisioned for MIMO systems are generally intended
for low mobility users. By the same argument, it is also as-
sumed that the interference statistics are fixed during one
frame.
In practice, the interference may be both spatially and
temporally correlated. We assume that the cross correlation
between the interference vectors at time i and j is E{n
i
n
†
j
}=
Λ
Λ
Λ
M
(i, j)R,whereΛ
Λ
Λ
M
(i, j) is the (i, j)th element of an M × M
matrix Λ
Λ
Λ
M
. The (i, j)th element of matrix R is the correla-
tion between the ith and jth elements of interference vector
n
k
, k ∈ 0, , M − 1. As a result, the covariance matrix of the
concatenated interference vector
¯
n = [n
T
0
···n
T
M−1
]
T
is
E
¯
n
¯
n
†
=
Λ
Λ
Λ
M
(0, 0)R ··· Λ
Λ
Λ
M
(0, M − 1)R
.
.
.
.
.
.
Λ
Λ
Λ
M
(M − 1, 0)R ··· Λ
Λ
Λ
M
(M − 1, M − 1)R
= Λ
Λ
Λ
M
⊗ R,
(2)
where ⊗ denotes Kronecker product, and matrices Λ
Λ
Λ
M
and R
capture the temporal and spatial correlation of the interfer-
ence, respectively. The above model implies that the spatial
and temporal interference statistics are separable. The corre-
lation matrices Λ
Λ
Λ
M
and R are determined by the application-
specific signal model. In Section 5, we provide an example
in w h ich the interference covariance matrix has the above
Kronecker product form. When the interference statistics can
only be approximated by (2), the conditions where this a p-
proximation breaks down are investigated in Section 5.4.3.
In addition to interference correlation, we remark that a de-
coupled temporal and spatial correlation structure arises in
the statistics of fading vector channels consisting of a mobile
with one antenna and a base station with an antenna array
[18].
3. JOINT ESTIMATION OF CHANNEL AND SPATIAL
INTERFERENCE STATISTICS
During a tr aining period of N vector symbols, we concate-
nate the received signal vectors, the training signal vectors
and the interference vectors as
¯
y = [y
T
0
···y
T
N−1
]
T
,
¯
x =
[x
T
0
···x
T
N−1
]
T
,and
¯
n = [n
T
0
···n
T
N−1
]
T
,respectively.The
Channel Estimation and Data Detection for MIMO Systems 687
received signal in (1) is rewritten as the vector
¯
y =
I
N
⊗ H
¯
x +
¯
n,(3)
where
¯
n is circularly symmetric complex Gaussian with zero-
mean and covariance matrix Λ
Λ
Λ
N
⊗ R. Assuming prior knowl-
edge of temporal interference correlation matrix Λ
Λ
Λ
N
, we need
to estimate channel matrix H and spatial interference corre-
lation matrix R.IfR and Λ
Λ
Λ
N
are nonsingular, the conditional
probability density function (pdf) is
Pr(
¯
y|H, R) =
1
π
N·N
r
det
Λ
Λ
Λ
N
⊗ R
× exp
−
¯
y −
I
N
⊗ H
¯
x
†
×
Λ
Λ
Λ
N
⊗ R
−1
¯
y −
I
N
⊗ H
¯
x
.
(4)
3.1. ML solution
The ML estimate of the pair of matrices (H, R ) is the value
of (H, R) that maximizes the conditional pdf in (4), which is
equivalent to maximizing ln Pr(
¯
y|H, R).
Letting A and B denote m × m and n × n square matrices,
and using identities [19]
det(A ⊗ B) = det(A)
n
det(B)
m
,
(A ⊗ B)
−1
= A
−1
⊗ B
−1
,
(5)
where A, B are nonsingular, it can be shown that maximizing
(4) is equivalent to minimizing
f (H, R)
= ln det(R)
+
1
N
¯
y −
I
N
⊗ H
¯
x
†
×
Λ
Λ
Λ
−1
N
⊗ R
−1
¯
y −
I
N
⊗ H
¯
x
.
(6)
Denoting the elements of Λ
Λ
Λ
−1
N
as
Λ
Λ
Λ
−1
N
=
α
0,0
··· α
0,N−1
.
.
.
.
.
.
α
N−1,0
··· α
N−1,N−1
,(7)
we rewrite (6)as
f (H, R)
= ln det(R)
+
1
N
N−1
i=0
N−1
j=0
α
i, j
y
i
− Hx
i
†
R
−1
y
j
− Hx
j
= ln det(R)
+trace
R
−1
1
N
N−1
i=0
N−1
j=0
α
i, j
y
i
− Hx
i
y
j
− Hx
j
†
.
(8)
To find the value of (H, R) that minimizes f (H, R)in(8),
we set ∂f(H, R)/∂H = 0. Define the weighted sample corre-
lation matrices
1
as
˜
R
yy
=
1
N
N−1
i=0
N−1
j=0
α
i, j
y
i
y
†
j
,
˜
R
xy
=
1
N
N−1
i=0
N−1
j=0
α
i, j
x
i
y
†
j
,
˜
R
xx
=
1
N
N−1
i=0
N−1
j=0
α
i, j
x
i
x
†
j
.
(9)
Using the identities of matrix derivative [19], it can be shown
[20] that (8) is minimized by
ˆ
H =
˜
R
†
xy
˜
R
−1
xx
. (10)
Setting ∂f(
ˆ
H, R)/∂R = 0, it can also be shown that the esti-
mate of spatial interference correlation matrix is given by
ˆ
R =
1
N
N−1
i=0
N−1
j=0
α
i, j
y
i
−
ˆ
Hx
i
y
j
−
ˆ
Hx
j
†
(11)
=
˜
R
yy
−
ˆ
H
˜
R
xy
. (12)
We remark that if
˜
R
xy
and
˜
R
xx
in (10) were known cross- and
auto-correlation matrices, the estimate for H would repre-
sent the Wiener solution.
3.2. Special case: temporally white interference
If an interference is temporally white, with loss of generality,
we may substitute Λ
Λ
Λ
N
= I
N
into (9), (10), (11), and (12), and
obtain estimates
ˆ
H
w
= R
†
xy
R
−1
xx
, (13)
ˆ
R
w
= R
yy
−
ˆ
H
w
R
xy
, (14)
where the subscript w indicates temporally white interfer-
ence, and the sample correlation matrices are
R
yy
=
1
N
N−1
i=0
y
i
y
†
i
, (15)
R
xy
=
1
N
N−1
i=0
x
i
y
†
i
, (16)
R
xx
=
1
N
N−1
i=0
x
i
x
†
i
. (17)
Note that
ˆ
H
w
in (13) is the same as the channel estimate used
in [15].
1
To distinguish weighted sample correlation matrices from conventional
sample correlation matrices in Section 3.2, we denote the former by a tilde
and the latter without a tilde.
688 EURASIP Journal on Applied Signal Processing
3.3. Whitening filter interpretation
To obtain insight on the estimates in (10)and(12), we let the
received signal vectors during the training period undergo a
linear transformation where the transformed received signal
vectors are
y
0
···y
N−1
=
y
0
···y
N−1
Λ
Λ
Λ
−1/2
N
. (18)
At the output of the transformation, we have
y
i
= Hx
i
+ n
i
, i = 0, , N − 1, (19)
where the transformed training signal vectors and interfer-
ence vectors are
x
0
···x
N−1
=
x
0
···x
N−1
Λ
Λ
Λ
−1/2
N
,
n
0
···n
N−1
=
n
0
···n
N−1
Λ
Λ
Λ
−1/2
N
,
(20)
respectively. Concatenating the transformed interference
vectors as
¯
n
= [n
T
0
···n
T
N−1
]
T
, it can be shown that
¯
n
=
Λ
Λ
Λ
−1/2
N
⊗ I
N
r
¯
n, (21)
where
¯
n = [n
T
0
···n
T
N−1
]
T
. Since the covariance matrix of
¯
n
is Λ
Λ
Λ
N
⊗ R, the covariance matrix of
¯
n
is
cov
¯
n
=
Λ
Λ
Λ
−1/2
N
⊗ I
N
r
cov
¯
n
Λ
Λ
Λ
−1/2
N
⊗ I
N
r
†
=
Λ
Λ
Λ
−1/2
N
⊗ I
N
r
Λ
Λ
Λ
N
⊗ R
Λ
Λ
Λ
−1/2
N
⊗ I
N
r
= I
N
⊗ R,
(22)
where we used (A ⊗ B)
†
= A
†
⊗ B
†
and (A ⊗ B)(C ⊗ D) =
AC ⊗ BD [19]. We also used the fact that the temporal cor-
relation matrix Λ
Λ
Λ
N
is symmetric, as well as Λ
Λ
Λ
−1/2
N
.From
(22), it is obvious that the transformed interference vectors
{n
0
···n
N−1
} are temporally white with spatial correlation
matrix R.
As a result, we can estimate H and R from the sam-
ple correlation matrices of transformed signal vectors as in
Section 3.2. The sample correlation matr ix
R
y
y
=
1
N
N−1
i=0
y
i
y
†
i
=
1
N
y
0
···y
N−1
y
0
···y
N−1
†
=
1
N
y
0
···y
N−1
Λ
Λ
Λ
−1/2
N
Λ
Λ
Λ
−†/2
N
y
0
···y
N−1
†
=
1
N
y
0
···y
N−1
Λ
Λ
Λ
−1
N
y
0
···y
N−1
†
=
˜
R
yy
,
(23)
which shows that the weighted sample correlation matrix of
{y
0
···y
N−1
} is equivalent to the sample correlation matrix
of {y
0
···y
N−1
}. Similarly, the weighted sample correlation
matrices
˜
R
xy
and
˜
R
xx
are equivalent to the sample correla-
tion matr ices R
x
y
and R
x
x
, respectively. Therefore, the esti-
mates in (10)and(12) can also be realized by first temporally
whitening the interference, and then forming the estimates
from the sample correlation matrices of the transformed sig-
nal vectors.
4. DATA DETECTION
We focus on ordered MMSE detection due to the better per-
formance of MMSE compared to ZF detection [21]. For re-
ceived signal vector y
i
= Hx
i
+ n
i
, modifying the BLAST al-
gorithm in [16], the steps of ordered MMSE detection of x
i
from y
i
with estimated channel and interference s patial cor-
relation matrices are as follows:
Step 1. Initialization: set k = 1, H
k
=
ˆ
H,
˜
x
k
= x
i
,
˜
y
k
= y
i
.
Step 2. Calculate the estimation error covariance matrix P
k
=
(I
N
t
+1−k
+ H
†
k
ˆ
R
−1
H
k
)
−1
. Find m = arg min
j
P
k
( j, j),
where P
k
( j, j) denotes the jth diagonal element of P
k
.
Hence, the mth signal component of
˜
x
k
has the small-
est estimation error variance.
Step 3. Calculate the weighting matrix A
k
= (I
N
t
+1−k
+
H
†
k
ˆ
R
−1
H
k
)
−1
H
†
k
ˆ
R
−1
.Themth element of
˜
x
k
is esti-
mated by
ˆ
x
m
k
= Q(A
k
(m,:)
˜
y
k
), where A
k
(m,:) denotes
the mth row of matrix A
k
,andQ(·) denotes the slicing
operation appropriate to the signal constellation.
Step 4. Assuming that the detected signal is correct, remove
the detected signal from the received signal
˜
y
k+1
=
˜
y
k
−
ˆ
x
m
k
H
k
(:, m), where H
k
(:, m) denotes the mth column of
H
k
.
Step 5. H
k+1
is obtained by eliminating the mth column of
matrix H
k
and
˜
x
k+1
is obtained by e liminating the mth
component of vector
˜
x
k
.
Step 6. If k<N
t
, increment k andgotoStep2.
Werefertothisschemeasone-vector-symbol detection,aswe
detect x
i
using y
i
only.
When an interference is temporally colored, there may
exist a performance to be gained by taking the temporal
interference correlation into account. That is, we may use
y
N+1
, , y
M
to detect x
N+1
, , x
M
jointly where N is the
training length and M is the frame length. Due to the com-
plexity of using all the received signal vectors and for sim-
plicity of presentation, we consider a two-vector-symbol de-
tection in which (y
i
, y
i+1
)isusedtodetect(x
i
, x
i+1
) jointly.
The one-vector-symbol algorithm can be easily extended to
the two-vector-symbol version by writing
y
i
y
i+1
ˇ
y
i
=
H0
0H
ˇ
H
x
i
x
i+1
ˇ
x
i
+
n
i
n
i+1
ˇ
n
i
. (24)
With the estimated channel, an estimate of
ˇ
H,denotedas
ˆ
ˇ
H,
can be obtained. Using the estimated spatial interference cor-
relation and the known temporal interference correlation, we
are able to estimate the covariance matrix of
ˇ
n
i
,denotedas
ˆ
ˇ
R. Replacing x
i
, y
i
,
ˆ
H,and
ˆ
R in the one-vector-symbol al-
gorithm by
ˇ
x
i
,
ˇ
y
i
,
ˆ
ˇ
H,and
ˆ
ˇ
R, respectively, we obtain the two-
vector-symbol detection algorithm.
Channel Estimation and Data Detection for MIMO Systems 689
5. APPLICATIONS
In this section, we apply the channel estimation in Section 3
and data detection in Section 4 to the case of a sing le-user
link with one dominant cochannel interferer operating at dif-
ferent data rates.
5.1. System model
Consider a desired user with one dominant cochannel inter-
ferer. The assumption of one cochannel interferer can ap-
ply to cellular TDMA or FDMA systems when sectoring is
used. For example, in 7-cell reuse systems, with 60 degree
sectors, the number of cochannel interfering cells would be
reduced to one [22]. We assume that the desired and inter-
fering users have N
t
and L transmitting antennas, respec-
tively, and that there are N
r
receiving antennas. Assuming
that the thermal noise is small relative to the interference,
we ignore the thermal noise in the problem formulation. An
investigation of this assumption in channels with noise ap-
pears in Section 5.4.3. We also assume that over the duration
of a transmitted frame, a randomly delayed replica of the in-
terfering signal is transmitted continuously, and that the in-
terference statistics do not change. This assumption may not
hold for asynchronous packet transmission systems. In a slow
flat fading environment, the vector signal at the receiving an-
tennas is
y(t) =
P
s
T
N
t
H
M−1
k=0
x
k
˜
g(t − kT)
+
P
I
T
I
L
H
I
∞
k=−∞
b
k
˜
g
I
t − kT
I
− τ
,
(25)
where M is the frame length, and H (N
r
×N
t
)andH
I
(N
r
×L)
are the channel matrices of the desired and interfering users,
respectively. The channel matrices are also assumed fixed
over a frame and have independent realizations from frame
to frame. The data t ransmission rates of the desired and in-
terfering users are 1/T and 1/T
I
, respectively. The spectra of
transmit impulse responses
˜
g(t)and
˜
g
I
(t) are square root
raised cosines with parameters T and T
I
,respectively.The
same roll-off factor, β, is assumed for both
˜
g(t)and
˜
g
I
(t). The
data vectors of the desired and interfering users are x
k
(N
t
×1)
and b
k
(L × 1), respectively. We assume that the data sym-
bols in x
k
’s and b
k
’s are mutually independent, zero mean,
and with unit variance. We denote P
s
and P
I
as the transmit
powers of the desired and interfering users, respectively. The
delay of the interfering user relative to the desired user is τ,
assumed to lie in 0 ≤ τ<T
I
.
Passing y(t)in(25) through a filter matched to the trans-
mit impulse response of the desired user,
˜
g(t), the vector sig-
nal at the output of the matched filter is
y
MF
(t) =
P
s
T
N
t
H
M−1
k=0
x
k
g(t − kT)
+
P
I
T
I
L
H
I
∞
k=−∞
b
k
g
I
t − kT
I
− τ
,
(26)
where g(t) =
˜
g(t) ∗
˜
g(t), g
I
(t) =
˜
g
I
(t) ∗
˜
g(t), and ∗ denotes
convolution. As a result, g(t) has a raised cosine spec trum
and satisfies the Nyquist condition for zero intersymbol in-
terference.
Assuming perfect synchronization for the desired user, as
we sample the output of the matched filter (26)attimet =
jT,weobtain
y
j
=
P
s
T
N
t
Hx
j
+
P
I
T
I
L
H
I
∞
k=−∞
b
k
g
I
jT − kT
I
− τ
n
j
.
(27)
The interference vector n
j
is zero mean since the data vec-
tor of interferer b
k
is zero mean. Note that there is no inter-
symbol interference for the desired user. However, due to the
interferer’s delay and/or mismatch between the transmit and
receive impulse responses, intersymbol interference exists for
the interferer.
5.2. Interference statistics
The cross correlation between the interference vectors in (27)
at time jT and qT is
E
n
j
n
†
q
=
P
I
T
I
L
H
I
· E
∞
k
1
=−∞
b
k
1
g
I
jT − k
1
T
I
− τ
×
∞
k
2
=−∞
b
†
k
2
g
I
qT − k
2
T
I
− τ
H
†
I
=
P
I
T
I
L
H
I
H
†
I
·
∞
k=−∞
g
I
jT − kT
I
− τ
g
I
qT − kT
I
− τ
,
(28)
where the last equality is due to the facts that E
{b
k
1
b
†
k
2
}=0
for k
1
= k
2
and E{b
k
b
†
k
}=I
L
.
During a training period of N vector symbols, the co-
variance matrix of the concatenated interference vector
¯
n =
[n
T
0
···n
T
N−1
]
T
has the form of (2), where
Λ
Λ
Λ
N
( j, q) =
∞
k=−∞
g
I
jT − kT
I
− τ
g
I
qT − kT
I
− τ
,
0 ≤ j, q ≤ N − 1,
(29)
R =
P
I
T
I
L
H
I
H
†
I
. (30)
The N
r
×N
r
spatial correlation matrix R is determined by the
interferer’s channel matrix. The N × N temporal correlation
matrix Λ
Λ
Λ
N
depends on parameters T and T
I
,delayτ,and
pulse g
I
(t); it can be calculated a priori if these parameters
690 EURASIP Journal on Applied Signal Processing
are known. The temporal correlation is due to intersymbol
interference in the sampled interfering signal. We remark
that for the case of multiple interferers with the same delay,
the covariance matrix of interference also has the form of
(2).
We study temporal interference correlation in the cases
where (1) the interferer has the same data rate as that of the
desired signal (T = T
I
) and (2) the data rate of the desired
user is an integer multiple of that of the interferer (T
I
= mT,
m>1).
5.2.1. Interferer at the same data rate
as the desired signal
With T = T
I
, g
I
(t) has a raised cosine spectrum and is given
by [23]
g
I
(t) = sinc
πt
T
cos(πβt/T)
1 − 4β
2
t
2
/T
2
. (31)
We note that Λ
Λ
Λ
N
( j, q) depends on j − q. This indicates that
the sequence consisting of interference vectors is station-
ary. Hence, the temporal correlation matrix is a symmetric
Toeplitz. By appropriate truncation of the infinite series in
(29), we can numerically calculate the temporal correlation
matrix. For the case of β
= 1, T = 1, and τ = 0.5, the ele-
ments of the temporal correlation matrix are
Λ
Λ
Λ
N
( j, q) =
0.5 j = q,
0.25
| j − q|=1
0 otherwise.
for 0 ≤ j, q ≤ N − 1, (32)
5.2.2. Interferer at a lower data rate than
the desired signal
It can be shown that g
I
(t)isgivenby
g
I
(t) = F
−1
G
rc,T
I
( f )
G
rc,T
( f )
, (33)
where F
−1
denotes the inverse Fourier transform and
G
rc,T
( f ) is the raised cosine Fourier spectr um with param-
eter T and roll-off factor β. Unlike the case of the same data
rate interferer where Λ
Λ
Λ
N
( j, q) depends on j −q, in the case of
lower data rate interferer, Λ
Λ
Λ
N
( j, q) depends on the values of
j and q. This indicates that the sequence consisting of inter-
ference vectors is cyclostationary [23, 24]. With T
I
= mT,it
can be shown that Λ
Λ
Λ
N
( j, q) is periodic with period m, that is,
Λ
Λ
Λ
N
( j, q) = Λ
Λ
Λ
N
( j+m, q+m). As a result, the temporal correla-
tion matrix Λ
Λ
Λ
N
is symmetric, but not Toeplitz. Further m ore,
for N ≥ m, the number of nontrivial eigenvalues of Λ
Λ
Λ
N
is
N/m,where· rounds the argument to the nearest integer
towards infinity [25]. For the case of T
I
= 2T, T = 1, β = 1,
τ = 0.25, and training length N = 6, by numerical calcula-
tion of (29) with appropriate series truncation, the temporal
correlation matrix is
Λ
Λ
Λ
6
=
0.648 0.400 −0.048 −0.006 −0.010 −0.001
0.400 0.277 0.105 0.084 0.002 0.011
−0.048 0.105 0.648 0.400 −0.048 −0.006
−0.006 0.084 0.400 0.277 0.105 0.084
−0.010 0.002 −0.048 0.105 0.648 0.400
−0.001 0.011 −0.006 0.084 0.400 0.277
.
(34)
Note that Λ
Λ
Λ
6
in (34) is singular as the number of nontrivial
eigenvaluesis3.
5.3. Data detection without estimating channel
and interference
During a training period of N symbol vectors, instead of es-
timating the channel matrix and interference statistics, one
can alternatively employ a least squares (LS) estimate of ma-
trix M which minimizes the average estimation error
f
2
(M) = trace
1
N
N−1
i=0
x
i
− My
i
x
i
− My
i
†
. (35)
By setting ∂f
2
(M)/∂M = 0,weobtain
M = R
xy
R
−1
yy
, (36)
where the sample correlation mat rices R
xy
and R
yy
are de-
fined in (16)and(15), respectively. The transmitted signal
vector x
i
is detected as Q(My
i
), where Q(·) is the slicing op-
eration appropriate to the signal constellation. We remark
that (36) is the well-known DMI algorithm [17], generalized
for multiple input sig nals. A significant loss in performance
is expected for this LS detector, since without estimates of
channel and spatial interference correlation matrices, itera-
tive MMSE detection cannot be perfor med.
5.4. Simulation results
Monte Carlo simulations are used to assess the benefits of
taking temporal and spatial interference correlation into ac-
count, for channel estimation and data detection in the case
of one interferer. Although temporal interference correlation
may be difficult to estimate in practice, we examine this as a
benchmark and determine the performance loss due to ig-
noring this correlation. We evaluate average symbol error
rates (SERs) in independent Rayleigh fading channels of rich
scattering, that is, the elements in channel matrices H and
H
I
are independent, identically distributed (i.i.d.) zero-mean
complex Gaussian with unit variance. We assume that the de-
sired user has 5 transmitting and 5 receiving antennas, and
the interfering user has 6 transmitting antennas.
2
Both the
desired and interfering users employ uncoded quadrature
phase shift keying (QPSK) modulation. The training signal
vectors are columns of a fast Fourier transform (FFT) matrix
2
For a nonsingular spatial interference correlation matrix, we set N
r
≤ L.
Channel Estimation and Data Detection for MIMO Systems 691
[16] to guarantee orthogonal training sequences from differ-
ent tra nsmitting antennas. We define SIR(dB) = 10 log P
s
/P
I
.
Without loss of generality, we set P
I
= 1 in the simulation.
The SERs of two cases are simulated: (1) interferer at the
same data rate as the desired signal and (2) the data rate of
the desired user is twice that of the interferer.
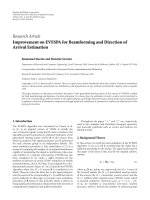
In Figures 1, 2, 3,and4, with solid and dashed lines repre-
senting one- and two-vector-symbol data detection, respec-
tively, we plot average SERs for the following cases:
(a) perfectly known channel parameters and interference
statistics, with one-vector-symbol (curve 1) and two-
vector-symbol (curve 2) detection;
(b) channel and spatial interference correlation matrices
are estimated assuming known temporal interference
correlation, with one-vector-symbol (curve 3) and
two-vector-symbol (curve 4) detection;
(c) channel and spatial interference correlation matrices
are estimated assuming temporally white interference,
with one-vector-symbol detection (curve 5);
(d) only the channel matrix H is estimated assuming tem-
porally white interference; an identity spatial interfer-
ence correlation matrix is used in one-vector-symbol
data detection (curve 6);
(e) LS estimate of the transmitted signal vector without
ordered detection (Section 5.3) (curve 7).
We remark that cases (a) and (b) are benchmarks presented
for reference, while case (d) corresponds to the well-known
BLAST system in [4, 16].
5.4.1. Interferer at the same data rate
as the desired signal
We examine the case of T = 1, β = 1, and τ = 1/2, and the
nonsingular temporal interference correlation matrix shown
in (32). Figures 1 and 2 show the average SERs for training
lengths 2N
t
and 4N
t
, respectively. Comparing the LS detec-
tion (curve 7) with other methods, much lower SERs can be
achieved by using ordered MMSE detection as expected.
Comparing curves 5 and 6, we observe that for a training
length of 4N
t
symbols, gains can be obtained by estimating
spatial interference correlation. However, shorter training
lengths such as 2N
t
produce inaccurate estimates of spatial
interference correlation which in turn do not yield any ben-
efit over assuming spatially white interference. As expected,
we observe that the improvement by taking into account
estimated spatial correlation increases with longer training
lengths.
Examining curves 3 and 5 in Figure 2, we observe that
the improvement in taking temporal interference correla-
tion into account in channel estimation is not significant.
Moreover, this rate of improvement rapidly diminishes as
the training length increases. This can be explained by not-
ing that in estimating channel and spatial interference corre-
lation matrices for temporally colored interference, the re-
ceived signal vectors first undergo a transformation which
temporally whitens the interference vectors as discussed in
Section 3.3. Since the temporal correlation in (32)drops
quickly to zero after one time lag, the benefit in temporal
whitening of interference vectors is not significant, especially
for long training lengths.
By comparing curves 3 and 4 in Figure 2, there is a slight
improvement in using two-vector-symbol over one-vector-
symbol detection. This implies that not much gain can be
achieved by taking temporal interference correlation into ac-
count in data detection, owing to the low temporal corre-
lation. Due to better estimates of channel and interference
spatial correlation matrices obtained with a longer training
length, the performance gap between curves 3 and 4 should
increase as the training length increases.
By comparing curves 4 and 6 in Figure 2,weobservea
1.5 dB gain in SIR obtained by estimating spatial interference
correlation and taking explicit advantage of known tempo-
ral interference correlation in channel estimation and data
detection using a training length of 4N
t
.About1dBofthat
gain is due to the estimation of spatial interference correla-
tion, and the remaining 0.5 dB gain is due to exploiting tem-
poral interference correlation in channel estimation and data
detection.
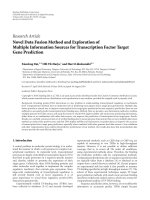
5.4.2. Interferer at a lower data rate
than the desired signal
We examine the case of T
I
= 2T, T = 1, β = 1, τ = 0.25
and the temporal interference correlation matrix for training
length N = 6 shown in (34). Recall that the temporal corre-
lation matrix for the lower-data-rate-interferer case is singu-
lar. To avoid the singularity, the diagonal elements of Λ
Λ
Λ
N
are
increased by a small amount; hence, the temporal correla-
tion matrix used for channel estimation may be modified to
Λ
Λ
Λ
N
+δI
N
within the proposed framework. In our simulation,
we chose δ = 0.01.
The same set of average SER curves as in the same-data-
rate-interferer case are simulated. Figures 3 to 4 show the
SERs for different training lengths. As in the case of the same-
data-rate interferer, curve 7 illustrates the poor performance
without ordered detection. Curves 5 and 6 suggest that for
short training lengths it is better to estimate only the channel
matrix and assume spatially white interference in data detec-
tion; however, for moderately long training lengths, gains can
be obtained by estimating spatial interference correlation.
By examining curves 3 and 5 in Figure 4, we observe that
the improvement in taking temporal interference correlation
into account in channel est imation, although larger than that
in the same-data-rate-interferer case due to the high tempo-
ral correlation in the lower-data-rate-interferer case, is still
not that significant.
In contrast to the same-data-rate-interferer case, curves 3
and 4 in Figure 4 show that the improvement of two-vector-
symbol over one-vector-symbol detection is significant due
to the higher temporal interference correlation. This implies
that a significant gain can be achieved by taking the know n
temporal interference correlation into account in data detec-
tion for the lower-data-rate-interferer case.
By comparing curves 4 and 6 in Figure 4, for the training
length 4N
t
, there is a total of 4 dB gain in SIR by estimating
spatial interference correlation and taking advantage of the
692 EURASIP Journal on Applied Signal Processing
Average SER
1614121086420
10
−5
10
−4
10
−3
10
−2
10
−1
10
0
SIR (dB)
Perfectly known H&R, one-vector-symbol (1)
Perfectly known H&R, two-vector-symbol (2)
Est. H&R, spatial & tempo. color. interf., one-vector-symbol (3)
Est. H&R, spatial & tempo. color. interf., two-vector-symbol (4)
Est. H&R, spatial color. & tempo. white interf. (5)
Est. H, spatial & tempo. white interf. (6)
LS data detection (7)
Figure 1: Average SER versus SIR with N
t
= N
r
= 5, L = 6, and
training length 2N
t
under independent Rayleigh fading. Both the
desired and the interfering users are at the same data rate.
Average SER
1614121086420
10
−5
10
−4
10
−3
10
−2
10
−1
10
0
SIR (dB)
Perfectly known H&R, one-vector-symbol (1)
Perfectly known H&R, two-vector-symbol (2)
Est. H&R, spatial & tempo. color. interf., one-vector-symbol (3)
Est. H&R, spatial & tempo. color. interf., two-vector-symbol (4)
Est. H&R, spatial color. & tempo. white interf. (5)
Est. H, spatial & tempo. white interf. (6)
LS data detection (7)
Figure 2: Average SER versus SIR with N
t
= N
r
= 5, L = 6, and
training length 4N
t
under independent Rayleigh fading. Both the
desired and the interfering users are at the same data rate.
Average SER
1614121086420
10
−4
10
−3
10
−2
10
−1
10
0
SIR (dB)
Perfectly known H&R, one-vector-symbol (1)
Perfectly known H&R, two-vector-symbol (2)
Est. H&R, spatial & tempo. color. interf., one-vector-symbol (3)
Est. H&R, spatial & tempo. color. interf., two-vector-symbol (4)
Est. H&R, spatial color. & tempo. white interf. (5)
Est. H, spatial & tempo. white interf. (6)
LS data detection (7)
Figure 3: Average SER versus SIR with N
t
= N
r
= 5, L = 6, and
training length 2N
t
under independent Rayleigh fading. The data
rate of the desired user is twice that of the interfering user.
Average SER
1614121086420
10
−4
10
−3
10
−2
10
−1
10
0
SIR (dB)
Perfectly known H&R, one-vector-symbol (1)
Perfectly known H&R, two-vector-symbol (2)
Est. H&R, spatial & tempo. color. interf., one-vector-symbol (3)
Est. H&R, spatial & tempo. color. interf., two-vector-symbol (4)
Est. H&R, spatial color. & tempo. white interf. (5)
Est. H, spatial & tempo. white interf. (6)
LS data detection (7)
Figure 4: Average SER versus SIR with N
t
= N
r
= 5, L = 6, and
training length 4N
t
under independent Rayleigh fading. The data
rate of the desired user is twice that of the interfering user.
Channel Estimation and Data Detection for MIMO Systems 693
Average SER
2018161412108
10
−2
10
−1
10
0
INR (dB)
Est. H&R, spatial & tempo. color. interf., one-vector-symbol (3)
Est. H&R, spatial & tempo. color. interf., two-vector-symbol (4)
Est. H&R, spatial color. & tempo. white interf. (5)
Figure 5: Average SER versus INR with N
t
= N
r
= 5, L = 6,
SIR=10 dB, and training length 4N
t
under independent Rayleigh
fading. Both the desired and the interfering users are at the same
data rate.
known temporal interference correlation in channel estima-
tion and data detection. About 3.5 dB of the gain is due to
exploiting temporal interference correlation in channel esti-
mation and data detection.
5.4.3. Effect of model mismatch
With one interferer and a finite SNR, the interference-plus-
noise statistics can only be approximately modelled using a
Kronecker product. Here, we investigate when this approx-
imation breaks down. We model thermal noise as a zero-
mean circularly symmetric complex Gaussian vector with
covariance matrix σ
2
I
N
r
, that is, independent from antenna
to antenna, with noise power σ
2
on each antenna. We de-
fine (interference-to-noise power ratio) INR = 10 log P
I
/σ
2
,
where P
I
= 1 is used in the simulations. For the case of an in-
terferer at the same data rate and using a training length 4N
t
,
we observe in curves 3 and 5 in Figure 5 that, at INRs below
17 dB, taking interference temporal correlation into account
appears not to be of benefit. Figure 6 shows the correspond-
ing comparison for the case of the lower-data-rate interferer.
In this case, temporal correlation is larger and the decou-
pled model of interference-plus-noise statistics breaks down
at INRs lower than 12 dB.
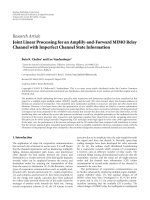
5.4.4. Effect of exploiting spatial
interference-plus-noise correlation
From the above results, temporal interference correlation,
even if known, may not result in a performance benefit at
lower INRs due to model mismatch. Therefore, we assess the
benefit of taking only the spatial correlation of interference-
plus-noise into account. As a reference, we compare the per-
Average SER
2018161412108
10
−2
10
−1
10
0
INR (dB)
Est. H&R, spatial & tempo. color. interf., one-vector-symbol (3)
Est. H&R, spatial & tempo. color. interf., two-vector-symbol (4)
Est. H&R, spatial color. & tempo. white interf. (5)
Figure 6: Average SER versus INR with N
t
= N
r
= 5, L = 6,
SIR=10 dB, and training length 4N
t
under independent Rayleigh
fading. The data rate of the desired user is twice that of the inter-
fering user.
formance to the case of assuming the interference-plus-noise
to be spatially white. With total interference power fixed,
Figure 7 compares the average SER for one (solid lines) and
two (dashed lines) interferers. In the case of two interferers,
the interferers have equal power and random relative delays.
Both desired and interfering users employ a (5, 5) MIMO
link, a total-interference-to-noise ratio of 12 dB, and a train-
ing length of 4N
t
. Both the desired and the interfering users
operate at the same data rate. Figure 7 shows that for one
interferer, there is 1.2 dB gain over a wide range of signal-to-
interference-plus-noise ratio (SINRs), by estimating the spa-
tial correlation of interference-plus-noise. For the case of two
equal-powered interferers, the corresponding gain in SINR is
negligible.
6. CONCLUSIONS
By modelling interference statistics as approximately tempo-
rally and spatially separable, we have investigated ML joint
estimation of channel parameters and spatial interference
correlation matrices. We have assessed the impact of tem-
poral and spatial interference correlation on channel estima-
tion and data detection. For training lengths of at least four
times the number of transmitting antennas, ga ins of around
1 dB are observed by estimating spatial interference correla-
tion. We determine that an additional 0.5 to 3.0 dB in perfor-
mance gain would result if the known temporal correlation
was exploited. For shorter training lengths, however, it is bet-
ter to estimate only the channel matrix and assume spatially
white interference in data detection. One source of tempo-
ral correlation occurs where a cochannel interferer operates
694 EURASIP Journal on Applied Signal Processing
Average SER
1614121086420
10
−3
10
−2
10
−1
10
0
SINR (dB)
One interferer, estimated channel and correlation of I + N
One interferer, estimated channel and assumed white I + N
Two interferers, estimated channel and correlation of I + N
Two interferers, estimated channel and assumed white I + N
Figure 7: The improvement of estimating spatial correlation of
interference-plus-noise in practical systems.
at data rate lower than that of the desired user. Exploiting
temporal interference correlation in channel estimation was
found not to be of benefit. H owever, if temporal correlation is
significant, as in case of lower-data-rate interference, signif-
icant performance gains by exploiting temporal interference
correlation in data detection are theoretically possible. The
minimum INR levels, where separable temporal and inter-
ference correlation statistics model was shown to break down
and provide no benefit, ranged from 12 or 17 dB, depending
on the level of temporal correlation. Of more practical sig-
nificance, it was shown that at a total INR of 12 dB, 1.2 dB
of performance gain can be obtained over a wide range of
SINRs by estimating spatial correlation only and neglecting
temporal correlation.
ACKNOWLEDGMENT
The material in this paper was presented in part at IEEE VTC,
Fall 2002.
REFERENCES
[1] G. J. Foschini and M. J. Gans, “On limits of wireless commu-
nications in a fading environment when using multiple an-
tennas,” Wireless Personal Communications,vol.6,no.3,pp.
311–335, 1998.
[2] I. E. Telatar, “Capacity of multi-antenna Gaussian channels,”
European Transactions on Telecommunications, vol. 10, no. 6,
pp. 585–595, 1999.
[3] G. J. Foschini, “Layered space-time architecture for wireless
communication in a fading environment when using multiple
antennas,” B ell Labs Technical Journal, vol. 1, no. 2, pp. 41–59,
1996.
[4] G. D. Golden, G. J. Foschini, R. A. Valenzuela, and P. W. Wol-
niansky, “Detection algorithm and initial laboratory results
using the V-BLAST space-time communication architecture,”
Electronics Letters, vol. 35, no. 1, pp. 14–16, 1999.
[5] V. Tarokh, N. Seshadri, and A. R. Calderbank, “Space-time
codes for high data rate wireless communication: Perfor-
mance criterion and code construction,” IEEE Transactions
on Information Theory, vol. 44, no. 2, pp. 744–765, 1998.
[6] V. Tarokh, H. Jafarkhani, and A . R. Calderbank, “Space-time
block codes from orthogonal designs,” IEEE Transactions on
Information Theory, vol. 45, no. 5, pp. 1456–1467, 1999.
[7] F. R. Farrokhi, G. J. Foschini, A. Lozano, and R. A. Valenzuela,
“Link-optimal space-time processing with multiple transmit
and receive antennas,” IEEE Communications Letters, vol. 5,
no. 3, pp. 85–87, 2001.
[8] S. Catreux, P. F. Driessen, and L. J. Greenstein, “Simulation
results for an interference-limited multiple-input multiple-
output cellular system,” IEEE Communications Letters, vol. 4,
no. 11, pp. 334–336, 2000.
[9]S.Catreux,P.F.Driessen,andL.J.Greenstein, “Attain-
able throughput of an interference-limited multiple-input
multiple-output (MIMO) cellular system,” IEEE Trans. Com-
munications, vol. 49, no. 8, pp. 1307–1311, 2001.
[10] Y. Song and S. D. Blostein, “MIMO channel capacity in co-
channel interference,” in Proc. 21st Biennial Symposium on
Communications, pp. 220–224, Kingston, Ontario, Canada,
June 2002.
[11] A. Lozano and A. M. Tulino, “Capacity of multiple-transmit
multiple-receive antenna architectures,” IEEE Transactions on
Information Theory, vol. 48, no. 12, pp. 3117–3128, 2002.
[12] R. S. Blum, “MIMO capacity with interference,” IEEE Journal
on Selected Areas in Communications, vol. 21, no. 5, pp. 793–
801, 2003.
[13] M. Kang and M. S. Alouini, “Performance analysis of MIMO
systems with co-channel interference over Rayleigh fading
channels,” in Proc. IEEE International Conference on Commu-
nications (ICC ’02), pp. 391–395, New York, NY, USA, April–
May 2002.
[14] B. Suard, A. F. Naguib, G. Xu, and A. Paulraj, “Performance
of CDMA mobile communication systems using antenna ar-
rays,” in Proc. IEEE Int. Conf. Acoustics, Speech, Signal Pro-
cessing (ICASSP ’93), pp. 153–156, Minneapolis, Minn, USA,
April 1993.
[15] T. Marzetta, “BLAST training: estimating channel charac-
teristics for high-capacity space-time wireless,” in Proc. 37th
Annual Allerton Conference on Communication, Control, and
Computing, pp. 958–966, Monticello, Ill, USA, September
1999.
[16] B. Hassibi, “A fast square-root implementation for BLAST,” in
Proc. 34th Asilomar Conference on Signal, Systems, and Com-
puters, pp. 1255–1259, Pacific Grove, Calif, USA, October
2000.
[17] J. H. Winters, “Signal acquisition and tracking with adap-
tive arrays in the digital mobile radio system IS-54 with flat
fading,” IEEE Trans. Vehicular Technology,vol.42,no.4,pp.
377–384, 1993.
[18] A. F. Naguib and A. Paulraj, “Performance of wireless CDMA
with M-ary orthogonal modulation and cell site antenna ar-
rays,” IEEE Journal on Selected Areas in Communications, vol.
14, no. 9, pp. 1770–1783, 1996.
[19] H. L
¨
utkepohl, Handbook of Matrices,JohnWiley&Sons,
Chichester, 1996.
[20] Y. Song, Multiple-input multiple-output wireless communica-
tion systems with cochannel inte rference, Ph.D. thesis, Depart-
ment of Electrical and Computer Engineering, Queen’s Uni-
versity, Kingston, Ontario, Canada, 2003.
Channel Estimation and Data Detection for MIMO Systems 695
[21] S. B
¨
aro, G. Bauch, A. Pavlic, and A. Semmler, “Improving
BLAST performance using space-time block codes and turbo
decoding,” in Proc. Global Telecommunications Conference,pp.
1067–1071, San Francisco, Calif, USA, November–December
2000.
[22] T. S. Rappaport, Wireless Communications: Principles and
Practice, Prentice-Hall, Upper Saddle River, NJ, USA, 1996.
[23] J. G. Proakis, Digital Communications, McGraw-Hill, New
York, NY, USA, 1995.
[24] W. A. Gardner, Introduction to Random Processes, McGraw-
Hill, New York, NY, USA, 1990.
[25] G. Long, F. Ling, and J. G. Proakis, “Fractionally-spaced
equalizers based on singular value decomposition,” in
Proc.IEEEInt.Conf.Acoustics,Speech,SignalProcessing,pp.
1514–1517, New York, NY, USA, April 1988.
Yi Song received her B.S. degree in electrical
engineering from Shanghai Jiao Tong Uni-
versity, Shanghai, China, in 1995 and her
M.S. and Ph.D. degrees in electrical engi-
neering from Queen’s University, Kingston,
Ontario, Canada, in 1998 and 2003, respec-
tively. Her research interests include wire-
less communications and signal processing
for multiple antenna systems.
Steven D. Blostein received his B.S. de-
gree in elect rical engineering from Cor-
nell University in 1983, and his M.S. and
Ph.D. degrees in electrical and computer
engineering from the University of Illinois
at Urbana-Champaign in 1985 and 1988,
respectively. He has been on the faculty
board of Queen’s University in Kingston,
Ontario, Canada since 1988, where he cur-
rently holds the position of Professor and
Head of the Department of Electrical and Computer Engineering.
His current interests lie in signal processing for wireless communi-
cations as well as detection and estimation theory. He is a Senior
Member of the IEEE and a Registered Professional Engineer in On-
tario.