Báo cáo hóa học: " A Novel Pseudoerror Monitor" ppt
Bạn đang xem bản rút gọn của tài liệu. Xem và tải ngay bản đầy đủ của tài liệu tại đây (587.09 KB, 6 trang )
EURASIP Journal on Applied Signal Processing 2004:3, 412–417
c
2004 Hindawi Publishing Corporation
A Novel Pseudoerror Monitor
Peng Wang
Center for Signal Processing, School of Electrical & Electronic Engineering, Nanyang Technological University, Singapore 639798
Email:
Wee Ser
Center for Signal Processing, School of Electrical & Electronic Engineering, Nanyang Technological University, Singapore 639798
Email:
Received 10 April 2003; Revised 14 September 2003; Recommended for Publication by Tomohiko Taniguchi
The error rate (ER) is a crucial criterion in evaluating the performance of a digital communication system. Many ER estimation
methods have been described in the literature. Among them, the pseudoerror monitoring solution has attracted special attention
due to its consistent performance in different environments and distinctive blind estimation capability, that is, estimating the ER
without needing any prior knowledge of the transmitted information. In this paper, a novel pseudoerror monitor (PEM) design,
the kernel PEM, is developed. Incorporating the strength of the probability density function (pdf) approximation technique, the
proposed design has remarkable advantage of being able to produce statistically consistent ER estimate within a much shor ter
observation time. Simulation results a re given in support of this claim.
Keywords and phrases: error rate estimation, pseudoerror monitor, density function approximation.
1. INTRODUCTION
One of the primary goa ls of a digital communication system
is to provide users with reliable data transmission service. Be-
ing the most straightforw ard measure of the reliability of data
transmission, not surprisingly, the error rate (ER) has been
widely recognized as a crucial criterion in evaluating the per-
formance of a digital communication system. Many ER es-
timation methods have been described in the literature, for
example, the error counting solution [1], the parameter esti-
mation solution [1, 2, 3, 4, 5], the probability density func-
tion (pdf) approximation-based solution [6, 7, 8], the pseu-
doerror monitoring solution [1, 9, 10, 11, 12, 13, 14, 15], and
so for th. Among them, the pseudoerror monitoring scheme
has attracted special attention due to its distinctive blind esti-
mation capability and consistent performance in various en-
vironments. The conventional pseudoerror monitor (PEM)
designs, however, require a relatively long observation time
to produce statistically reliable estimates at low ERs. In this
study, a novel PEM design, termed kernel PEM, has been de-
veloped. By exploiting the pdf approximation technique, the
proposed design successfully reduces the observation time
without degrading the overall quality of the ER estimate.
This paper is org anized as follows. In Section 2, the prin-
ciple of the pseudoerror monitoring approach is introduced.
In Section 3, the kernel density-approximation technique is
reviewed. Section 4 describes the kernel PEM design, sum-
marizes its advantages, and proposes an iterative method to
attain the optimum estimation. Simulation results are given
in Section 5 to demonstrate the superiority of the proposed
design over its conventional counterparts. Section 6 con-
cludes this paper.
2. PSEUDOERROR MONITORING
In pseudoerror monitoring, the observed events that are rel-
atively more likely to be erroneous are treated. These events
are not necessarily the real transmission errors. The most di-
rect benefit of this strategy is to relieve the error counting
monitor from the high dependence on the prior knowledge
of the transmitted information. Furthermore, the observa-
tion time needed for generating statistically consistent ER es-
timate can be reduced significantly too.
In conventional pseudoerror monitoring, several sec-
ondary transmission channels are constructed, and con-
trolled amounts of signal degradations are introduced (or
the error criteria are released), to make the error events oc-
cur more frequently. Such errors are often referred to as
pseudo errors. As a consequence, the ER is amplified and a
sufficiently large number of pseudo errors can be recorded
within a much shorter observation time. The estimates of the
pseudoerror rates (PERs), resulted from counting the num-
bers of pseudo errors, are then extrapolated to estimate the
ER.
A Novel Pseudoerror Monitor 413
The accuracy of the ER estimate calculated as above is
dependent on the extrapolation method used. A simple and
generally acceptable extrapolation can be performed by treat-
ing the logarithmic ER as a linear function of a suitably de-
fined degradation parameter, such as the signal degr adation
factor [9]. For secondary channels with signal degradation
factors of d
1
and d
2
, we can extrapolate the PER estimates
P
d1
and
P
d2
, respectively, to have the desired ER estimate
P
0
as follows:
log
P
0
=
d
1
log
P
d2
− d
2
log
P
d1
d
1
− d
2
. (1)
Many PEM designs have been described in the literature.
These schemes face the same challenge when they are applied
to fast-varying channels, that is, the long observation time.
This problem can be relieved by adding in more signal degra-
dations or further relaxing the error criteria. However, since
the discrepancy between the extrapolation and the actual er-
ror pattern can be too big sometimes, this solution may suffer
a serious drop in the estimation accuracy. In some cases, the
resultant ER estimate may be too biased to be useful to serve
as a performance indicator.
3. KERNEL DENSITY FUNCTION APPROXIMATION
The subject of density function approximation has long been
a hot research topic in statistics and it has been studied ex-
tensively in the literature (see [16, 17] and the references
therein). Among the existing solutions, the kernel approxi-
mation method is the most widely studied and perhaps the
most successful method in practice. A kernel pdf estimator
can be constructed as follows:
f (x) =
1
nh
n
i=1
K
x − X
i
h
,(2)
where x is the random variable of interest, X
i
is the ith sample
of x, n is the number of the samples used for the approxima-
tion, h is a positive smoothing parameter,
f is the approx-
imate of the actual pdf f ,andK is a kernel function that
satisfies
+∞
−∞
K(x)dx = 1. (3)
Function K is usually, but not always, selected to b e a
density function, such as the standard Gaussian function. It
follows from (2) that the density approximate
f is also a den-
sity function. The value of h determines the amount of details
of the samples that will be masked in the approximation pro-
cess. If h is set too small, the spurious fine structure will be-
come visible, and if h is set too large, some important features
of the distribution will be obscured. The optimum value of
h is affected by many factors, for example, the choice of the
kernel, the actual density, the criterion used to evaluate the
pdf approximate, and so forth. If the concerned statistics is
a Gaussian distribution with a variance of σ
2
, the optimum
smoothing parameter for the standard Gaussian kernel can
be found to be [16]
h
o
= 1.06σn
−1/5
,(4)
where h
o
is optimum in the sense of minimizing the mean
integrated square error (MISE), that is,
MISE
f
= E
f (x) − f (x)
2
dx
. (5)
Obviously, the MISE criterion measures the global accuracy
of the resultant pdf approximate.
4. KERNEL PSEUDOERROR MONITORING
4.1. Principle
The pdf approximation technique can be readily applied in
ER estimation as follows:
P
0
=
m
P
sm
·
ER
m
f
m
x
m
dx
m
,(6)
where P
sm
is the probability that the mth (m = 0, 1, , M −
1) symbol is transmitted, x
m
is the corresponding decision
statistics,
f
m
is the pdf approximate of x
m
,and
ER
m
denotes
the error region of x
m
. Assume that all the M symbols are
equiprobable, that is, P
sm
= 1/M, and they suffer the same
degree of corruption during the transmission, that is, f
m
can
only be identified by its mean value. The ER estimator in (6)
can be accordingly simplified to
P
0
=
ER
f (x)dx,(7)
where x is an arbitrary decision statistics. The ER can now
be estimated in two successive steps: approximate the pdf of
a decision statistics, and then calculate its integration over
the relevant error region. Rather than using some specific
types of events as the error counting method and the con-
ventional pseudoerror monitoring method do, the density
approximation-based scheme exploits the information car-
ried by all the observations. Consequently, it cuts down the
cost on the observation time significantly.
Although it seems possible to estimate the ER directly by
integrating the pdf approximate obtained over the real-error
region, this solution, termed kernel real-error monitoring, is
not feasible in practice. The ER estimate obtained in this way
is very sensitive to the authenticity of the error decisions.
It follows that in order to produce a good ER estimate, the
transmitted information must be know n a priori. That con-
dition is hardly possible in practice.
The conventional pseudoerror monitoring solution de-
scribed previously works successfully in blind ER estimation,
but fails to provide sufficient reduction in the observation
time. The kernel real-error monitoring solution, on the other
side, may reduce the observation time, but it is incapable of
giving satisfactory performance in blind state. The idea of the
414 EURASIP Journal on Applied Signal Processing
Decision statistics
Kernel pdf
estimator
Pseudoerror rate
estimator 1
Pseudoerror rate
estimator 2
Linear extrapolator
ER estimate
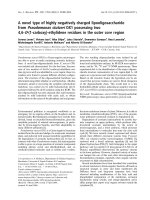
Figure 1: Typical structure of kernel PEM.
proposed kernel pseudoerror monitoring solution is to com-
bine the strengths of the two methods to generate a fast and
reliable blind ER estimation. In this scheme, the pdf approx-
imate is used to calculate a number of PER estimates, and
these values are then extrapolated in the same way as in the
conventional pseudoerror monitoring method to give the de-
sired estimate. Figure 1 shows the typical structure of a ker-
nel PEM that uses the threshold modification technique to
generate the pseudo errors. In this case, the PER estimates
are obtained by integrating the unique pdf approximate over
a set of predefined pseudoerror regions. By substituting (2)
and the expression of the standard Gaussian kernel into (7),
we can express PER estimate
P
rk
as follows:
P
rk
=
1
n
n
i=1
Q
r
k
− X
i
h
, k = 1, 2, (8)
where {r
k
, k = 1, 2} are the modified thresholds. As is
shown in the above equation, the PER estimates can be cal-
culated directly from the samples. Therefore it is not nec-
essary to derive the explicit expression of the pdf approxi-
mate. Note that modifying the threshold is in effect equiv-
alent to adding in some amount of signal degradation. For
a binary phase shift keying (BPSK) system that is solely cor-
rupted by additive white Gaussian noise (AWGN), the equiv-
alent degradation factor d
rk
corresponding to the modified
threshold r
k
is
d
rk
= 1 −
µ − r
k
µ − r
0
2
,(9)
where µ is the mean value of the decision statistics and r
0
is
the orig inal threshold. It follows from (1) that
log
P
0
=
d
r1
log
P
r2
− d
r2
log
P
r1
d
r1
− d
r2
. (10)
If the signal deg radation technique is applied to generate
the pseudo errors, the resultant kernel PEM takes the form
of (1). The PER estimates are now the results of integrating a
series of pdf approximates, corresponding to different signal
degradation factors, over an identical error region. Clearly,
this scheme incurs a higher implementation cost. In the rest
of the paper, the former monitor structure is further investi-
gated.
4.2. Comparison with conventional schemes
The error counting estimation maps the ER domain [0, 1] to
a set of discrete values {k/n, k = 0, 1, , n},wherek is the
number of the recorded errors. Apparently, in this solution,
the sample size n must be far greater than the reciprocal of
the ER, so as to avoid trivial results of zero. In [10, 18], it
has been suggested that more than ten error events should
be recorded within each run of estimation, which places very
high demands on the observation time at low ERs. The con-
ventional PEM designs exploit the error counting method in
estimating the PERs, and accordingly, inherit its disadvan-
tage as well. Although the exploitation of the ER extrapola-
tion technique provides a certain degree of ER amplification
and relaxes the requirement for long observation, it is inade-
quate for extremely low ERs. Consider a BPSK system that
is solely corrupted by AWGN and assume that the sig nal-
to-noise ratio (SNR) per bit is 12 dB (corresponding to ER
9.0 × 10
−9
). The modified threshold is taken to b e 0.1(corre-
sponding to an ER amplification factor of 22.4). It can be
easily verified that the observation time should be greater
than 5.0 × 10
7
sampling intervals. Even if a wider pseudo-
errorregionisusedtohaveanERamplificationfactoras
large as 1000, the scheme will still need about 1.1 × 10
6
sam-
ples to produce acceptable results. The kernel ER estima-
tion method, on the other side, maps the ER domain to a
continuous subset [P
h
,1− P
h
], where P
h
is the ER estimate
for clean signal, and, as can be seen from (8), it is equal to
Q(
|µ|h
−1
). Theoretically, the kernel estimation method may
provide nontrivial estimate for arbitrarily low ERs. In this
sense, it is not constrained by the requirement to have a cer-
tain smallest number of samples. This attractive feature is
inherited by the kernel PEM design and makes it distinc-
tively more competitive than the conventional methods in
fast-varying channels.
In addition, by mapping the infinite ER domain to a finite
number of values, the error counting solution and thus the
conventional PEM schemes unavoidably incur the ER ambi-
guity, that is, the inability to discriminate closely-spaced ERs.
The minimum ER distance that can be discriminated is n
−1
.
This problem is, at least theoretically, obviated from the pdf
approximation-based solutions, in which one-to-one map-
pings are built up between the actual ERs and the ER esti-
mates obtained.
The superiority of the proposed kernel PEM design is
also evident by its flexibility in adjusting the operation of
the monitor. Since the objective of estimating the ER is to
provide a reliable indicator of the system performance, the
consistency of the ER estimate is usually more important
than the absolute value of the ER itself [1]. In conventional
PEM designs, other than increasing the observation time, the
only method of improving the consistency is to define wider
A Novel Pseudoerror Monitor 415
pseudoerror regions, or equivalently, add in larger amount of
signal degradation. As has been mentioned earlier, this ap-
proach may introduce unbearable bias, and in some cases, it
may even lead to misjudgement of the system performance.
In the kernel PEM scheme, better consistency is the imme-
diate outcome of using a larger smoothing parameter. Al-
though it also suffers certain loss of accuracy, this approach is
advantageous in not needing to change the orders of the ER
estimates, that is, lower ERs are mapped to smaller values and
vice versa. Consequently, in the proposed scheme, the incre-
ment of the estimation bias will not show distinctive destruc-
tive effect on the final e valuation of the system performance.
Moreover, the adoption of a narrower pseudoerror region re-
duces the error introduced by linear extrapolation, and this
may be helpful in counteracting the loss of accuracy caused
by oversmoothing the samples.
4.3. Optimum smoothing parameter
For a given operational environment and an observation
time, the performance of a kernel PEM is determined mainly
by the value of the smoothing parameter and the size of the
pseudoerror regions. The former factor dominates the statis-
tical properties of the pdf approximate, while the latter de-
termines the amount of error introduced by the integration
in PER estimation and the extrapolation in ER calculation.
Since controlling the smoothing effect is more flexible, effec-
tive, and reliable, it is highly recommended to be used as the
main means of adjusting the behavior of the monitor. Modi-
fying the thresholds, on the other side, should be kept out of
consideration unless the previous scheme alone cannot ful-
fill the requirement. In this study, we discuss the optimum
smoothing effect for fixed modified thresholds, that is, fixed
setting of the pseudoerror regions.
The smoothing parameter given in (4) works quite well
in the simulations conducted. However, it requires the vari-
ance of the noise to be known a priori, otherwise, a relatively
costly noise variance estimator has to be implemented. Fur-
thermore, inaccurate knowledge or estimate of the variance
may seriously degrade the performance of the monitor. To
obviate these problems, a suboptimum value has been pro-
posed in [6], which relates the smoothing effect to the sample
size
h
o
= n
−1/2
. (11)
Although this formula is simple to use, it is often unable to
provide sufficient smoothing effect. As a consequence, the re-
sultant ER estimate will contain considerable variation.
Other than using a rough approximation as in (11), the
difficulties associated with noise variance estimation can be
overcome by searching for the optimum parameter directly
as follows: initiate the monitoring and set h to a relatively
large value, for example, n
−1/5
;decreaseh iteratively, each
time by a small step size, until the minimum of a predefined
cost function is reached. The cost funct ion should be selected
with respect to the specific requirement. In this study, the
mean square error (MSE) of the logarithmic PER estimate is
used. Since the estimate of the larger of the two PERs to be
exploited in the extrapolation contains comparatively negli-
gible error, without loss of generality, the smaller PER is as-
sumed to be P
r1
and it is used to form the cost function C,
that is,
C = MSE
log
P
r1
= bias
2
log
P
r1
+var
log
P
r1
, (12)
where
bias
log
P
r1
= E
log
P
r1
− log P
r1
,
var
log
P
r1
= E
log
2
P
r1
− E
2
log
P
r1
.
(13)
The value of P
r1
can be obtained from the er ror counting
approach, which provides an unbiased estimate of the ER (or
PER).
To reduce the observation time taken by the error count-
ing estimation, we can consider regulating the variance of the
PER estimate a nd searching for the smallest parameter that
satisfies the consistency requirement. Other factors, such as
the statistical average of the distance between the estimates
of two given ERs, the probability that the ER estimate goes
out of a predefined confidence range, and so forth, may also
be taken into consideration in order to produce the most de-
sirable result. It should be reminded that due to the practical
constraint of the limited precision on computation, a kernel
ER estimator can also give a trivial estimate. In that case, the
use of a larger parameter value becomes necessary.
5. SIMULATION RESULTS
In the simulations conducted, the transmitted signal is as-
sumed to be BPSK modulated and the amplitude of the sig-
nal component at the receiver is normalized to one.
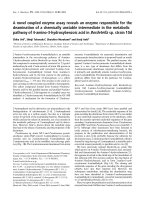
Figure 2 shows the perfor mance of the kernel PEM in
AWGN channel, where the SNR per bit is assumed to be
10 dB and the sample size n is fixed at 2000. In Figure 2a, the
modified thresholds r
1
and r
2
are set to 0.1and0.2, respec-
tively, and the smoothing parameter h is set to 0.04, which
is optimum in the sense of minimizing the MSE of the es-
timate of P
r1
and is obtained using the iterative method de-
scribed previously. Figure 2b shows the effect of using a larger
smoothing parameter, where h is redefined to be 0.1 while
r
1
and r
2
take the same values. Figure 2c illustrates the ef-
fect of using wider pseudoerror regions, where r
1
and r
2
are
set to 0.2and0.4, respectively, and h takes the correspond-
ing optimum value 0.035. For ease of comparison, the the-
oretical ERs are displayed in the figures with dashed lines.
As is clearly illustrated, the consistency of the ER estimate
can be enhanced by increasing the value of the smoothing
parameter or by extending the coverage of the pseudoerror
regions.
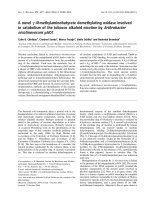
The result obtained with a threshold modification mon-
itor is shown in Figure 3, where the operation conditions
remain unchanged, and n, r
1
,andr
2
are set to 10000, 0.2,
and 0.4, respectively. It can be seen that although the ob-
servation time is much longer and the pseudoerror regions
are much wider, the conventional monitor is still unable to
416 EURASIP Journal on Applied Signal Processing
0
−5
−10
−15
−20
−25
−30
Logarithmic ER estimate
0 100 200 300 400 500
Index of estimate
(a)
−3.5
−4
−4.5
−5
−5.5
−6
−6.5
−7
−7.5
Logarithmic ER estimate
0 100 200 300 400 500
Index of estimate
(b)
−4
−5
−6
−7
−8
−9
−10
−11
−12
Logarithmic ER estimate
0 100 200 300 400 500
Index of estimate
(c)
Figure 2: Performance of the kernel PEM in AWGN channel. The
values of h, r
1
,andr
2
are, respectively, (a) 0.04, 0.1, and 0.2; (b) 0.1,
0.2, and 0.4; and (c) 0.04, 0.2, and 0.4.
−4.4
−4.6
−4.8
−5
−5.2
−5.4
−5.6
−5.8
−6
−6.2
Logarithmic ER estimate
0 20 40 60 80 100
Index of estimate
Figure 3: Performance of the threshold modification monitor in
AWGN channel, where n, r
1
,andr
2
are set to 10000, 0.2, and 0.4,
respectively .
−2.6
−2.8
−3
−3.2
−3.4
−3.6
−3.8
−4
−4.2
Logarithmic ER estimate
0 100 200 300 400 500
Index of estimate
Figure 4: Performance of the kernel PEM in the presence of inter-
ference.
compete with the proposed method. This is shown by the
broken points in the figure, which represent trivial ER esti-
mates.
The effectiveness of the proposed solution is not re-
stricted to Gaussian statistics. Figure 4 shows its performance
in the presence of a random interference signal, where the
SNR per bit and the signal-to-interference ratio are both as-
sumed to be 10 dB and the monitor used is identical to that
used in Figure 2a.
6. CONCLUSION
By combining the strengths of the conventional PEM and
the kernel real-error monitor, the proposed kernel PEM has
been shown to perform better than both. Compared with the
A Novel Pseudoerror Monitor 417
conventional PEM, the proposed monitor is superior in that
it significantly reduces the observation time. Compared with
the kernel real-error monitor, the proposed method has a
better performance in blind state. Overall, the kernel PEM
design has great potential to be applied in practice to offer
fast and statistically consistent blind ER estimate.
REFERENCES
[1] E. A. Newcombe and S. Pasupathy, “Error rate monitoring for
digital communications,” Proceedings of the IEEE, vol. 70, no.
8, pp. 805–828, 1982.
[2] J. M. Aein, “Error rate for peak limited coherent binary chan-
nels,” IEEE Trans. Com. Tech., vol. 16, no. 1, pp. 35–44, 1968.
[3] G. D. Hingorani and D. A. Chestler, “A performance monitor-
ing technique for arbitrary noise statistics,” IEEE Trans. Com.
Tech., vol. 16, no. 3, pp. 430–435, 1968.
[4] G. L. Cariolaro and S. G. Pupolin, “Moments of correlated
digital signals for error probability evaluation,” IEEE Trans.
Inform. Theory, vol. 21, no. 5, pp. 558–568, 1975.
[5] J. E. Gersbach, I. I. Novof, and J. K. Lee, “Fast communication
link bit error rate estimator,” US patent no. 5,418,789, 1995.
[6] J. D. Laster, Robust GMSK demodulation using demodulator di-
versity and BER estimation, Ph.D. thesis, Virginia Polytechnic
Institute and State University, Blacksburg, Va, USA, 1997.
[7] K. A. Phillips, “Probability density function estimation ap-
plied to minimum bit error rate adaptive filtering,” M.S. the-
sis, Virginia Polytechnic Institute and State University, Blacks-
burg, Va, USA, 1999.
[8] K. A. Phillips, J. H. Reed, and W. H. Tranter, “Minimum BER
adaptive filtering,” in Proc. IEEE International Conference on
Communications, pp. 1675–1680, New Orleans, La, USA, June
2000.
[9] D. J. Gooding, “Performance monitor technique for digital
receivers based on extrapolation of error rate,” IEEE Trans.
Com. Tech., vol. 16, no. 3, pp. 380–387, 1968.
[10] J. Keelty and K. Feher, “On line pseudo-error monitors for
digital transmission systems,” IEEE Trans. Communications,
vol. 26, no. 8, pp. 1275–1282, 1978.
[11] E. A. Newcombe and S. Pasupathy, “Error rate monitoring in
a partial response system,” IEEE Trans. Communications, vol.
28, no. 7, pp. 1052–1061, 1980.
[12] T. A. Fitch and M. L. Steinberger, “Eye violation detectors,”
US patent no. 4,633,465, 1986.
[13] I. M. Kostic, “Pseudo error rate of a PSK system with hard-
ware imperfections, noise and cochannel interference,” IEE
Proceedings Part I: Communications, Speech and Vision, vol.
136, no. 5, pp. 333–338, 1989.
[14] B. W. Sprinkle, “Fast and accurate testing of ISDN S/T in-
terface devices using pseudo error rate techniques,” in Proc.
IEEE International Test Conference, pp. 80–85, Washington,
DC, USA, 1990.
[15] T. J. Nohara, A. Premji, and W. R. Seed, “A new signal quality
degradation monitor for digital transmission channels,” IEEE
Trans. Communications, vol. 43, no. 234, pp. 1333–1336, 1995.
[16] B. W. Silverman, Density Estimation for Statistics and Data
Analysis, Monographs on Statistics and Applied Probability.
Chapman & Hall, New York, 1986.
[17] A. J. Izenman, “Recent developments in nonparametric den-
sity estimation,” J. Amer. Statist. Assoc., vol. 86, no. 413, pp.
205–224, 1991.
[18] S. E. Portny, “Large sample confidence limits for binary er-
ror probabilities,” Proceedings of the IEEE, vol. 54, pp. 1993,
December 1966.
Peng Wang received his B.Eng. degree from
Tsinghua University, China, in 1997, and
M.Eng. degree from Nanyang Technologi-
cal University, Singapore, in 2000, both in
electrical engineering. He is currently a Re-
search Engineer in Center for Signal Pro-
cessing, Nanyang Technological University,
Singapore. His research interests include
audio processing, array processing, and ad-
vanced signal processing for communica-
tions.
Wee S e r received his B.S. (Honors) de gree
and Ph.D. degree, both in electrical and
electronic engineering from the Loughbor-
ough University, UK, in 1978 and 1982, re-
spectively. He joined the Defence Science
Organization (DSO), Singapore, as an En-
gineer in 1982 and became the Head of the
Communications Laboratory and later the
Head of the Communications Research Di-
vision in 1988 and 1993, respectively. From
1995 to 1997, he was an Adjunct Associate Professor at the School
of Electrical and Electronic Engineering (EEE) in Nanyang Techno-
logical University (NTU). In 1997, he joined NTU as an Associate
Professor and was appointed the Director of the Centre for Signal
Processing. Wee Ser was a recipient of the Colombo Plan and Pub-
lic Service Commission (PSC) postgraduate scholarships. He was
awarded the IEE Prize during his undergraduate studies. While be-
ing in DSO, he was the recipient of the prestigious Defence Tech-
nology (Individual) Prize in 1991 and an Excellence Award for a
research project in 1992. He is a Senior Member of the IEEE. He
has published more than 60 papers in international journals and
conferences. He holds one patent and has six other pending patents.
His research interests include channel equalization, space-time pro-
cessing, microphone arr ay processing, multiuser detection, noise
control, and fingerprint verification techniques.