Báo cáo hóa học: " Using Noninvasive Wearable Computers to Recognize Human Emotions from Physiological Signals" docx
Bạn đang xem bản rút gọn của tài liệu. Xem và tải ngay bản đầy đủ của tài liệu tại đây (1.11 MB, 16 trang )
EURASIP Journal on Applied Signal Processing 2004:11, 1672–1687
c
2004 Hindawi Publishing Corporation
Using Noninvasive Wearable Computers to Recognize
Human Emotions from Physiological Signals
Christine Lætitia Lisetti
Department of Multimedia Communications, Institut Eurecom, 06904 Sophia-Antipolis, France
Email:
Fatma Nasoz
Department of Computer Science, University of Central Florida, Orlando, FL 32816-2362, USA
Email:
Received 30 July 2002; Revised 14 April 2004
We discuss the strong relationship between affect and cognition and the importance of emotions in multimodal human computer
interaction (HCI) and user modeling. We introduce the overall paradigm for our multimodal system that aims at recognizing
its users’ emotions and at responding to them accordingly depending upon the current context or application. We then describe
the design of the emotion elicitation experiment we conducted by collecting, via wearable computers, physiological signals from
the autonomic nervous system (galvanic skin response, heart rate, temperature) and mapping them to certain emotions (sadness,
anger, fear, surprise, frustration, and amusement). We show the results of three different supervised learning algorithms that
categorize these collected signals in terms of emotions, and generalize their learning to recognize emotions from new collections
of signals. We finally discuss possible broader impact and potential applications of emotion recognition for multimodal intelligent
systems.
Keywords and phrases: multimodal human-computer interaction, emotion recognition, multimodal affective user interfaces.
1. INTRODUCTION
The field of human-computer interaction (HCI) has re-
cently witnessed an explosion of adaptive and customizable
human-computer interfaces which use cognitive user model-
ing, for example, to extract and represent a student’s knowl-
edge, skills, and goals, to help users find information in hy-
permedia applications, or to tailor information presentation
to the user. New generations of intelligent computer user
interfaces can also adapt to a specific user, choose suitable
teaching exercises or interventions, give user feedback about
the user’s knowledge, and predict the user’s future behavior
such as answers, goals, preferences, and actions. Recent find-
ings on emotions have shown that the mechanisms associ-
ated with emotions are not only tightly intertwined neuro-
logically with the mechanisms responsible for cognition, but
that they also play a central role in decision making, problem
solving, communicating, negotiating, and adapting to un-
predictable environments. Emotions are now therefore con-
sidered as organizing and energizing processes, serving im-
portant adaptive functions.
To take advantage of these new findings, researchers in
signal processing and HCI are learning more about the un-
suspectedly strong interface between affect and cognition
in order to build appropriate digital technology. Affective
states play an important role in many aspects of the activi-
ties we find ourselves involved in, including tasks performed
in front of a computer or while interacting with computer-
based technology. For example, being aware of how the user
receives a piece of provided information is very valuable. Is
the user satisfied, more confused, frustrated, amused, or sim-
ply sleepy? Being able to know when the user needs more
feedback, by not only keeping track of the user’s actions, but
also by observing cues about the user’s emotional experience,
also presents advantages.
In the remainder of this article, we document the various
ways in which emotions are relevant in multimodal HCI, and
propose a multimodal paradigm for acknowledging the var-
ious aspects of the emotion phenomenon. We then focus on
one modality, namely, the autonomic nervous system (ANS)
and its physiological signals, and give an extended survey of
the literature to date on the analysis of these signals in terms
of signaled emotions. We furthermore show how, using sens-
ing media such as noninvasive wearable computers capable
of capturing these signals during HCI, we can b egin to ex-
plore the automatic recognition of specific elicited emotions
during HCI. Finally, we discuss research implications from
our results.
Emotion Recognition from P hysiology Via Wearable Computers 1673
2. MULTIMODAL HCI, AFFECT, AND COGNITION
2.1. Interaction of affect and cognition and its
relevance to user modeling and HCI
As a result of recent findings, emotions are now considered
as associated with adaptive, organizing, and energizing pro-
cesses. We mention a few already identified phenomena con-
cerning the interaction between affect and cognition, which
we expect will be further studied and manipulated by build-
ing intelligent interfaces which acknowledge such an interac-
tion. We also identify the relevance of these findings on emo-
tions for the field of multimodal HCI.
Organization of memory and learning
We recall an event better when we are in the same mood as
when the learning occurred [1]. Hence eliciting the same af-
fective state in a learning environment can reduce the cogni-
tive overload considerably. User models concerned with re-
ducing the cognitive overload [2]—by presenting informa-
tion stru ctured in the most efficient way in order to eliminate
avoidable load on working memory—would strongly bene-
fit from information about the affective states of the learners
while involved in their tasks.
Focus and attention
Emotions restrict the range of cue utilization such that fewer
cues are attended to [3]; driver’s and pilot’s safety computer
applications can make use of this fact to better assist their
users.
Perception
When we are happy, our perception is biased at selecting
happy events, likewise for negative emotions [1]. Similarly,
while making decisions, users are often influenced by their
affective states. Reading a text while experiencing a negatively
valenced emotional state often leads to very different inter-
pretation than reading the same text while in a positive state.
User models aimed at providing text tailored to the user need
to take the user’s affective state into account to maximize the
user’s understanding of the intended meaning of the text.
Categorization and preference
Familiarobjectsbecomepreferredobjects[4]. User models,
which aim at discovering the user’s preferences [5], also need
to acknowledge and make use of the knowledge that people
prefer objects that they have been exposed to (incidentally
even when they are shown these objects subliminal ly).
Goal generation and evaluation
Patients wh o have damage in their frontal lobes (cortex com-
munication with l imbic system is altered) become unable to
feel, which results in their complete dysfunctionality in real-
life settings where they are unable to decide what is the next
action they need to perform [6], whereas normal emotional
arousal is intertwined with goal generation and decision-
making, and priority setting.
Decision making and strategic planning
When time constraints are such that quick action is needed,
neurological shortcut pathways for deciding upon the next
appropriate action are preferred over more optimal but
slower ones [7]. Furthermore people with different personal-
ities can have very distinct preference models (Myers-Briggs
Type Indicator). User models of personality [8]canbefur-
ther enhanced and refined with the user’s affective profile.
Motivation and performance
An increase in emotional intensity causes an increase in per-
formance, up to an optimal point (inverted U-curve Yerkes-
Dodson Law). User models which provide qualitative and
quantitative feedback to help students think about and reflect
on the feedback they have received [9] could include affective
feedback about cognitive-emotion paths discovered and built
in the student model during the tasks.
Intention
Not only are there positive consequences to positive emo-
tions, but there are also positive consequences to negative
emotions—they signal the need for an action to take place in
order to maintain, or change a given kind of situation or in-
teraction with the environment [10 ]. Pointing to the positive
signals associated with these negative emotions experienced
during interaction with a specific software could become one
of the roles of user m odeling agents.
Communication
Important information in a conversational exchange comes
from body language [11], voice prosody, facial expressions
revealing emotional content [12], and facial displays con-
nected with various aspec ts of discourse [13]. Communica-
tion will become ambiguous when these are accounted for
during HCI and computer-mediated communication.
Learning
Peoplearemoreorlessreceptivetotheinformationtobe
learned depending on their liking (of the instructor, of the
visual presentation, of how the feedback is given, or of who is
giving it). Moreover, emotional intelligence is learnable [14],
which opens interesting areas of research for the field of user
modeling as a whole.
Given the strong interface between affect and cognition
on the one hand [15], and given the increasing versatility of
computers agents on the other hand, the attempt to enable
our tools to acknowledge affective phenomena rather than to
remain blind to them appears desirable.
2.2. An application-independent paradigm for
modeling user’s emotions and personality
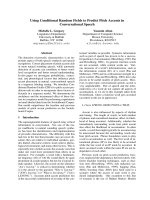
Figure 1 shows the overall paradigm for multimodal HCI,
which was adumbrated earlier by Lisetti [17]. As shown in
the first portion of the picture pointed to by the arrow user-
centered mode, when emotions are experienced in humans,
they are associated with physical and mental manifestations.
1674 EURASIP Journal on Applied Signal Processing
User-centered
MODE
Physical
ANS arousal
Expression
Vocal
Facial
Motor
Mental
Subjective
experience
User’s emotion
representation
Kinesthetic
Auditory
Visual
Kinesthetic
Linguistic
MEDIUM
Wearable
computer
Physiological
signal
processor
Speech/
prosody
recognizer
Facial
expression
recognizer
Haptic cues
processor
Natural
language
processor
Emotion analysis &
recognition
User model
User’s goals
User’s
emotional
state
User’s
personality
traits
User’s
knowledge
Emotion user
modeling
Socially intelligent
agent
Agent’ s goals
Agent’ s
emotional
state
Agent’ s
personality
traits
Agent’ s
contextual
knowledge
Adaptation
to emotions
Agent
action
Context-aware
multimodal adaptation
Agent-centered
mode
Emotion
expression &
synthesis
Figure 1: The MAUI fr amework: multimodal affective user interface [16].
The physical aspect of emotions includes ANS arousal and
multimodal expression (including vocal intonation, facial ex-
pression, and other motor manifestations). The mental as-
pect of the emotion is referred to here as subjective experi-
ence in that it represents what we tell ourselves we feel or
experience about a specific situation.
The second part of the Figure 1, p ointed to by the arrow
medium, represents the fact that using multimedia devices to
sense the various signals associated with human emotional
states and combining these with various machine learning al-
gorithms makes it possible to interpret these signals in order
to categorize and recognize the user’s almost probable emo-
tions as he or she is experiencing different emotional states
during HCI.
A user model, including the user’s current states, the user’s
specific goals in the current application, the user’s personal-
ity traits, and the user’s specific knowledge about the domain
application can then be built and maintained over time dur-
ing HCIs.
Socially intelligent agents, built with some (or all) of
the similar constructs used to model the user, can then
be used to drive the HCIs, adapting to the user’s specific
current emotional state if needed, knowing in advance the
user’s personality and preferences, having its own knowledge
about the application domain and goals (e.g., help the stu-
dent learning in all situations, assist in insuring the driver’s
safety).
Depending upon the application, it might be beneficial
to endow our agent with its own personality to best adapt to
the user (e.g., if the user is a child, animating the interaction
with a playful or with different personality) and its own mul-
timodal modes of expressions—the agent-centered mode—to
provide the best adaptive personalized feedback.
Context-aware multimodal adaptation can indeed take
different forms of embodiments and the chosen user feed-
back need to depend upon the specific application (e.g., us-
ing an animated facial avatar in a car might distract the driver
whereas it might raise a student’s level of interest during
an e-learning session). Finally, the back-arrow shows that
the multimodal adaptive feedback in turn has an effect on
the user’s emotional states—hopefully for the better and en-
hanced HCI.
3. CAPTURING PHYSIOLOGICAL SIGNALS
ASSOCIATED WITH EMOTIONS
3.1. Previous studies on mapping physiological
signals to emotions
As indicated in Tabl e 1, there is growing evidence indeed that
emotional states have their corresponding specific physiolog-
ical signals that can be mapped respectively. In Vr ana’s study
[27], personal imagery was used to elicit disgust, anger, plea-
sure, and joy from par ticipants while their heart rate, skin
conductance, and facial electromyogram (EMG) signals were
measured. The results showed that acceleration of heart rate
was greater during disgust, joy, and anger imageries than
during pleasant imagery; and disgust could be discriminated
from anger using facial EMG.
Emotion Recognition from P hysiology Via Wearable Computers 1675
Table 1: Previous studies on emotion elicitation and recognition.
Reference
Emotion
elicitation
method
Emotions
elicited
Subjects Signals measured
Data analysis
technique
Results
[18]
Personalized
imagery
Happiness,
sadness, and
anger
20 people in
1st study, 12
people in 2nd
study
Facial EMG
Manual
analysis
EMG reliably discriminated
between all four conditions
when no overt facial
differences were apparent
[19]
Facial action
task, relived
emotion task
Anger, fear,
sadness,
disgust, and
happiness
12
professional
actors and 4
scientists
Finger
temperature,
heart rate, and
skin conductance
Manual
analysis
Anger, fear, and sadness
produce a larger increase in
heart rate t han disgust. Anger
produces a larger increase in
finger temperature than fear.
Anger and fear produce larger
heart rate than happiness. Fear
and disgust produce larger skin
conductance than happiness
[20]
Voca l tone ,
slide of facial
expressions,
electric shock
Happiness and
fear
60 under-
graduate
students (23
females and
37 males)
Skin conductance
(galvanic skin
response)
ANOVA
Fear produced a higher level of
tonic arousal and larger phasic
skin conductance
[21]
Imagining and
silently
repeating
fearful and
neutral
sentences
Neutrality and
fear
64
introductory
psychology
students
Heart rate, self
report
ANOVA
Newman-
Keuls
pairwise
comparison
Heart rate acceleration was
more during fear imagery than
neutral imagery or silent
repetition of neutr al sentences
or fearful sentences
[22]
Easy,
moderately,
and extremely
difficult
memory task
Difficult
problem
solving
64 under-
graduate
females from
Stony Brook
Heart rate,
systolic, and
diastolic blood
pressure
ANOVA
Both systolic blood pressure
(SBP) and goal attractiveness
were nonmonotonically related
to expected task difficulty
[23]
Personalized
imagery
Pleasant
emotional
experiences
(low-effort vs.
high effort,
and
self-agency vs.
other-agency)
96 Stanford
University
undergradu-
ates (48
females, 48
males)
Facial EMG,
heart rate, skin
conductance, and
self-report
ANOVA and
regression
Eyebrow frown and smile are
associated with evaluations
along pleasantness dimension,
heart rate measure offered
strong support between
anticipated effort and arousal.
Skin conductance offers
further support for that but
not as strong as heart rate
[24]
Real life
inductions
and imagery
Fear, anger,
and h appiness
42 female
medical
students
(mean age
= 23)
Self-report,
Gottschalk-
Gleser affect
scores, back and
forearm extensor
EMG activity,
body movements,
heart period,
respiration
period, skin
conductance,
skin temperature,
pulse transit time,
pulse volume
amplitude, and
blood volume
ANOVA,
planned
univariate
contrasts
among
means, and
pairwise
comparisons
by using
Hotelling’s T
2
Planned multivariate
comparisons between
physiological profiles
established discriminant
validity for anger and fear.
Self-report confirmed the
generation of affective states in
both contexts
1676 EURASIP Journal on Applied Signal Processing
Table 1: Continued.
Reference
Emotion
elicitation
method
Emotions
elicited
Subjects Signals measured
Data analysis
technique
Results
[25]
Contracting
facial muscles
into facial
expressions
Anger and
fear
12 actors (6
females, 6 males)
and 4 researchers
(1 female, 3 male)
Finger temperature
Manual
analysis
Anger increases tempera-
ture, fear decreases
temperature
[26]
Contracting
facial muscles
into
prototypical
configurations
of emotions
Happiness,
sadness,
disgust, fear,
and anger
46 Minangkabau
men
Heart rate, finger
temperature, finger
pulse transmission,
finger pulse amplitude,
respiratory period, and
respiratory depth
MANOVA
Anger, fear, and sadness
were associated with heart
rate significantly more than
disgust. Happiness was
intermediate
[27]
Imagery
Disgust,
anger,
pleasure,
and joy
50 people (25
males, 25
females)
Self-reports, heart rate,
skin conductance,
facial EMG
ANOVA
Acceleration of heart rate
was greater during disgust,
joy, and anger imageries
than during pleasant
imagery. Disgust could be
discriminated from anger
using facial EMG
[28]
Difficult task
solving
Difficult
task solving
58 undergraduate
students of an
introductory
psychology
course
Cardiovascular activity
(heart rate and blood
pressure)
ANOVA and
ANCOVA
Systolic and diastolic blood
pressure responses were
greater in the difficult
standard condition than in
the easy standard condition
for the subjects who
received high-ability
feedback, however it was
the opposite for the
subjects who received
low-ability feedback
[29]
Difficult
problem
solving
Difficult
problem
solving
32 university
undergraduates
(16 males, 16
females)
Skin conductance,
self-report, objective
task performance
ANOVA,
MANOVA
correlation/
regression
analyses
Within trials, skin
conductance increased at
the b eginning of the trial,
but decreased by the end of
the trials for the most
difficult condition
[30]
Imagery script
development
Neutrality ,
fear, joy,
action,
sadness, and
anger
27 right-handed
males between
ages 21–35
Heart rate, skin
conductance, finger
temperature, blood
pressure,
electro-oculogram,
facial EMG
DFA,
ANOVA
99% correct classification
was obtained. This
indicates that
emotion-specific response
patterns for fear and anger
are accurately differentiable
from each other and from
the response pattern for
neutrality
[31]
Neutrally and
emotionally
loaded slides
(pictures)
Happiness,
surprise,
anger, fear,
sadness, and
disgust
30 people (16
females and 14
males)
Skin conductance, skin
potential, skin
resistance, skin blood
flow, skin temperature,
and instantaneous
respiratory frequency
Friedman
variance
analysis
Electrodermal responses
distinguished 13 emotion
pairs out of 15. Skin
resistance and skin
conductance ohmic
perturbation duration
indices separated 10
emotion pairs. However,
conductance amplitude
could distinguish 7
emotion pairs
Emotion Recognition from P hysiology Via Wearable Computers 1677
Table 1: Continued.
Reference
Emotion
elicitation
method
Emotions
elicited
Subjects Signals measured
Data analysis
technique
Results
[32]
Film showing
Amusement,
neutrality, and
sadness
180 females
Skin
conductance,
inter-beat
interval, pulse
transit times and
respiratory
activation
Manual analysis
Interbeat interval increased
for all three states, but for
the neutrality it was less
than the amusement and
sadness. Skin conductance
increased after the
amusement film, decreased
after the neutrality film,
and stayed the same after
the sadness film
[33]
Subjects were
instructed to
make facial
expressions
Happiness,
sadness, anger,
fear, disgust,
surprise
6 people (3
females and 3
males)
Heart rate,
general somatic
activity, GSR and
temperature
DFA
66% accuracy in classifying
emotions
[34]
Unpleasant
and neutrality
film clips
Fear, disgust,
anger, surprise,
and happiness
46 under-
graduate
students (31
females, 15
males)
Self-report, elec-
trocardiogram,
heart rate, T-wave
amplitude,
respiratory sinus
arrhythmia, and
skin conductance
ANOVA,
Greenhouse-
Geisser
correction. Post
hoc means
comparisons
and simple
effects analyses
Films containing violent
threats increased
sympathetic activation,
whereas the surgery film
increased the electrodermal
activation, decelerated the
heart rate, and increased
the T-wave
[35]
11 auditory
stimuli mixed
with some
standard and
target sounds
Surprise
20 healthy
controls (as a
control
group) and
13 psychotic
patients
GSR
Principal
component
analysis
clustered by
centroid
method
78% for all, 100% for
patients
[36]
Arithmetic
tasks, video
games,
showing faces,
and expressing
specific
emotions
Attention,
concentration,
happiness,
sadness, anger,
fear, disgust,
surprise and
neutrality
10 to 20
college
students
GSR, heart rate,
and s kin
temperature
Manual analysis
No recognition found,
some observations only
[37]
Personal
imagery
Happiness,
sadness, anger,
fear, disgust,
surprise,
neutrality,
platonic love,
romantic love
A healthy
graduate
student with
two years of
acting
experience
GSR, heart rate,
ECG and
respiration
Sequential
floating forward
search (SFFS),
Fisher
Projection (FP)
and hybrid
(SFFS and FP)
81% for by hybrid SFFS
and Fisher method with 40
features 54% rate with 24
features
[38]
Aslow
computer
game interface
Frustration
36 under-
graduate and
graduate
students
Skin conductivity
and blood
volume pressure
Hidden Markov
models
Pattern recognition worked
significantly better than
random guessing while
discriminating between
regimes of likely frustration
from regimes of much less
likely frustration
1678 EURASIP Journal on Applied Signal Processing
In Sinha and Parsons’ study [30], heart rate, skin con-
ductance level, finger temperature, blood pressure, electro-
oculogram, and facial EMG were recorded while the sub-
jects were visualizing the imagery scripts given to them to
elicit neutrality, fear, joy, action, sadness, and anger. The
results indicated that emotion-specific response patterns
forfearandangerareaccuratelydifferentiable from each
other and from the response pattern neutral imagery con-
ditions.
Another study, which is very much related to one of the
applications we will discuss in Section 5 (and which there-
fore we describe at length here), was conducted by Jennifer
Healey from Massachusetts Institute of Technology (MIT)
Media Lab [39]. The study answered the questions about how
affective models of users should be developed for computer
systems and how computers should respond to the emo-
tional states of users appropriately. The results showed that
people do not just create preference lists, but they use af-
fective expression to communicate and to show their satis-
faction or dissatisfaction. Healey’s research particularly fo-
cused on recognizing stress levels of drivers by measuring
and analyzing their physiological signals in a driving envi-
ronment.
Before the driving experiment was conducted, apre-
liminary emotion elicitation experiment was designed where
eight states (anger, hate, grief, love, romantic love, joy, rever-
ence, and no emotion: neutrality) were elicited from partic-
ipants. These eight emotions were Clynes’ [40] emotion set
for basic emotions. This set of emotions was chosen to be
elicited in the experiment because each emotion in this set
was found to produce a unique set of fi nger pressure pat-
terns [40]. While the participants were experiencing these
emotions, the changes in their physiological responses were
measured.
Guided imagery technique (i.e., the participant imagines
that she is experiencing the emotion by picturing herself in
a certain given scenario) was used to generate the emotions
listed above. The participant attempted to feel and express
eight emotions for a varying period of three to five minutes
(with random variations). The experiment was conducted
over 32 days in a single-subject-multiple-session setup. How-
ever only twenty sets (days) of complete data were obtained
at the end of the experiment.
While the participant experienced the given emotions,
her galvanic skin response (GSR), blood volume pressure
(BVP), EMG, and respiration values were measured. Eleven
features were extracted from raw EMG, GSR, BVP, and res-
piration measurements by calculating the mean, the normal-
ized mean, the normalized first difference mean, and the first
forward distance mean of the physiological signals. Eleven-
dimensional feature space of 160 emotions (20 days
× 8emo-
tions) was projected into a two-dimensional space by using
Fisher projection. Leave-one-out cross validation was used
for emotion classification. The results showed that it was
hard to discriminate all eight emotions. However, when the
emotions were grouped as being (1) anger or peaceful, (2)
high arousal or low arousal, and (3) positive valence or neg-
ative valence, they could be classified successfully as follows:
(1) anger: 100%, peaceful: 98%,
(2) high arousal: 80%, low arousal: 88%,
(3) positive: 82%, negative: 50%.
Because of the results of the experiment described above, the
scope of the driving experiment was limited to recognition of
levels of only one emotional state: emotional stress.
At the beginning of the driving experiment, participants
drove in and exited a parking garage, and then they drove in
a city and on a highway, and returned to the same parking
garage at the end. The experiment was performed on three
subjects who repeated the experiment multiple times and six
subjects who drove only once. Videos of the participants were
recorded during the experiments and self-reports were ob-
tained at the end of each session. Task design and question-
naire responses were used to recognize the driver’s stress sep-
arately. The results obtained from these two methods were as
follows:
(i) task design analysis could recognize driver stress level
as being rest (e.g., resting in the parking garage), city
(e.g., driving in Boston streets), or highway (e.g., two-
lane merge on the highway) with 96% accuracy;
(ii) questionnaire analysis could categorize four stress
classes as being lowest, low, higher, or highest with
88.6% accuracy.
Finally, video recordings were annotated on a second-by-
second basis by two independent researchers for validation
purposes. This annotation was used to find a correlation
between stress metr ic created from the video and variables
from the sensors. The results showed that physiological sig-
nals closely followed the stress metric provided by the video
coders.
The results of these two methods (videos and pattern
recognition) coincided in classifying the driver’s stress and
showed that stress levels could be recognized by measuring
physiological signals and analyzing them by pattern recogni-
tion algorithms.
We have combined the results of our survey of other rel-
evant literature [18, 19, 20, 21, 22, 23, 24, 25, 26, 28, 29, 31,
32, 33, 34, 35, 36, 37, 38] into an extensive survey-table. In-
deed,Table 1 identifies many chronologically ordered studies
that
(i) analyze different body signal(s) (e.g., skin conduc-
tance, heart rate),
(ii) use different emotion elicitation method(s) (e.g., men-
tal imagery, movie clips),
(iii) work with with varying number of subjects,
(iv) classify emotions according to different method(s) of
analysis,
(v) show their different results for various emotions.
Clearly, more research has been performed in this domain,
and yet still more remains to be done. We only included the
sources that we were aware of, with the hope to assist other
researchers on the topic.
Emotion Recognition from P hysiology Via Wearable Computers 1679
Table 2: Demographics of subject sample aged 18 to 35 in pilot panel study.
Classification
Gender Ethnicity
Female Male Caucasian African American Asian American Hispanic American
Number of subjects 77 10 1 2 1
Table 3: Movies used to elicit different emotions (Gross and Levenson [41 ]).
Emotion Movie N Agreement Mean Intensity
∗
Sadness
Bambi 72 76% 5.35
The Champ 52 94% 5.71
Amusement When Harry Met Sally 72 93% 5.54
Fear
The Shining 59 71% 4.08
Silence of the Lambs 72 60% 4.24
Anger My Bodyguard 72 42% 5.22
Surprise Capricorn One 63 75% 5.05
3.2. Our study to elicit emotions and capture
physiological signals data
After reviewing the related literature, we conducted our own
experiment to find a mapping between physiological sig-
nals and emotions experienced. In our experiment we used
movie clips and difficult mathematics questions to elicit tar-
geted emotions—sadness, anger, surprise, fear, frustration,
and amusement —and we used BodyMedia SenseWear Arm-
band (BodyMedia Inc., www.bodymedia.com)tomeasure
the physiological signals of our participants: galvanic skin
response, heart rate,andtemperature. The following subsec-
tions discuss the design of this experiment and the results
gained after interpreting the collected data. The data we col-
lected in the experiment described below was also used in
another study [42]; however in this article we describe a dif-
ferent feature extraction technique which led to different re-
sults and implications, as will be discussed later.
3.2.1. Pilot panel study for stimuli selection: cho osing
movie clips to elicit specific emotions
Before conducting the emotion elicitation experiment, which
will be described shortly, we designed a pilot panel study
to determine the movie clips that may result in high sub-
ject agreement in terms of the elicited emotions (sadness,
anger, surprise, fear, and amusement). Gross and Levenson’s
work [41] guided our panel study and from their study we
used the movie scenes that resulted in high subject agree-
ment in terms of eliciting the target emotions. Because some
of their movies were not obtainable, and because anger and
fear movie scenes evidenced low subject agreement during
our study, alternative clips were also investigated. The follow-
ing sections describe the panel study and results.
Subject sample
The sample included 14 undergraduate and graduate stu-
dents from the psychology and computer science depart-
ments of University of Central Florida. The demographics
are shown in Table 2.
Choice of movie clips to elicit emotions
Twenty-one movies were presented to the participants. Seven
movies were included in the analysis based on the findings of
Gross and Levenson [41] (as summarized in Table 3). The
seven movie clips extracted from these seven movies were
same as the movie clips of Gross and Levenson’s study.
Additional 14 movie clips were chosen by the authors,
leading to a set of movies that included three movies to elicit
sadness (Powder , Bambi,andThe Champ), four mov ies to
elicit anger (Eye f or an Eye, Schindler’s List, American History
X,andMy Bodyguard), four to elicit surprise (Jurassic Park,
The Hitchhiker, Capricorn One, and a homemade clip called
Grandma), one to elicit disgust (Fear Factor), five to elicit fear
(Jeepers Creepers, Speed, The Shining, Hannibal,andSilence of
the Lambs), and four to elicit amusement (Beverly Hillbillies,
When Harry Met Sally, Drop Dead Fred,andThe Great Dic-
tator).
Procedure
The 14 subjects participated in the study simultaneously.
After completing the consent forms, they filled out the
questionnaires where they answered the demographic items.
Then, the subjects were informed that they would be watch-
ing various movie clips geared to elicit emotions and between
each clip, they would be prompted to answer questions about
the emotions they experienced while watching the scene.
They were also asked to respond according to the emotions
they experienced and not the emotions experienced by the
actors in the movie. A slide show played the various movie
scenes and, after each one of the 21 clips, a slide was pre-
sented asking the participants to answer the survey items for
the prior scene.
Measures
The questionnaire included three demographic questions:
age ranges (18–25, 26–35, 36–45, 46–55, or 56+), gender, and
ethnicity. For each scene, four questions were asked. The first
question asked, “Which emotion did you experience from this
1680 EURASIP Journal on Applied Signal Processing
Table 4: Agreement rates and average intensities for movies to elicit different emotions with more than 90% agreement across subjects.
Emotion Movie Agreement Mean Intensity SD
Sadness
Powder 93% 3.46 1.03
Bambi 100% 4.00 1.66
The Champ 100% 4.36 1.60
Amusement
Beverly Hillbillies 93% 2.69 1.13
When Harry Met Sally 100% 5.00 0.96
Drop Dead Fred 100% 4.00 1.21
Great Dictator 100% 3.07 1.14
Fear The Shining 93% 3.62 0.96
Surprise Capricorn One 100% 4.79 1.25
N = 14
Table 5: Movie scenes selected for the our experiment to elicit five
emotions.
Emotion Movie Scene
Sadness The Champ Death of the Champ
Anger Schindler’s List Woman engineer being shot
Amusement Drop Dead Fred Restaurant scene
Fear The Shining Boy playing in hallway
Surprise Capricorn One Agents burst through the door
video clip (please check one only)?,” a nd provided eig h t op-
tions (anger, frustration, amusement, fear, disgust, surprise,
sadness, and other). If the participant checked “other” they
were asked to specify which emotion they experienced (in an
open choice format). The second question asked the partici-
pants to rate the intensity of the emotion they experienced on
a six point scale. The third question asked whether they ex-
perienced any other emotion at the same intensity or higher,
and if so, to specify what that emotion was. The final ques-
tion asked whether they had seen the movie before.
Results
The pilot panel study was conducted to find the movie clips
that resulted in (a) at least 90% agreement on eliciting the
target emotion and (b) at least 3.5 average intensity.
Table 4 lists the agreement rates and average intensities
for the clips with more than 90% agreement.
There was not a movie with a high level of agreement for
anger. Gross and Levenson’s [41] clips were most successful
at eliciting the emotions in our investigation in terms of high
intensity, except for anger. In their study, the movie with the
highest agreement rate for anger was My Bodyguard (42%).
In our pilot study, however, the agreement rate for My Body-
guard was 29% with a higher agreement rate for frustration
(36%), and we therefore chose not to include it in our final
movie selection. However, because anger is an emotion of in-
terest in a dr iving environment which we are particularly in-
terested in studying, we did include the movie with the high-
est agreement rate for anger, Schindler’s List (agreement rate
was 36%, average intensity was 5.00).
In addition, for amusement, the movie Drop Dead Fred
was chosen over When Harry Met Sally in our final selection
due to the embarrassment experienced by some of the sub-
jects when watching the scene from WhenHarryMetSally.
The final set of movie scenes chosen for our emotion
elicitation study is presented in Tabl e 5.Asmentionedin
Section 3.2.1, for the movies that were chosen from Gross
and Levenson’s [41] study, the movie clips extracted from
these movies were also the same.
3.2.2. Emotion elicitation study: eliciting specific
emotions to capture associated body signals
via wearable computers
Subject sample
The sample included 29 undergraduate students enrolled in
a computer science course. The demographics are shown in
Table 6 .
Procedure
One to three subjects participated simultaneously in the
study during each session. After signing consent forms,
they were asked to complete a prestudy questionnaire and
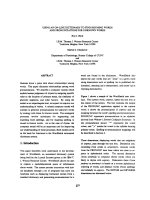
the noninvasive BodyMedia SenseWear Armband (shown in
Figure 2) was placed on each subject’s right arm.
As shown in Figure 2, BodyMedia SenseWear Armband is
a noninvasive wearable computer that we used to collect the
physiological signals from the participants. SenseWear Arm-
band is a versatile and reliable wearable body monitor cre-
ated by BodyMedia, Inc. It is worn on the upper arm and
includes a galvanic skin response sensor, skin temperature
sensor, two-axis accelerometer, heat-flux sensor, and a near-
body ambient temperature sensor. The system also includes
polar chest strap which works in compliance w ith the arm-
band for heart rate monitoring. SenseWear Armband is ca-
pable of collecting, storing, processing, and presenting phys-
iological signals such as GSR, heart rate, temperature, move-
ment, and heat flow. After collecting signals, the SenseWear
Armband is connected to the Innerwear Research Software
(developed by BodyMedia, Inc.) either with a dock station or
wirelessly to transfer the collected data. The data can either
Emotion Recognition from P hysiology Via Wearable Computers 1681
Table 6: Demographics of subject sample in emotion elicitation study.
Classification
Gender Ethnicity Age range
Female Male Caucasian African American Asian American Unreported 18 to 25 26 to 40
Number of subjects 326 21 1 1 6 19 10
Figure 2: BodyMedia SenseWear Armband.
be stored in XML files for further interpretation with pattern
recognition algorithms or the software itself can process the
data and present it using graphs.
Once the BodyMedia SenseWear Armbands were worn,
the subjects were instructed on how to place the chest strap.
After the chest st raps connected with the armband, the in-
study questionnaire were given to the subjects and they were
told (1) to find a comfortable sitting position and try not to
move around until answering a questionnaire item, (2) that
the slide show would instruct them to answer specific items
on the questionnaire, (3) not to look ahead at the questions,
and (4) that someone would sit behind them at the beginning
of the study to time-stamp the armband.
A 45-minute slide show was then started. In order to es-
tablish a baseline, the study began with a slide asking the
participants to relax, breathe through their nose, and lis-
ten to soothing music. Slides of natural scenes were pre-
sented, including pictures of the oceans, mountains, trees,
sunsets, and butterflies. After these slides, the first movie
clip played (sadness). Once the clip was over, the next slide
asked the participants to answer the questions relevant to
the scene they watched. Starting again with the slide ask-
ing the subjects to relax while listening to soothing music,
this process continued for the anger, fear, surprise, frustra-
tion, and amusement clips. The frustration segment of the
slide show asked the participants to answer difficult mathe-
matical problems without using paper and pencil. The movie
scenes and frustration exercise lasted from 70 to 231 seconds
each.
Measures
The prequestionnaire included three demographic ques-
tions: age ranges (18–25, 26–35, 36–45, 46–55, or 56+), gen-
der, and ethnicity.
The in-study questionnaire included three questions for
each emotion. The first question asked, “Did you experience
SADNESS (or the relevant emotion) during this section of the
experime nt?,” and required a yes or no response. The sec-
ond question asked the participants to rate the intensity of
the emotion they experienced on a six-point scale. The third
question asked participants whether they had experienced
any other emotion at the same intensity or higher, and if so,
to specify what that emotion was.
Finally, the physiological data gathered included heart
rate, skin te mperature, and GSR.
3.2.3. Subject agreement and average intensities
Table 7 shows subject agreement and average intensities for
each movie clip and the mathematical problems. A two-
sample binomial test of equal proportions was conducted to
determine whether the agreement rates for the panel study
differed from the results obtained with this sample. Partic-
ipants in the panel study agreed significantly more to the
target emotion for the sadness and fear films. On the other
hand, the subjects in this sample agreed more for the anger
film.
4. MACHINE LEARNING OF PHYSIOLOGICAL SIGNALS
ASSOCIATED WITH EMOTIONS
4.1. Normalization and feature extraction
After determining the time slots corresponding to the point
in the film where the intended emotion was most likely to be
experienced, the procedures described above resulted in the
following set of physiological records: 24 records for anger, 23
records for fear, 27 records for sadness, 23 records for amuse-
ment, 22 records for frustration, and 21 records for surprise
(total of 140 physiological records). The differences among
the number of data sets for each emotion class are due to the
data loss for the data of some participants during segments
of the experiment.
In order to c alculate how much the physiological re-
sponses changed as the participants went from a relaxed state
to the state of experiencing a particular emotion, we normal-
ized the data for each emotion. Normalization is also impor-
tant for minimizing the individual differences among partic-
ipants in terms of their physiological responses while they
experience a specific emotion.
Collected data was normalized by using the average value
of corresponding data type collected during the relaxation
period for the same participant. For example, we normalized
the GSR values as follows:
normalized GSR =
raw GSR − raw relaxation GSR
raw relaxation GSR
. (1)
1682 EURASIP Journal on Applied Signal Processing
Table 7: Agreement rates and average intensities for the elicited emotions.
Emotion Stimulus: movie or math problem N Agreement Mean intensity SD
Sadness The Champ 27 56% 3.53 1.06
Anger Schindler’s List 24 75% 3.94 1.30
Fear The Shining 23 65% 3.58 1.61
Surprise Capricorn One 21 90% 2.73 1.28
Frustration Math problems 22 73% 3.69 1.35
Amusement Drop Dead Fred 23 100% 4.26 1.10
After data signals were normalized, features were extracted
from the normalized data. Four features were extracted for
each data signal type: minimum, maximum, mean,andvari-
ance of the normalized data. We stored the data in a three-
dimensional array of real numbers: (1) the subjects who par-
ticipated in the experiment, (2) the emotion classes (sadness,
anger, surprise, fear, frustration, and amusement) and (3) ex-
tracted features of data signal types (minimum, maximum,
mean, and variance of GSR, temperature, and heart rate).
Each slot of the array consists of one specific feature of a
specific data signal type, belonging to one specific participant
while s/he was experiencing one specific emotion. (e.g., a slot
contains the mean of normalized skin temperature value of,
say, participant number 1 while s/he was experiencing anger,
while another slot, for example, contains the variance of nor-
malized GSR value of participant number 5 while s/he was
experiencing sadness).
As mentioned, four features were extracted for each data
type and then three supervised learning algorithms were im-
plemented that took these 12 features as input and inter-
preted them. Following subsections describe the algorithms
implemented to find a pattern among these features.
4.2. k-nearest neighbor algorithm
k-nearest neighbor (KNN) algorithm [43] uses two data sets:
(1) the training data set and (2) the test data set. The training
data set contains instances of minimum, maximum, mean,
and variance of GSR, skin temperature, and heart rate val-
ues, and the corresponding emotion class. The test data set is
similar to the training data set.
In order to classify an instance of a test data into an
emotion, KNN calculates the distance between the test data
and each instance of training data set. For example, let
an arbitrary instance x be described by the feature vector
a
1
(x ), a
2
(x ), , a
n
(x ),wherea
r
(x ) is the rth feature of in-
stance x. The distance between instances x
i
and x
j
is defined
as d(x
i
, x
j
), where,
d
x
i
, x
j
=
n
r=1
a
r
x
i
− a
r
x
j
2
. (2)
The algorithm then finds the k closest tra ining instances to
the test instance. The emotion with the highest frequency
among k emotions associated with these k training instances
is the emotion mapped to the test data. In our study KNN
was tested with leave-one-out cross validation.
100%
80%
60%
40%
20%
0%
Predicted emotion
Sad Ang Sur Fear Fru Amu
Elicited emotion
Sadness
Anger
Surprise
Fear
Frustration
Amusement
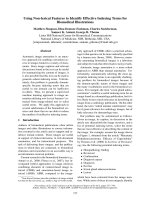
Figure 3: Emotion recognition graph with KNN algorithm.
Figure 3 shows the emotion recognition accuracy rates
with KNN algorithm for each of the six emotions. KNN
could classify sadness with 70.4%, anger with 70.8%, sur-
prise with 73.9%, fear with 80.9%, frustra tion with 78 .3%,
and amusement with 69.6% accuracy.
4.3. Discriminant function analysis
The second algorithm was developed using discriminant
function analysis (DFA) [44], which is a statistical method to
classify data signals by using linear discriminant functions.
DFA is used to find a set of linear combinations of the vari-
ables, whose values a re as close as possible within groups
and as far as possible between groups. These linear combi-
nations are called discriminant functions. Thus, a discrim-
inant function is a linear combination of the discriminat-
ing variables. In our implication of discriminant analysis, the
groups are the emotion classes (sadness, anger, surprise, fear,
frustration, and amusement) and the discr iminant variables
are the extracted features of data signals (minimum, max-
imum, mean, and variance of GSR, skin temperature, and
heart rate).
Let x
i
be the extracted feature of a specific data signal.
The functions used to solve the coefficients are in the form of
f
= u
0
+ u
1
∗ x
1
+ u
2
∗ x
2
+ u
3
∗ x
3
+ u
4
∗ x
4
+ u
5
∗ x
5
+ u
6
∗ x
6
+ u
7
∗ x
7
+ u
8
∗ x
8
+ u
9
∗ x
9
+ u
10
∗ x
10
+ u
11
∗ x
11
+ u
12
∗ x
12
+ u
13
∗ x
13
.
(3)
Emotion Recognition from P hysiology Via Wearable Computers 1683
100%
80%
60%
40%
20%
0%
Predicted emotion
Sad Ang Sur Fear Fru Amu
Elicited emotion
Sadness
Anger
Surprise
Fear
Frustration
Amusement
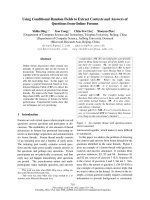
Figure 4: Emotion recognition graph with DFA algorithm.
The objective of DFA is to calculate the values of the coef-
ficients u
0
− u
13
in order to obtain the linear combination.
In order to solve for these coefficients, we applied the gener-
alized eigenvalue decomposition to the between-group and
within-group covariance matrices. The vectors gained as a
result of this decomposition were used to derive coefficients
of the discriminant functions. The coefficients of each func-
tion were derived in order to get a maximized difference be-
tween the outputs of group means and a minimized differ-
ence within the group means.
AscanbeseeninFigure 4, the DFA algorithm’s recogni-
tion accuracy was 77.8% for sadness, 70.8% for anger, 69.6%
for surprise, 80.9% for fear, 72.7% for frustration, and 78.3%
for amusement.
4.4. Marquardt backpropagation algorithm
The third algorithm used was a derivation of a back-
propagation algorithm with Marquardt-Levenberg modifi-
cation called Marquardt backpropagation (MBP) algorithm
[45]. In this technique, first the Jacobian matrix, which con-
tains the first derivatives of the network errors with respect to
the weights and biases, is computed. Then the gradient vector
is computed as a product of the Jacobian matrix (J(x
)) and
the vector of errors (e(x)), and the Hessian approximation is
computed as the product of the Jacobian matrix (J(x )) and
the transpose of the Jacobian matrix (J
T
(x)) [45].
Then the Marquardt-Levenberg modification to the
Gauss-Newton method is given by
∆x =
J
T
(x)J(x)+µI
−1
J
T
(x)e(x). (4)
When µ is 0 or is equal to a small value, then this is the
Gauss-Newton method that is using the Hessian approxima-
tion. When µ is a large value, then this equation is a gradient
descent with a small step size 1/µ. The aim is to make the µ
convergeto0asfastaspossible,andthisisachievedbyde-
creasing µ when there is a decrease in the error function and
100%
80%
60%
40%
20%
0%
Predicted emotion
Sad Ang Sur Fear Fru Amu
Elicited emotion
Sadness
Anger
Surprise
Fear
Frustration
Amusement
Figure 5: Emotion recognition graph with MBP algorithm.
increasing it when there is no decrease in the error function.
The algorithm converges when gradient value reaches below
a previously determined value.
As stated in Section 4.1, a total of 140 usable (i.e., with-
out data loss) physiological records of GSR, temperature, and
heart rate values were collected from the par ticipants for six
emotional states and 12 features (four for each data signal
type) were extracted for each of the physiological record. As a
result, a set of 140 data instances to train and test the network
was obtained. The neural network was trained with MBP al-
gorithm 140 times.
The recognition accuracy gained with MBP algorithm is
shown in Figure 5, which was 88.9% for sadness, 91.7% for
anger, 73.9% for surprise, 85.6% for fear, 77.3% for frustra-
tion, and finally 87.0% for amusement.
Overall, the DFA algorithm was b etter than the KNN al-
gorithm for sadness, fr ustration, and amusement. On the
other hand, KNN performed better than DFA for surprise.
MBP algorithm performed better than both DFA and KNN
for all emotion classes except for surprise and frustration.
5. DISCUSSION AND FUTURE WORK
5.1. Discussion
There are several studies that looked for the relationship be-
tween the physiological signals and emotions, as discussed
in Section 3.1, and some of the results obtained were very
promising. Our research adds to these studies by showing
that emotions can be recognized from physiological signals
via noninvasive wireless wearable computers, which means
that the experiments can be carried out in real environments
instead of laboratories. Real-life emotion recognition hence
becomes closer to achieve.
Our multimodal experiment results showed that emo-
tions can be distinguished from each other and that they can
be categorized by collecting and interpreting physiological
1684 EURASIP Journal on Applied Signal Processing
signals of the participants. Different physiological signals
were important in terms of recognizing different emotions.
Our results show a relationship between galvanic skin re-
sponse and frustration. When a participant was frustrated,
her GSR increased. The difference in GSR values of the frus-
trated participants was higher than the differences in both
heart rate and temperature values. Similarly, heart rate was
more related to anger and fear. Heart rate value of a feared
participant increased, whereas it decreased when the partici-
pant was angry.
Overall, three algorithms, KNN, DFA, and MBP, could
categorize emotions with 72.3%, 75.0%, and 84.1% accu-
racy,respectively.Inapreviousstudy[42] where we inter-
preted the same data set without applying feature extrac-
tion, the overall recognition accuracy was 71% with KNN,
74% with DFA, and 83% with MBP. The results of our latest
study showed that implementing a feature extraction tech-
nique slightly improved the performance of all three algo-
rithms.
Recognition accuracy for some emotions was higher with
the pattern recognition algorithms than the agreement of the
subjects on the same emotions. For example, fear could be
recognized with 80.9% accuracy by KNN and DFA and with
85.6% accuracy by MBP, although the subject agreement on
fear was 65%. This might be understood from Feldman B ar-
rett et al.’s study [46]: the results of this study indicate that
individuals vary in their ability to identify the specific emo-
tions they experience. For example, some individuals are able
to indicate whether they are experiencing a negative or a pos-
itive emotion, but they cannot identify the specific emotion.
5.2. Applications and future work
Our results are promising in terms of creating a multimodal
affective user interface that can recognize its user’s affective
state, adapt to the situation, and interac t with her accord-
ingly, within given context and application, as discussed in
Section 2.1 and depicted in Figure 1.
We are specifically looking into driving safet y where in-
telligent interfaces can be developed to minimize the neg-
ative effects of some emotions and states that have impact
on one’s driving such as anger, panic, sleepiness, and even
road rage [47]. For example, when the system recognizes the
driver is in a state of frustration, anger, or rage, the system
could suggest the driver to change the music to a soothing
one [47], or suggest a relaxation technique [48], depending
on the driver’s preferred style. Similarly, when the system rec-
ognizes that the driver is sleepy, it could suggest (maybe even
insist) that she/he rolls down the window for awakening fresh
air.
Our future work plans include designing and conducting
experiments where driving-related emotions and states (frus-
tration/anger, panic/fear, and sleepiness) are elicited from
the participating drivers while they are driving in a driv-
ing simulator. During the experiment, physiological signals
(GSR, temperature, and heart rate) of the participants will
be measured with both BodyMedia SenseWear (see Figure 2)
and ProComp+ (see Figure 6). At the same time, an ongo-
ing video of each driver will be recorded for annotation and
Figure 6: ProComp+.
facial expression recognition purposes. These measurements
and recordings will be analyzed in order to find unique pat-
terns mapping them to each elicited emotion.
Another application of interest is training/learning where
emotions such as frustration and anxiety affect the learning
capability of the users [49, 50, 51]. In an elec tronic learn-
ing environment, an intelligent affective interface could ad-
just the pace of training when it recognizes the frustration
or boredom of the student, or it can provide encouragement
when it recognizes the anxiety of the student.
One other application is telemedicine where the patients
are being remotely monitored at their home by health-care
providers [52]. For example, when the system accurately rec-
ognizes repetitive sadness (possibly indicating the reoccur-
rence of depression) of telemedicine patients, the interface
could forward this affective information to the health-care
providers in order for them to be better equipped and ready
to respond to the patient.
Those three applications, driver safety, learning, and
telemedicine, are the main ones that we are investigating,
aiming at enhancing HCI via emotion recognition through
multimodal sensing in these contexts. However using the
generic overall paradigm of recognizing and responding to
emotions in a user-dependent and context-dependent man-
ner discussed in Section 2.2 and shown in Figure 1,wehope
that other research efforts might be able to concentrate on
different application areas of affective intelligent interfaces.
Some of our future work will focus on the difficulty to
recognize emotions by interpreting a single (user mode), or
modality. We are therefore planning on conducting multi-
modal studies on facial expression recognition and physi-
ological signal recognition to guide the integration of the
two modalities [16, 53, 54]. Other modalities, as shown in
Figure 1, could include vocal intonation and natural lan-
guage processing to obtain increased accuracy.
6. CONCLUSION
In this paper we documented the newly discovered role
of affect in cognition and identified a variety of human-
computer interaction context in which multimodal affective
information could prove useful, if not necessary. We also
Emotion Recognition from P hysiology Via Wearable Computers 1685
presented an application-independent framework for multi-
modal affective user interfaces, hoping that it will prove use-
ful for building other research efforts aiming at enhancing
human-computer interaction with restoring the role of af-
fect, emotion, and personality in human natural communi-
cation.
Our current research focused on creating a multimodal
affective user interface that will be used to recognize users’
emotions in real-time and respond accordingly, in particu-
lar, recognizing emotion through the analysis of physiolog-
ical signals from the autonomic nervous system (ANS). We
presented an extensive survey of the literature in the form
of a survey table (ordered chronologically) identifying vari-
ous emotion-eliciting and signal-analysis methods for vari-
ous emotions.
In order t o continue to contribute to the research effort of
finding a mapping between emotions and physiological sig-
nals, we conducted an experiment in which we elicited emo-
tions (sadness, anger, fear, surprise, frustration, and amuse-
ment) using movie clips and mathematical problems while
measuring certain physiological signals documented as as-
sociated with emotions (GSR, heart rate, and temperature)
of our participants. After extracting minimum, maximum,
mean, and variance of the collected data signals, three su-
pervised learning algorithms were implemented to interpret
these features. Overall, three algorithms, KNN, DFA, and
MBP, could categorize emotions with 72.3%, 75.0%, and
84.1% accuracy, respectively.
Finally, we would like to emphasize that we are well aware
that full-blown computer systems with multimodal affective
intelligent user interfaces will only be applicable to real use in
telemedicine, driving safety, and learning once the research
is fully mature and results are completely reliable within re-
stricted domains and appropriate subsets of emotions.
ACKNOWLEDGMENTS
The authors would like to thank Kaye Alvarez for her pre-
cious help in setting up the emotion elicitation experiment.
They would also like to acknowledge that part of this research
was funded by a grant from the US Army STRICOM. Part
of this work was accomplished when C. L. Lisetti was at the
University of Central Florida.
REFERENCES
[1] G. Bower, “Mood and memory,” American Psychologist, vol.
36, no. 2, pp. 129–148, 1981.
[2] S.Kalyuga,P.Chandler,andJ.Sweller,“Levelsofexpertiseand
user-adapted formats of instructional presentations: a cogni-
tive load approach,” in Proceedings of the 6th International
Conference on User Modeling (UM ’97), A. Jameson, C. Paris,
and C. Tasso, Eds., pp. 261–272, New York, NY, USA, 1997.
[3] D. Derryberry and D. Tucker, “Neural mechanisms of emo-
tion,” Journal of Consulting and Clinical Psychology, vol. 60,
no. 3, pp. 329–337, 1992.
[4] R. Zajonc, “On the primacy of affect,” American Psychologist,
vol. 39, no. 2, pp. 117–123, 1984.
[5] G. Linden, S. Hanks, and N. Lesh, “Interactive assessment
of user preference models: the automated travel assistant,” in
Proceedings of the 6th International Conference on User Mod-
eling (UM ’97), A. Jameson, C. Paris, and C. Tasso, Eds., pp.
67–78, New York, NY, USA, 1997.
[6] A. Damasio, Descartes’ Error, AvonBooks,NewYork,NY,
USA, 1994.
[7] J. Ledoux, “Emotion and the amygdala,” in The Amygdala:
Neurobiological Aspects of Emotion, Memory, and Mental Dys-
function, J. P. Aggleton, Ed., pp. 339–351, Wiley-Liss, New
York, NY, USA, 1992.
[8] P. Paranagama, F. Burstein, and D. Arnott, “Modeling the per-
sonality of decision makers for active decision support,” in
Proceedings of the 6th International Conference on User Model-
ing (UM ’97), pp. 79–81, Sardinia, Italy, June 1997.
[9] S. Bull, “See yourself write: a simple student model to make
students think,” in Proceedings of the 6th International Con-
ference User Modeling (UM ’97), pp. 315–326, New York, NY,
USA, 1997.
[10] N. H. Frijda, The Emotions, Cambridge University Press, New
York, NY, USA, 1986.
[11] R. Birdwhistle, Kinesics and Context: Essays on Body Mo-
tion and Communication, University of Pennsylvania Press,
Philadelphia, Pa, USA, 1970.
[12] P. Ekman and W. V. Friesen, Unmasking the Face: A Guide to
Recognizing Emotions from Facial Expressions, Prentice-Hall,
Englewood Cliffs, NJ, USA, 1975.
[13] N. Chovil, “Discourse-oriented facial displays in conversa-
tion,” Research on Language and Social Interaction, vol. 25, pp.
163–194, 1991.
[14] D. Goleman, Emotional Intelligence,BantamBooks,New
York, NY, USA, 1995.
[15] H. Leventhal and K. Sherer, “The relationship of emotion to
cognition: a functional approach to a semantic controversy,”
Cognition and Emotion, vol. 1, no. 1, pp. 3–28, 1987.
[16] C. L. Lisetti and F. Nasoz, “MAUI: a multimodal affective user
interface,” in Proceedings of the ACM Multimedia International
Conference, Juan les Pins, France, December 2002.
[17] N. Bianchi-Berthouze and C. L. Lisetti, “Modeling multi-
modal expression of user’s affective subjective experience,”
User Modeling and User-Adapted Interaction,vol.12,no.1,pp.
49–84, 2002.
[18] G. E. Schwartz, P. L. Fair, P. S. Greenberg, Friedman M. J., and
G. L. Klerman, “Facial EMG in the assessment of emotion,”
Psychophysiology, vol. 11, no. 2, pp. 237, 1974.
[19] P. Ekman, R. W. Levenson, and W. V. Friesen, “Autonomic
nervous s ystem activity distinguishes among emotions,” Sci-
ence, vol. 221, no. 4616, pp. 1208–1210, 1983.
[20] J. T. Lanzetta and S. P. Orr, “Excitatory strength of expressive
faces: effects of happy and fear expressions and context on the
extinction of a conditioned fear response,” Journal of Person-
ality and Social Psychology, vol. 50, no. 1, pp. 190–194, 1986.
[21] S. R. Vrana, B. N. Cuthbert, and P. J. Lang, “Fear imagery and
text processing,” Psychophysiology, vol. 23, no. 3, pp. 247–253,
1986.
[22] R. A. Wright, R. J. Contrada, and M. J. Patane, “Task difficulty,
cardiovascular response and the magnitude of goal v alence,”
Journal of Personality and Social Psychology,vol.51,no.4,pp.
837–843, 1986.
[23] C. A. Smith, “Dimensions of appraisal and physiological re-
sponse in emotion,” Journal of Personality and Social Psychol-
ogy, vol. 56, no. 3, pp. 339–353, 1989.
[24] G. Stemmler, “The autonomic differentiation of emotions re-
visited: convergent and discriminant validation,” Psychophys-
iology, vol. 26, no. 6, pp. 617–632, 1989.
[25] R. W. Levenson, P. Ekman, and W. V. Friesen, “Voluntary fa-
cial action generates emotion-specific autonomic nervous sys-
tem activity,” Psychophysiology, vol. 27, pp. 363–384, 1990.
1686 EURASIP Journal on Applied Signal Processing
[26]R.W.Levenson,P.Ekman,K.Heider,andW.V.Friesen,
“Emotion and autonomic nervous system activity in the Mi-
nangkabau of west Sumatra,” Journal of Personality and Social
Psychology, vol. 62, no. 6, pp. 972–988, 1992.
[27] S. Vrana, “The psychophysiology of disgust: differentiating
negative emotional contexts with facial EMG,” Psychophysiol-
ogy, vol. 30, no. 3, pp. 279–286, 1993.
[28] R. A. Wright and J. C. Dill, “Blood pressure responses and
incentive appraisals as a function of perceived ability and ob-
jective task demand,” Psychophysiology, vol. 30, no. 2, pp. 152–
160, 1993.
[29] A. Pecchinenda and C. Smith, “Affective significance of skin
conductance activity during difficult problem-solving task,”
Cognition and Emotion, vol. 10, no. 5, pp. 481–503, 1996.
[30] R. Sinha and O. Parsons, “Multivariate response patterning
of fear and anger,” Cognition and Emotion,vol.10,no.2,pp.
173–198, 1996.
[31] C. Collet, E. Vernet-Maury, G. Delhomme, and A. Dittmar,
“Autonomic nervous system response patterns s pecificity to
basic emotions,” J. Auton. Nerv. Syst, vol. 62, no. 1-2, pp. 45–
57, 1997.
[32] J. J. Gross and R. W. Levenson, “Hiding feelings: the acute
effects of inhibiting negative and positive emotion,” Journal of
Abnormal Psychology, vol. 106, no. 1, pp. 95–103, 1997.
[33] W. Ark, D. C. Dryer, and D. J. Lu, “The emotion mouse,” in
Human-Computer Interaction: Ergonomics and User Interfaces,
H. J. Bullinger and J. Ziegler, Eds., pp. 818–823, Lawrence Erl-
baum, London, UK, 1999.
[34] D. Palomba, M. Sarlo, A. Angrilli, and A. Mini, “Cardiac re-
sponses associated with affective processing of unpleasant film
stimuli,” International Journal of Psychophysiology, vol. 36, no.
1, pp. 45–57, 2000.
[35] M. P. Tarvainen, A. S. Koistinen, M. Valkonen-Korhonen,
J. Partanen, and P. A. Karjalainen, “Analysis of galvanic skin
responses with principal components and clustering tech-
niques,” IEEE Transactions on Biomedical Engineering, vol. 48,
no. 10, pp. 1071–1079, 2001.
[36] M. E. Crosby, B. Auernheimer, C. Aschwanden, and C. Ike-
hara, “Physiological data feedback for application in distance
education,” in Proceedings of Workshop on Perceptive User In-
terfaces (PUI ’01), Orlando, Fl, USA, November 2001.
[37] R. W. Picard, E. Vyzas, and J. Healey, “Toward machine emo-
tional intelligence: analysis of affective physiological state,”
IEEE Transactions Pattern Analysis and Machine Intelligence,
vol. 23, no. 10, pp. 1175–1191, 2001.
[38] J. Scheirer, R. Fernandez, J. Klein, and R. W. Picard, “Frus-
trating the user on purpose: a step toward building an affec-
tive computer,” Interacting With Computers, vol. 14, no. 2, pp.
93–118, 2002.
[39] J. Healey, Wearable and automotive systems for affect recogni-
tion from physiology, Ph.D. thesis, Massachusetts Institute of
Technology, Mass, USA, May 2000.
[40] D. M. Clynes, Sentics: The Touch of Emotions, Anchor Press,
New York, NY, USA, 1977.
[41] J. J. Gross and R. W. Levenson, “Emotion elicitation using
films,” Cognition and Emotion, vol. 9, no. 1, pp. 87–108, 1995.
[42] F. Nasoz, K. Alvarez, C. L. Lisetti, and N. Finkelstein, “Emo-
tion recognition from physiological signals for presence tech-
nologies,” Cognition, Technology, and Work,vol.6,no.1,pp.
4–14, 2004.
[43] T. M. Mitchell, Machine Learning, McGraw-Hill, New York,
NY, USA, 1997.
[44] A. A. Nicol and P. M. Pexman, Presenting Your Findings: A
Practical Guide for Creating Tables, American Psychological
Association, Wash, DC, USA, 1999.
[45] M. T. Hagan and M. B. Menhaj, “Training feedforward net-
works with the Marquardt algorithm,” IEEE Transactions on
Neural Networks, vol. 5, no. 6, pp. 989–993, 1994.
[46] L. Feldman Barrett, J. J. Gross, T. Conner Christensen, and
M. Benvenuto, “Knowing what you’re feeling and knowing
what to do about it: mapping the relation between emotion
differentiation and emotion regulation,” Cognition and Emo-
tion, vol. 15, no. 6, pp. 713–724, 2001.
[47] L. James, Road Rage and Aggressive Driving: Steering Clear
of Hi ghway Wa rfare, Prometheus Books, Amherst, NY, USA,
2000.
[48] J.LarsonandC.Rodriguez, Road Rage to Road-Wise,Tom
Doherty Associates, New York, NY, USA, 1999.
[49] V. E. Lewis and R. N. Williams, “Mood-congruent vs. mood-
state-dependent learning: implications for a view of emotion,”
The Journal of Social Behavior and Personality,vol.4,no.2,pp.
157–171, 1989, Special Issue on Mood and Memory: Theory,
Research, and Applications.
[50] J. J. Martocchio, “Effects of conceptions of ability on anxi-
ety, self-efficacy, and learning in training,” Journal of Applied
Psychology, vol. 79, no. 6, pp. 819–825, 1994.
[51] P. Warr and D. Bunce, “Trainee characteristics and the out-
comes of open learning,” Personnel Psychology, vol. 48, no. 2,
pp. 347–375, 1995.
[52] C. L. Lisetti, F. Nasoz, C. LeRouge, O. Ozyer, and K. Al-
varez, “Developing multimodal intelligent affective interfaces
for tele-home health care,” International Journal of Human-
Computer Studies, vol. 59, no. 1-2, pp. 245–255, 2003, Spe-
cial Issue on Applications of Affective Computing in Human-
Computer Interaction.
[53] C. L. Lisetti and D. J. Schiano, “Facial expression recognition:
where human-computer interaction, artificial intelligence and
cognitive science intersect,” Pragmatics and Cognition, vol. 8,
no. 1, pp. 185–235, 2000.
[54] C. L. Lisetti and D. Rumelhart, “Facial expression recogni-
tion using a neural network,” in Proceedings of the 11th In-
ternational Florida Artificial Intelligence Research Society Con-
ference (FLAIRS ’98), pp. 328–332, AAAI Press, Menlo Park,
Calif, USA, 1998.
Christine Lætitia Lisetti is a Professor
at the Institut Eurecom in the Multime-
dia Communications Department, Sophia-
Antipolis, France. Previously, she lived in
the United States where she was an Assistant
Professor in the Department of Computer
Science at the University of Central Florida.
From 1996 to 1998, she was a Postdoctoral
Fellow at Stanford University in the Depart-
ment of Psychology and the Department of
Computer Science. She received a Ph.D. in computer science in
1995, from Florida International University. She has won multiple
awards including a National Institute of Health Individual Research
Service Award, the AAAI Nils Nilsson Award for Integrating AI
Technologies, and the University of Central Florida COECS Distin-
guished Research Lecturer Award. Her research involves the use of
artificial intelligence techniques in knowledge representation and
machine learning to model affective knowledge computationally.
She has been granted support from federally funded agencies such
as the National Institute of Health, the Office of Naval Research,
and US Army STRICOM as well as from industries such as Inter-
val Research Corporation and Intel Corporation. She is a Member
of IEEE, ACM, and AAAI, is regularly invited to ser ve on program
committees of international conferences, and has cochaired several
international workshops on affective computing.
Emotion Recognition from P hysiology Via Wearable Computers 1687
Fatma N asoz is a Ph.D. candidate in the
Computer Science Department of the Uni-
versity of Central Florida, Orlando, since
August 2001. She earned her M.S. degree
in computer science from the University of
Central Florida and her B.S. degree in com-
puter engineering from Bogazici University
in Turkey, in 2003 and 2000, respectively.
She was awarded the Center for Ad vanced
Transportation System Simulation (CATSS)
Scholarship in 2002 to model emotions of drivers for increased
safety. Her research area is a ffective computing and she specifically
focuses on creating adaptive intelligent user interfaces with emo-
tion recognition abilities that adapt and respond to the user’s cur-
rent emotional state by also modeling their preferences and per-
sonality. Her research involves elicitating emotions in a variety of
contexts, using noninvasive wearable computers to collect the par-
ticipants’ physiological signals, mapping these signals to affective
states, and building adaptive interfaces to adapt appropriately to
the current sensed data and context. She is a Member of the Ameri-
can Association for Artificial Intelligence and of the Association for
Computing Machinery, and she has published multiple scientific
articles.