Báo cáo hóa học: " Linear and Nonlinear Oblivious Data Hiding" ppt
Bạn đang xem bản rút gọn của tài liệu. Xem và tải ngay bản đầy đủ của tài liệu tại đây (800.38 KB, 11 trang )
EURASIP Journal on Applied Signal Processing 2004:14, 2102–2112
c
2004 Hindawi Publishing Corporation
Linear and Nonlinear Oblivious Data Hiding
Litao Gang
InfoDesk, Inc., 660 White Plains Road, Tarrytown, NY 10591, USA
Email:
Ali N. Akansu
Department of Electrical and Computer Engineering (ECE), New Jersey Institute of Technology,
University Heights, Newark, NJ 07102-1982, USA
Email:
Mahalingam Ramkumar
Department of Computer Science and Engineering, Mississippi State University, MS 39762-9637, USA
Email:
Received 31 March 2003; Revised 6 October 2003
The majority of the existing data hiding schemes are based on the direct-sequence (DS) modulation where a low-power random
sequence is embedded into the original cover signal to represent hidden information. In this paper, we investigate linear and non-
linear modulation approaches in digital data hiding. One typical DS modulation algorithm is explored and its optimal oblivious
detector is derived. The results expose its poor cover noise suppression as the hiding signature signal always has much lower energy
than the cover signal. A simple nonlinear algorithm, called set partitioning, is proposed and its performance is analyzed. Analysis
and simulation studies further demonstrate improvements over the existing schemes.
Keywords and phrases: data hiding, watermarking, ML detection, data security.
1. INTRODUCTION
Multimedia data hiding is the art of hiding information in
a multimedia content cover signal, like image, video, audio
and so forth. Its potential applications include, but not limit
to authentication, copyright enforcement, piracy tracking,
and others. Various data hiding techniques are deployed in
different scenarios. For instance, fragile data hiding is often
used for multimedia content authentication, while the robust
data hiding techniques are mostly employed for copyri ght
and ownership proof, illegal replication prevention, and the
like. The requirements and techniques in different applica-
tions vary considerably. This paper focuses on the robust data
hiding techniques.
Transparency and robustness are the two basic require-
ments in the robust data hiding applications. The former re-
quires that the information embedding not compromise the
multimedia perceptual quality; and the latter guarantees that
the embedded information can be reliably identified under
unintentional attacks and malicious tampering efforts. The
data hiding employment can be further classified into two
categories, oblivious and escrow cases. In the oblivious scenar-
ios, the hidden information can b e extracted without refer-
ence to the original signal; by contrast, the cover signal is nec-
essary for embedded message identification in escrow cases.
In practice, the most useful and challeng ing application is the
oblivious data hiding since the original cover signal is often
unavailable at the decoder. Most work in the paper is devoted
to the oblivious data hiding.
Among the existing robust message embedding schemes,
direct-sequence (DS) modulation algorithms have been ex-
tensively studied and widely employed [1, 2, 3, 4]. The algo-
rithms based on this principle embed a key-generated direc-
tion vector s into the cover signal. Perceptual models are usu-
ally employed to constrain the introduced artifacts. Although
originally proposed for escrow applications, the DS schemes
have also been used in oblivious cases, such as message em-
bedding in video [4, 5], audio [1, 6], and images [7, 8]. How-
ever, the performance limitations of these algorithms are not
fully investigated. We try to fill the gap in the literature. In the
first part of the paper, the performance of the DS modulation
and its corresponding detection algorithms is analyzed. Both
theoretical analysis and simulation studies highlight the inef-
ficiency of these algorithms for the cover noise suppression.
This result is intuitive as the hiding signals have very low en-
ergy compared to the original content sig nals. In the second
Linear and Nonlinear Oblivious Data Hiding 2103
part, a novel data hiding algorithm is proposed, and its per-
formance is analyzed and compared with existing schemes.
The rest of this paper is organized as follows. In Section 2,
the per formance of a widely used DS modulation is investi-
gated. Both analytical and simulation studies unveil its in-
ferior results in oblivious applications. Further analysis also
reveals that the ubiquitously-used correlation detector is not
optimal. This paper proposes the maximum likelihood (ML)
detector and its performance is analyzed. In Section 3,a
modified version of the scheme is presented and its perfor-
mance gains are validated through simulation studies. In-
stead of linearly superimposing a hiding signal into the cover
signal, a nonlinear hiding scheme called set partitioning is
proposed in Section 4. The distortion introduced for data
embedding is calculated, and the corresponding ML detec-
tor and suboptimal detectors are discussed in Section 5.In
Section 6, the data embedding and detection performance is
measured in terms of bit error rate (BER) versus distortion-
to-noise ratio (DNR). Simulation results demonstrate per-
formance improvements of the set partitioning technique
over the DS and existing nonlinear data hiding schemes. Fi-
nally, the conclusion is presented in Section 7.
2. DIRECT-SEQUENCE MODUL AT ION EMBEDDING
2.1. Modulation and correlation detection
Most of the existing DS modulation schemes are based on
the simple idea: embedding a low-energy random sequence
into the cover signal while keeping the distortion transpar-
ent. The hidden information is usually extracted via a cor-
relation decoder. Perceptual threshold analysis is often nec-
essary to shape the artifacts introduced. And it is a requisite
to guarantee that the distortion is below the just noticeable
distortion (JND) threshold to meet the data hiding trans-
parency requirement. On the other hand, it is favorable to in-
ject the maximum permissible embedding energy (deep em-
bedding) that enhances the detection reliability w ithout per-
ceptual degradation.
The hidden information is usually embedded in a trans-
form domain of discrete cosine transform (DCT) and
wavelets are the most frequently used domains for image data
hiding, for instance. Given an original coefficient value c
i
in the hiding domain, we exercise one of the most popular
deep-hiding schemes [2], and the resulting coefficient x
i
is
expressed as
x
i
=
c
i
+ w
i
c
i
α to hide bit value 1,
c
i
− w
i
c
i
α to hide bit value 0,
(1)
where α is the perceptual threshold ratio and w
i
is a binary
random value of either +1 or −1. The value of α can be
obtained from empir ical experiments or perceptual models.
The bit is embedded into an original sequence c instead of
one single coefficient in practice. If w is the key-generated
random sequence, given a received sequence r resulting from
a noisy channel transmission of signal x, the test statistic in
the escrow correlation detector is obtained as
q =
N−1
i=0
r
i
− c
i
w
i
=
N−1
i=0
x
i
+ n
i
− c
i
w
i
,(2)
where N is the sequence length and n is the channel noise. If
q>0, and a bit value 1 is decided, and a bit value 0 otherwise.
In the oblivious data hiding applications where the origi-
nal cover signal c is not available, (2) still works. Assume that
the embedded information bit value is 1; the correlation-like
detector output is calculated as
q
=
N−1
i=0
r
i
w
i
=
N−1
i=0
c
i
w
i
+
N−1
i=0
n
i
w
i
+
N−1
i=0
α
c
i
. (3)
Compared with (2), the first term in (3) is a disturbance
term that degrades detection reliability. Considering the in-
dependence of c and w, we can make the approximation
N−1
i=0
c
i
w
i
≈ 0(4)
if the sequence length N is sufficiently large.
In the oblivious hiding scenarios, the original signal is
unavailable and therefore treated as a noise (known as “cover
noise”) by the decoder. Its energ y dominates the channel
noise. For simplicity, in the oblivious detection discussion,
merely the cover noise is considered, that is, assuming n
i
= 0.
Subsequently , (3) is reduced to
q =
N−1
i=0
r
i
w
i
=
N−1
i=0
c
i
w
i
+ α
c
i
=
N−1
i=0
p
i
,(5)
where
p
i
= c
i
w
i
+ α
c
i
. (6)
Note that w
i
assumesavalueofeither+1or−1; therefore,
p
i
= c
i
+ α|c
i
| or p
i
= c
i
− α|c
i
|. Due to the symmetry of
the probability density function (PDF) of c
i
, the statistical
distribution of p
i
is independent of the specific value of w
i
.It
has the same mean value and variance as the random variable
y
i
= c
i
+ α
c
i
. (7)
Suppose that the original coefficient c
i
is identically and
independently distributed (i.i.d.) with the Gaussian PDF c
i
∼
N(0, σ
2
). The expectation of y
i
is computed as
E
y
i
= 2α
∞
0
x
√
1/πσ
e
−x
2
/2σ
2
dx =
2
π
σα. (8)
The variance of y
i
becomes
E
y
i
− E
y
i
2
= E
y
i
−
2
π
σα
2
=
1+α
2
σ
2
.
(9)
2104 EURASIP Journal on Applied Signal Processing
0.31
0.3
0.29
0.28
0.27
0.26
0.25
0.24
0.23
0.22
0.21
BER
40 50 60 70 80 90 100
Sequence length (N)
Simulation result
Analytical result
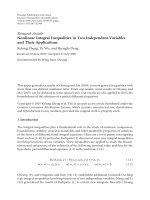
Figure 1: Correlation detection performance.
For a large value of N, the test statistic q in (5) is approx-
imately Gaussian distributed,
q ∼ N
σαN
2
π
, N
1+α
2
σ
2
. (10)
Similarly, if a bit value 0 is embedded, the probability dis-
tribution results in
q ∼ N
− σαN
2
π
, N
1+α
2
σ
2
. (11)
If the decision threshold is set as γ = 0, then the BER is
expressed as
BER = Q
α
2N
1+α
2
π
, (12)
where Q(·) is the Gaussian-PDF tail integral function.
Our simulation results are depicted in Figure 1. The dis-
tortion threshold ratio is chosen as α = 0.1 in the simulation
and the original coefficient x
i
is Gaussian distributed w ith
zero mean and v ariance σ
2
= 50
2
. The information bit is
embedded and decoded using (1)and(3), respectively. The
above analysis result in (12) agrees perfectly with the simula-
tion output. Equation (12)givesusagoodperformancees-
timate of the DS embedding scheme. In fact, the above BER
holds even if c
i
is not Gaussian distributed, according to the
central limit theorem (CLT) [9]. This result unveils the inad-
equacy in the DS approach. Lower BER can only be achieved
with a very large value of N. In other words, the hidden in-
formation detection reliability can only be obtained at the
sacrifice of the hiding capacity.
2.2. Maximum likelihood detection
The modulated signal is not independent of the noise in
the above deep-hiding oblivious scheme (1). Hence the
correlator-like detection may not be optimal.
Provided a received sequence r, the decoder deals with
the hypothesis testing problem
H1: r
i
= c
i
+
c
i
k
i
, bit value 1 is embedded,
H0: r
i
= c
i
−
c
i
k
i
, bit value 0 is embedded,
(13)
where k
i
= w
i
α (k
i
is either +α or −α).
The ML ratio is expressed as
R =
P(H1|r)
P(H0|r)
. (14)
According to the previous assumption that c
i
is Gaussian
distributed, the conditional PDF immediately follows:
f
r
i
|H1
=
1
√
2πσ
1+k
i
· exp
−r
2
i
2
1+k
i
2
σ
2
r
i
> 0
,
1
√
2πσ
1 − k
i
· exp
−r
2
i
2
1 − k
i
2
σ
2
r
i
< 0
,
1
√
2πσ
,
r
i
= 0
.
(15)
Similarly, f (r
i
|H0) can be obtained. If H1 and H0 have
equal a priori probabilities, P(H0) = P(H1), the ML ratio
yields
P
r
i
|H1
P
r
i
|H0
=
1 − k
i
1+k
i
· exp
− β · s
k
i
r
2
i
r
i
> 0
,
1+k
i
1 − k
i
· exp
+ β · s
k
i
r
2
i
r
i
< 0
,
1
r
i
= 0
,
(16)
where s(·) is the sign function defined as
s(x) =
+1, x>0,
−1, x<0,
0, x = 0,
β = γ
1
σ
2
,
γ =
1
2(1 + α)
2
−
1
2(1 − α)
2
.
(17)
If one single bit is embedded in a sequence x, the final
ML ratio in (14)becomes
R =
N−1
i=0
1 − k
i
1+k
i
s(r
i
)
·exp
N−1
i=0
−s
r
i
· s
k
i
· r
2
i
β
. (18)
If R>1, a bit value 1 is decoded, or 0 otherwise. Never-
theless, the above ML detector is quite complicated and com-
putationally extensive. Moreover, the accurate value of the
noise variance σ
2
is usually unavailable. A suboptimal com-
putation efficient detector is a must in real-world applica-
tions. One straightforward observation from (18) is that for
Linear and Nonlinear Oblivious Data Hiding 2105
0.4
0.35
0.3
0.25
0.2
0.15
0.1
0.05
BER
40 50 60 70 80 90 100
Random sequence length (N)
Correlation detection
Suboptimal detection
ML detection
Figure 2: Detection performance comparison.
sufficiently large sequence length N,
N−1
i=0
1 − k
i
1+k
i
s(r
i
)
≈ 1. (19)
This assumption is reasonable as a randomly gener-
ated sequence implies that the counts of −1’s and +1’s are
roughly equal. Under this approximation, a suboptimal de-
tector statistic can be derived immediately from (18),
q =
N−1
i=0
−s
r
i
· r
2
i
γ ·s
k
i
. (20)
The suboptimal detector has comparable computational
complexity as (5). Nevertheless, it outperfor ms the latter as
depicted in Figure 2. In our simulation studies, one single
information bit is embedded into an original coefficient se-
quence using (1). The coefficients in the sequence are i.i.d.
distributed with zero mean and variance σ = 50
2
.Theper-
ceptual distortion threshold ratio value is chosen as α = 0.1.
The embedded bit is detected using (2), the ML detector
using (18), and the suboptimal detector using (19), respec-
tively. The embedding and decoding process is repeated for
different sequence lengths N, and the BER-N plot is shown
in Figure 2. The suboptimal detector improvement over the
correlation-type detector is impressive although it is stil l in-
ferior to the optimum detector (18) due to the approxima-
tion (19).
Any data hiding scheme alters some statistical proper-
ties of the orig inal cover signal. In the embedding operation,
the main impact of the hiding operation (1) is the modifi-
cation of variance value of x
i
. The ML decoder bases the de-
tection decision on the variance value distinction, while the
correlation-like test statistics targets at the mean value. The
gains in the suboptimal detection are intuitive in this per-
spective.
In the next section, we make fur ther attempts to boost
the hiding performance.
3. LINEAR MODUL ATION AND DETECTION
In the hiding scheme aforementioned, we remove the abso-
lute value operator. The data-hiding hypotheses testing be-
comes
H1: r
i
= c
i
+ c
i
k
i
, bit value 1 is embedded,
H0: r
i
= c
i
− c
i
k
i
, bit value 0 is embedded.
(21)
After embedding, the variance of the modified coeffi-
cients is equal to σ
2
1
= (1 + α)
2
σ
2
or σ
2
0
= (1 −α)
2
σ
2
.
Similar to the analysis in Section 2, the ML ratio on r
i
yields
P
r
i
|H1
P
r
i
|H0
=
1 − k
i
1+k
i
· exp
N−1
i=0
−s
k
i
· r
2
i
γ
r
i
= 0
.
(22)
In the above equation, if the sequence length N is even
and w has the equal number of +1’s and −1’s, it can be easily
shown that
N−1
i=0
1 − k
i
1+k
i
= 1. (23)
Finally, the detection test statistic is obtained as
q
=
N−1
i=0
s
k
i
·
r
2
i
γ (24)
and the decision threshold value is q = 0.
The above detector is easy to implement. To guarantee
that the sequence w has equal number of +1’s and −1’s, we
can simply set w = [p, −p], where p is an N/2randomse-
quence length. The shortcoming of this adaptation is the se-
quence security compromise.
The detection performance is computed as follows. In
this hiding scheme, all the original coefficients c
i
can be di-
vided into two sets, A and B, based on the variance value
modification polarity. Suppose that the variance values of the
elements in A are increased while the variances of those in B
are decreased; the statistic test follows as
q =
{r
i
∈A}
r
2
i
γ −
{r
i
∈B}
r
2
i
γ. (25)
After we define two v ariables t
1
=
{r
i
∈A}
r
2
i
and t
0
=
{r
i
∈B}
r
2
i
, it can be proved mathematically that both t
1
and
t
0
have M = N/2 degree of freedom Γ distribution whose
PDF is expressed as
f
t
i
=
t
M/2 −1
i
·e
−t
i
/2σ
2
i
σ
M
i
· 2
M/2
· Γ(M/2)
. (26)
2106 EURASIP Journal on Applied Signal Processing
0.2
0.18
0.16
0.14
0.12
0.1
0.08
0.06
BER
40 50 60 70 80 90 100
Sequence length (N)
Analytical result
Simulation result
Figure 3: Performance comparison in the linear modulation.
With two defined variables A
i
= 1/σ
M
i
·2
M/2
·Γ(M/2) and
C
i
= 1/2σ
2
i
,(26)canberewrittenas
f
t
i
= A
i
· t
n−1
i
e
−C
i
t
i
, (27)
where n = M/2 = N/4.
Suppose that the bit value 1 is embedded; detection prob-
ability BER turns out to be
BER = P
t
1
<t
0
=
+∞
0
f
t
0
dt
0
·
t
0
0
f
t
1
dt
1
=
+∞
0
f
0
t
0
t
0
0
A
1
t
n−1
1
e
−C
1
t
1
dt
1
dt
0
.
(28)
For an integer n, using the formula
x
n
e
−ax
dx =−
e
−ax
a
n+1
·
(ax)
n
+ n(ax)
n−1
+ n(n −1)(ax)
n−2
+ ···+ n!
,
+∞
0
s
n
e
−as
ds =
n!
a
n+1
,
(29)
after some algebraic steps, the final result is
BER =
1+
C
0
C
1
(2n − 2)! +
n
i=2
(n − 1)!
(n − i)!
1+
C
0
C
1
i
·
−A
0
A
1
C
0
+ C
2n
1
+
A
0
A
1
(n − 1)!
2
C
0
C
1
n
.
(30)
Figure 3 illustrates the BER curves obtained from (30)
and the simulation results. In our simulations, the cover sig-
nalvectorisofN components that are i.i.d. with zero mean
0
−1
−2
−3
−4
−5
−6
−7
−8
−9
−10
log (BER)
0 200 400 600 800 1000 1200 1400 1600 1800 2000
Random sequence length (N)
Figure 4: Analytical result in the linear modulation.
and variance σ
2
= 50
2
. One single information bit is embed-
ded via (3) and thereafter extracted using (24). Again, the
distortion threshold ratio is chosen as α = 0.1. The embed-
ding and detection operations are repeated for different se-
quence lengths.
This scheme boasts a simple ML detector and its per-
formance matches the optimum detection in the previous
scheme (1). Bear in mind that the latter has only theoreti-
cal values but limited meanings in practice. Compared with
the feasible suboptimal detector (20), the improvement in
the former is substantial. Furthermore, the neat and com-
pact BER result allows us to predict performance with high
accuracy for a specific hiding parameter set.
In spite of all the optimizations, the DS schemes are still
unsuitable for oblivious data hiding. Figure 4 depicts the
achievable performance at different sequence l engths with
the distortion ratio fixed at α = 0.1. To embed one sin-
gle bit into a 1000-coefficient sequence, the BER upper limit
is BER = 3.91 · 10
−6
. To achieve BER performance up to
BER ≤ 10
−9
, the sequence length must be N>1800. It is the
theoretical limit for the DS approaches (1)and(3). The poor
performance is explained by the inherent limitations of the
DS schemes.
It should be stressed that the Gaussian distributed origi-
nal coefficients are assumed in the above analysis. In practice,
c
i
is usually a coefficient in some transform domain. The PDF
of c
i
is often modeled as a generalized Gaussian or Lapla-
cian distribution [10]. In such cases, the ML detectors are no
longer optimal. Nevertheless, with embedding scheme (1),
the suboptimal detector (20) still outperforms (3).
Figure 5 displays simulation results for Laplacian dis-
tributed coefficients using embedding algorithm (1). The
original coefficients are Laplacian distributed with zero mean
and variance σ
2
= 50
2
. The various detector performances
in (3), (20), and (18) (not optimal) are compared. The JND
threshold ratio α is chosen as α = 0.1. The Laplacian sim-
ulation result is very close to that obtained in the Gaussian
coeffi cient scenarios. Our further studies establish that the
Linear and Nonlinear Oblivious Data Hiding 2107
0.3
0.25
0.2
0.15
0.1
BER
40 60 80 100 120 140 160 180 200
Sequence length (N)
Correlation
Suboptimal detector
ML detector
Figure 5: Performance with Laplacian distributed data.
linear data hiding scheme (3) exceeds the DS embedding
(1). It should be noted that the channel noise is neglected
in the above discussions. Even if it is taken into considera-
tion, further simulations and studies show that the proposed
linear embedding still beats the DS embedding approach and
correlation-like detection.
4. HYPOTHESIS TESTING AND SET PARTITIONING
The shortcoming of the DS schemes lies in its inefficiency
in the cover noise suppression. The hidden signal energy is
much lower than that of the original cover signal which ac t s
as noises. The inferior performance stems from the very low
signal-to-noise ratio (SNR).
Hidden data detection in essence is a hypothesis testing
problem. Suppose c is an original coefficient in which one bit
information is embedded, x denotes the resulting coefficient
after embedding, and r refers to the received coefficient. The
two hypotheses are
H0: bit value 0 is embedded in r,
H1: bit value 1 is embedded in r.
(31)
Obviously, H0 and H1 have different statistical proper-
ties. Otherwise, it is not possible to achie ve reliable detection.
A good hiding algorithm should modify the statistical prop-
erties of the original signal without perceptual degradation.
In a noise-free scenario where r = x, how can the de-
coder make a reliable decision H1 or H0 on a given r?The
answer is simple and straightforward—just to make H0 and
H1 have no element in common. Since the conditional prob-
ability P(H0|x) = 0orP(H1|x) = 0, a correct decision is
always expected.
In order to increase the robustness in a noisy environ-
ment, we can simply keep the elements in H0 and H1 some
distance apart. This simple data hiding idea thus leads to set
Set 0 Set 1 Set 0 Set 1 Set 0 Set 1
d1 d
Figure 6: Set partitioning scheme.
partitioning scheme. Two separate sets are constructed on the
real axis (Figure 6). The coefficient after embedding should
be kept in a set according to the bit value to be hidden. To
embed a bit value 1, the coefficient x should be kept in Set
1. If the value of the original coefficient c is already in Set
1, no modification is needed. Otherwise, it is replaced by the
nearest element in Set 1 to minimize distortion. Similarly, the
value of x is kept in Set 0 to embed a bit value 0.
To embed one bit information in a coefficient sequence
c, the simplest solution is to define a pattern to represent bit
values. In our example, one bit is embedded in a 5-coefficient
sequence. Two sequence patterns, similar to the antipodal
signaling, are defined as follows:
Pattern A (bit 1): [Set 1, Set 0, Set 1, Set 0, Set 1]
Pattern −A (bit 0): [Set 0, Set 1, Set 0, Set 1, Set 0].
(32)
The modified sequence x should comply with Pattern A
to hide the bit value 1, or Pattern −A to hide the value 0.
For instance, the resulting sequence should be x
0
∈ Set 1,
x
1
∈ Set 0, x
2
∈ Set 1, x
3
∈ Set 0, and x
4
∈ Set 1 in order to
embed the value 1.
To further measure the hiding performance, the distor-
tion injected in the scheme is evaluated as fol lows. In many
transform domains, c is assumed to be Laplacian distributed
or generalized Gaussian distributed. For simplicity, here we
make approximations and assume c is uniformly distributed
in the limited range (−a, a), where a is some big value. This
assumption is reasonable because analytical and simulation
results for uniform distributed data are quite close to those
obtained with Laplacian distributed data. This assumption is
a good compromise between accuracy and ease of analytical
work. The hiding distortion can be easily proved indepen-
dent of the specific value of a.
Denote the error introduced in embedding as e = x − c,
in the case where a bit value 1 is embedded, and consider the
typical region AD as depicted in Figure 7.
If c is in the range AB, no modification is needed, thus
e = 0. If c is in the range BD, e is uniformly distributed in the
range (−d −d1/2, d + d1/2). The conditional probability can
be expressed as
P(c ∈ AB|c ∈ AD) =
d1
2d1+2d
,
P(c ∈ BD|c ∈ AD) =
2d + d1
2d1+2d
.
(33)
The average distortion follows immediately,
D =
(2d + d1)
(2d1+2d)
·
(2d + d1)
2
12
=
1
12
(2d + d1)
3
(2d +2d1)
. (34)
Needless to say, this result also holds if the bit value 0 is
embedded.
2108 EURASIP Journal on Applied Signal Processing
Set 1 Set 0 Set 1 Set 0 Set 1
d1 dd1
AB C D
Figure 7: Average distortion calculation.
5. DETECTION IN SET PARTITIONING
5.1. Hard decision detection
In the N-coefficient sequence embedding, the simplest de-
tector is the majority vote which is a hard decision de-
coder based on individual coefficients. In this approach, a
real axis is divided into decision Regions 1 and 0 (Figure 8).
If the received coefficient r
i
falls in Region 1, it is decided
that the transmitted sig nal x comes from Set 1. Other-
wise, it is assumed to or iginate from Set 0. In the exam-
ple mentioned in Section 4, if a received sequence pattern
is {Set 0, Set 0, Set 1, Set 0, Set 0}, which is more similar to
Pattern A (2-coefficient difference) than to Pattern −A(3-
coefficient difference), the decision is made in favor of the bit
value 1.
5.2. Maximum likelihood detection in Gaussian noise
The detection reliability can be enhanced using a soft deci-
sion detector. Provided the received coefficient r
i
after the
Gaussian channel transmission, the ML ratio is [11]
R =
P
x
i
∈ Set 1|r
i
P
x
i
∈ Set 0|r
i
. (35)
The above equation can be written by introducing vari-
ables τ
i
and ξ
i
:
R =
τ
i
∈Set 1
P
τ
i
|r
i
ξ
i
∈Set 0
P
ξ
i
|r
i
, (36)
where
P
τ
i
|r
i
=
P
τ
i
f
r
i
|τ
i
f
r
i
,
P
ξ
i
|r
i
=
P
ξ
i
f
r
i
|ξ
i
f
r
i
.
(37)
The ML ratio is expressed as
R
=
τ
i
∈Set 1
P
τ
i
f
r
i
|τ
i
ξ
i
∈Set 0
P
ξ
i
f
r
i
|ξ
i
, (38)
where f (r
i
|τ
i
) is the Gaussian-noise conditional probability
density,
f
r
i
|τ
i
=
1
√
2πσ
· exp
−
r
i
− τ
i
2
2σ
2
. (39)
Set 1 Set 0 Set 1 Set 0 Set 1
Region 1 Region 1 Region 1
Region 0 R egion 0
Detection region for Set 1 Detection region for Set 0
Figure 8: Hard decision region.
P(s)
d + d1/2
2a
1
2a
ds
d1
11
12
r
s
Figure 9: Calculation of ML ratio.
Under our previous assumption that the original coef-
ficient c
i
is uniformly distributed, the PDF f (c
i
) = (1/2a)
(−a ≤ c
i
≤ a). The probability of the transmitted signal
P(τ
i
) is depicted in Figure 9 after embedding the bit value
1. Note that the probability pulses a ppear at the endpoints.
These signal points are transmitted w ith higher probability
because any c
i
out of Set 1 is replaced by these endpoints.
The probability can be expressed as
τ
i
∈Set 1
P
τ
i
f
r
i
|τ
i
=
1
2a
r
i
−l
1
r
i
−l
1
−d1
1
√
2πσ
e
−(τ
i
−r
i
)
2
/2σ
2
dτ
i
+
1
√
2πσ
d + d1/2
2a
e
−l
2
1
/2σ
2
+
1
2a
l
1
−2d−2d1
l
1
−2d−3d1
1
√
2πσ
e
−(τ
i
−r
i
)
2
/2σ
2
dτ
i
+ ···.
(40)
In the same manner,
ξ
i
∈Set 0
P(ξ
i
) f (r
i
|ξ
i
)canbecalcu-
lated and a similar result is obtained. Nevertheless, this result
does not lead to any closed-form result of ML ratio. More-
over, as the noise power σ
2
is usually unavailable at the de-
coder, this detector is infeasible in practice.
The challenge in detection is that the transmitted signal
can assume any values in these two sets. The ML ratio calcu-
lation involves all elements in Set 1 and Set 0, thereby greatly
increases the computational cost. In the following subopti-
mal methods, we assume that the transmitted signals are dis-
crete instead of continuous.
5.3. Suboptimal detection 1
As a first approximation, it is simply assumed that the trans-
mitted signals are at the centers of the continuous segments,
and the signaling has a pattern like XOXO as depicted in
Figure 10. Signal points X and O have equal a priori prob-
abilities.
Linear and Nonlinear Oblivious Data Hiding 2109
Set 1 Set 0 Set 1 Set 0 Set 1
XOXOX
(a) Suboptimal detection 1.
Set 1 Set 0 Set 1 Set 0 Set 1
XXOOXXOOXX
(b) Suboptimal detection 2.
Figure 10: Suboptimal detection in set partitioning.
TheMLratiothusfollowsasin(35).
This result greatly simplifies the ML ratio calculation, but
it still involves infinite X and O points. Our simulation stud-
ies show that we can further simplify it by merely considering
the nearest X and O points. Thus (35)reducesto
R =
P
r
i
|x
i
= u
i
P
r
i
|x
i
= v
i
, (41)
where u
i
/v
i
is the nearest points X/O in Set 1 and Set 0.
5.4. Suboptimal detection 2
In Figure 9, it is observed that the endpoints are transmitted
with much higher probabilities. Another reasonable approx-
imation assumes that the transmitted signals have XXOO
pattern (Figure 10b).
Given a received signal coefficient r
i
, only the nearest
endpoints in those two sets are considered. Therefore, two
signal candidates u
i
and v
i
are identified. This yields the same
ML ratio as in (41). The only difference is the selection of
possible transmitted signal candidates.
In the case where one single bit is embedded in an N-
coefficient sequence, a sequence detector can be employed. In
the aforementioned example in Section 4,givenareceived5-
coefficient sequence r, we denote the nearest X and O points
to r
i
as u
i
(in Set 1) and v
i
(in Set 0), respectively. Comply-
ing with the predefined pattern in Section 4,twosequence
candidates are constructed as follows:
Pattern A type: a =
u
0
, v
1
, u
2
, v
3
, u
4
,
Pattern
−Atype: b =
v
0
, u
1
, v
2
, u
3
, v
4
.
(42)
If r −a < r −b, the received sequence is more “sim-
ilar” to Pattern A, leading to decoding the bit value 1. Other-
wise, a bit value 0 is decided.
6. RESULTS OF SET PARTITIONING
6.1. Performance analysis
Data hiding is the game played between distortion and ro-
bustness and there is a tradeoff between these two factors.
0.5
0.45
0.4
0.35
0.3
0.25
0.2
0.15
0.1
0.05
0
BER
00.511.522.533.54
SNR (linear scale)
Suboptimal detector 2
Suboptimal detector 1
Majority vote
Figure 11: Detection performance comparison (1 bit embedded in
an 11-coefficient sequence).
The more the distortion introduced is, the more reliable it
could be. To evaluate the performance of set partitioning
scheme, detection of BER is measured for various SNRs in
a Gaussian noise environment. As the data hiding signal en-
ergy is equivalent to distortion injec ted, the DNR is used in-
stead of SNR in the following discussions. The DNR is de-
fined as the ratio of distortion energy D to the noise variance
σ
2
, that is, DNR = D/σ
2
. It should be noted that the distor-
tion energy D is less than the noise energy in most practical
cases.
Our simulation studies use the following Monte Carlo
procedure. A generated random sequence c is composed
of N i.i.d. random variables with zero mean and var iance
σ
2
= 50
2
. The above set partitioning embedding algorithm
is applied to the sequence to hide the bit value 1 or 0. Subse-
quently, a noise vector n with N zero-mean Gaussian random
variables is added to c, which simulates the effect of the addi-
tive Gaussian channel transmission. Given the received signal
sequence, the information bit is extracted using the afore-
mentioned detectors. To validate our algorithms, the simu-
lation procedure is repeated for different values of sequence
length N, signaling parameters d, d1, and Gaussian channel
noise variance.
Figure 11 depicts the simulation result for the suboptimal
detectors and majority vote detector. One information bit is
embedded into an 11-coefficient sequence. The signaling ra-
tio is chosen as d/d1 = 1. It is evident that b oth suboptimal
methods far outperform the hard decision decoder. More-
over, the result shows that suboptimal decoder Method-2 of-
fers remarkable performance improvements over Method-1.
Further simulations and analysis studies reveal that the per-
formance in Method-2 is in good agreement with the opti-
mum ML numerical integral result obtained from (36).
2110 EURASIP Journal on Applied Signal Processing
0.5
0.45
0.4
0.35
0.3
0.25
0.2
0.15
0.1
0.05
0
BER
00.20.40.60.811.21.41.61.82
SNR (linear scale)
d/d1 = 1/1
d/d1 = 1/2
d/d1 = 2/1
Figure 12: BER-DNR at different d/d1 (1 bit embedded in an 8-
coefficient sequence ).
XOXOXOXO
Figure 13: QIM embedding.
It is established that the BER-DNR is only related to the
ratio of d/d1, not the individual values of d and d1. Figure 12
displays the performance in one 1 bit/8-coefficient sequence
embedding. It is apparent that the d/d1performsbetterat
lower DNR. However, larger d/d1 is more advantageous at
higher DNR because in practice, data hiding distortion is not
expected to be more than moderate or severe compression
distortion. Consequently, data hiding always works at lower
DNR, usually DNR < 1. Hence smaller d/d1 is advisable in
the real world.
6.2. Comparison with existing schemes
An existing oblivious data hiding scheme, quantization index
modulation (QIM) [12, 13], is a special case of the set parti-
tioning scheme where the value of d1 is selected as d1
= 0. In
the QIM scheme, the embedding output coefficient X is dis-
crete instead of continuous (Figure 13). In contrast, the set
partitioning scheme provides us with the flexibility to choose
different values of d and d1. In most applications where DNR
is low, we will see that the signaling with d/d1 =∞(QIM) is
not well suited.
In Figure 14, one single bit is embedded into a 4-
coefficient sequence. Several d/d1 ratio selections demon-
strate substantial improvements over the QIM scheme. The
performance gain is remarkable at lower DNR. At the higher
DNR, the QIM scheme performs only slightly better than
the signaling scheme d/d1 = 1, as shown in Figure 15.
The proposed set partitioning method offers the designer
0.5
0.45
0.4
0.35
0.3
0.25
0.2
0.15
0.1
0.05
0
BER
00.511.522.533.54
SNR (linear scale)
QIM
d/d1 = 2/1
d/d1 = 1/1
d/d1 = 1/2
Figure 14: BER-DNR at lower DNR (1 bit embedded in a 4-
coefficient sequence ).
0.018
0.016
0.014
0.012
0.01
0.008
0.006
0.004
0.002
0
BER
33.544.555.56
SNR (linear scale)
QIM
d/d1 = 2/1
d/d1 = 1/1
d/d1 = 1/2
Figure 15: BER-DNR at higher DNR (1 bit embedded in a 4-
coefficient sequence).
an improvement over the QIM technique by choosing an
appropriate signaling ratio d/d1. The reason to select smaller
values of d/d1 ratio in data hiding is twofold; first, data hid-
ing operates at lower DNR in practice; second, this selection
guarantees a fair detection performance even at severe com-
pressions or tampering attacks. In contrast, the QIM scheme
does not survive noisy channels well.
It should be remarked that given the same distortion en-
ergy, the maximum error e in d/d1 = 1 signaling is larger
than that in the QIM scheme. However, even under the same
Linear and Nonlinear Oblivious Data Hiding 2111
OX OX OX O
(a)
XO
(b)
Figure 16: BER in (a) periodic signaling and (b) nonperiodic signaling.
0.5
0.45
0.4
0.35
0.3
0.25
0.2
0.15
0.1
0.05
0
BER
00.511.522.533.54
SNR (linear scale)
QIM case
Antipodal case
Figure 17: BER-SNR in QIM and antipodal cases.
maximum error constraint, which implies less distor tion en-
ergy in d/d1 = 1 signaling, the proposed scheme still demon-
strates significant improvements over the QIM scheme at
lower DNR.
Bear in mind that the BER in QIM scheme is different
from the BER in the antipodal signaling case. Chen and Wor-
nell [12] point out that the BER in QIM could be calculated
the same way as the binary antipodal signaling communica-
tion model. Derived from that, the performance in the an-
tipodal case is BER = Q(d/2σ), where Q(·) is the Gaussian-
PDF tail integral [13].Actuallythisconclusionisnotquite
accurate for most data hiding scenarios, especial ly consider-
ing that the data hiding often takes place at lower DNR in the
real world. It is readily see that the BERs are the area of the
shadowed regions in Figure 16,
BER =
0
−d
1
√
2πσ
e
−(x+d/2)
2
/2σ
2
dx
+
2d
d
1
√
2πσ
e
−(x+d/2)
2
/2σ
2
dx + ···.
(43)
TheanalyticalBERcurvesinQIMschemeandthean-
tipodal signaling case are depicted in Figure 17.Thegapbe-
tween these two schemes is explained by the shadowed area
difference in Figure 16. A more general and rigorous mathe-
matical analysis on QIM data hiding was recently presented
by Perez-Gonzalez [14]. Although the closed-form BER can-
not be obtained, an accurate upper bound is produced in the
work.
The proposed nonlinear scheme can be employed in
place of the direct-sequence hiding presented in Sections 2
and 3. The algorithm can be employed in various data hiding
domains. In our image data hiding experiments, information
bits are embedded in the discrete Fourier transform (DFT)
amplitude domain. A signaling pattern is embedded in the
medium frequency coefficients. The results validate the pro-
posed set partitioning scheme, and have demonst rated ro-
bustness to common compression and various filtering at-
tacks.
The above set partitioning scheme is just a very simple
nonlinear scheme. Its detection is mostly heuristic as seen
from the above discussions. More accurate analysis is very
difficult if not impossible at all. Our detectors are simplified
versions from the ML detection analysis. The above results
and conclusions are derived from our simulations and exper-
iments. They may not be true in all scenarios. For example,
the detection comparisons between Method-1 and Method-2
may not be true at all d/d1 ratios. Premature as they are, the
algorithms give good results in practice. Rigorous analysis is
under further investigation. More accurate artifacts control
and higher hiding capacity are also our next research topics.
7. CONCLUSIONS
In this paper, the DS modulation schemes in obliv-
ious data hiding are investigated. Both analytical and
simulation studies demonstrate that the correlation-like de-
tection widely used in practice is not optimal. The ML and
suboptimal detectors are analyzed, and the performance gain
due to the latter is demonstrated. The results show that the
inferior performance in the linear schemes is due to the cover
noise interference. This limits their employment in oblivious
applications. To facilitate hypothesis testing, a nonlinear set
partitioning scheme is proposed. Its distortion calculation,
2112 EURASIP Journal on Applied Signal Processing
detection and performance analysis, and comparison with
the existing algorithms are further discussed. Both simula-
tion studies and theoretical analysis demonstrate improve-
ments over current data hiding algorithms.
ACKNOWLEDGMENT
The authors would like to thank Dr. Y. Tang for his editorial
contributions.
REFERENCES
[1] L. Boney, A. H. Tewfik, and K. N. Hamdy, “Digital water-
marks for audio signals,” in Proc. 3rd IEEE International Con-
ference on Multimedia Computing and Systems, pp. 473–480,
Hiroshima, Japan, June 1996.
[2] I. J. Cox, J. Kilian, T. Leighton, and T. Shamoon, “A secure,
robust watermark for multimedia,” in Proc. Workshop on In-
formation Hiding, pp. 185–206, Cambridge, UK, May 1996.
[3] F. Hartung, P. Eisert, and B. Girod, “Digital watermarking
of MPEG-4 facial animation parameters,” Computers and
Graphics, vol. 22, no. 4, pp. 425–435, 1998.
[4] F. Hartung and B. Girod, “Watermarking of uncompressed
andcompressedvideo,” Signal Processing,vol.66,no.3,pp.
283–301, 1998.
[5] M.D.Swanson,B.Zhu,andA.H.Tewfik, “Multiresolution
scene-based video watermarking using perceptual models,”
IEEE Journal on Selected Areas in Communications, vol. 16, no.
4, pp. 540–550, 1998.
[6] M. Ikeda, K. Takeda, and F. Itakura, “Audio data hiding
by use of band-limited random sequences,” in Proc. IEEE
Int. Conf. Acoustics, Speech, Signal Processing (ICASSP ’99),
vol. 4, pp. 2315–2318, Phoenix, Ariz, USA, March 1999.
[7] I. Cox and M. L. Miller, “Review of watermarking and the
importance of perceptual modeling,” in Human Vision and
Electronic Imaging II, vol. 3016 of Proceedings of SPIE, pp. 92–
99, Bellingham, Wash, USA, February 1997.
[8] C. I. Podilchuk and W. Zeng, “Image-adaptive watermarking
using visual models,” IEEE Journal on Selected Areas in Com-
munications, vol. 16, no. 4, pp. 525–539, 1998.
[9] A. Leon-Garcia, Probability and Random Processes for Electri-
cal Engineering, Addison-Wesley Publishing Company, Read-
ing, Mass, USA, 1994.
[10] M. Barni, F. Bartolini, A. Piva, and F. Rigacci, “Statistical mod-
elling of full frame DCT coefficients,” in Proc. 9th European
Signal Processing Conference (EUSIPCO ’98), vol. 3, pp. 1513–
1516, Island of Rhodes, Greece, September 1998.
[11] S. M. Kay, Fundamentals of Statistical Signal Processing. Vol.
2: Detection Theory, Prentice Hall PTR, Englewood Cliffs, NJ,
USA, 1998.
[12] B. Chen and G. W. Wornell, “Digital watermarking and in-
formation embedding using dither modulation,” in Proc. 2nd
IEEE Workshop on Multimedia Signal Processing, pp. 273–278,
Redondo Beach, Calif, USA, December 1998.
[13] B.ChenandG.W.Wornell, “Dithermodulation:anewap-
proach to digital watermarking and information embedding,”
in Security and Watermarking of Multimedia Contents, vol.
3657 of Proceedings of SPIE, pp. 342–353, San Jose, Calif, USA,
January 1999.
[14] F. Perez-Gonzalez, F. Balado, and J. R. H. Martin, “Perfor-
mance analysis of existing and new methods for data hiding
with known-host infor mation in additive channels,” IEEE
Trans. Signal Processing, vol. 51, no. 4, pp. 960–980, 2003.
Litao Gang received the B.S. and M.S. de-
grees in electrical engineering from Bei-
jing Institute of Technology, China, and the
Ph.D. degree from New Jersey Institute of
Technology, Newark, New Jersey, in 2001.
He is currently a software engineer in In-
foDesk Inc, Tarrytown, New York, USA. His
research interests include multimedia signal
processing, multimedia copyright protec-
tion management, watermarking and data
hiding, and software/hardware implementations of multimedia al-
gorithms.
Ali N. Akansu received the B.S. degree from
the Technical University of Istanbul in 1980,
and the M.S. and Ph.D. degrees from the
Polytechnic University in 1983 and 1987, re-
spectively, all in electrical engineering. Since
1987, he has been with the New Jersey In-
stitute of Technology, where he is a Pro-
fessor of electrical and computer engineer-
ing. He was the Founding Director of the
New Jersey Center for Multimedia Research
(NJCMR) between 1996 and 2000, and NSF Industry-University
Cooperative Research Center for Digital Video between 1998 and
2000. Dr. Akansu was the vice president of R&D of IDT Corpora-
tion (NYSE: IDT) between June 2000 and September 2001. He was
also the Founding President and CEO of PixWave (IDT subsidiary).
He was an Academic Visitor at IBM T. J. Watson Research Center
and at GEC-Marconi Electronic Systems Corp. during the summers
of 1989 and 1996, and 1992, respectively. He has been a Consultant
of the industr y and he sits on the boards of several companies. His
current research interests include signal theory, linear transforms
and algorithms, signal processing for dig ital communications, In-
ternet multimedia including security aspects, and genes & signals.
Dr. Akansu has published more than 200 refereed conference and
journal articles and four books.
Mahalingam Ramkumar received his B.S.
degree from the University of Madras, In-
dia, 1987, M.S. degree from Indian In-
stitute of Science, Bangalore, India, 1997,
and Ph.D. degree from New Jersey Institute
of Technology, Newark, NJ, (all degrees in
electrical engineering). Since August 2003,
he has been an Assistant Professor w ith the
Department of Computer Science and En-
gineering, Mississippi State University. Be-
tween September 2002 and August 2003 he was a Research Profes-
sor with the Department of Computer and Information Science,
Polytechnic University, Brooklyn, NY. He was the CTO of PixWave
Inc., Newark, NJ, between March 2000 and August 2002. His re-
search interests include sensor/ad hoc networks, cryptography, data
hiding, and data compression.