Báo cáo hóa học: " A MUSIC-Based Algorithm for Blind User Identification in Multiuser DS-CDMA" potx
Bạn đang xem bản rút gọn của tài liệu. Xem và tải ngay bản đầy đủ của tài liệu tại đây (740.58 KB, 9 trang )
EURASIP Journal on Applied Signal Processing 2005:5, 649–657
c
2005 Hindawi Publishing Corporation
A MUSIC-Based Algorithm for Blind User
Identification in Multiuser DS-CDMA
Afshin Haghighat
Department of Electrical Engineering, Concordia University, Montreal, Quebec, Canada H3G 1M8
Email:
M. Reza Soleymani
Department of Electrical Engineering, Concordia University, Montreal, Quebec, Canada H3G 1M8
Email: msole
Received 29 July 2003; Revised 21 April 2004
A blind scheme based on multiple-signal classification (MUSIC) algorithm for user identification in a synchronous multiuser
code-division multiple-access (CDMA) system is suggested. The scheme is blind in the sense that it does not require prior knowl-
edge of the spreading codes. Spreading codes and users’ power are acquired by the scheme. Eigenvalue decomposition (EVD) is
performed on the received signal, and then all the valid possible signature sequences are projected onto the subspaces. However,
as a result of this process, some false solutions are also produced and the ambiguity seems unresolvable. Our approach is to apply
a transformation derived from the results of the subspace decomposition on the received signal and then to inspect their statistics.
It is shown that the second-order statistics of the transformed signal provides a reliable means for removing the false solutions.
Keywords and phrases: blind, user identification, CDMA, MUSIC, multiuser.
1. INTRODUCTION
CDMA-based systems are widely used in various wireless ap-
plications. In order to exploit the capacity of a CDMA sys-
tem, multiuser detection techniques are essential. A large
number of schemes and algorithms have been devised to en-
hance the performance a nd also to reduce the complexity of
a CDMA receiver in a multiuser environment. In most cases,
some prior knowledge of the user parameters, for example,
the spreading code, timing, and power, is assumed. However,
in a real system, this may not be the case. Users enter and exit
the system irregularly and the base station has to keep tr ack
of the status of each user. Various methods could b e used to
transfer users parameters to the base station, however, one
way or the other, they impose some overhead and reduce
system capacity. Therefore, another important aspect of the
CDMA reception is to assist multiuser detection schemes by
user identification. In other words, it is desired to know how
many active users are operating at any given time and w ho
they are. This enables the receiver to dynamically adapt itself
to the multiuser environment. This capability has a twofold
benefit for a CDMA multiuser system. First, the receiver will
be able to maximize the cancellation of multiple-access in-
terference (MAI), since it has the updated information on
other active users. Second, the degree of complexity, which
is almost directly proportional to the performance of the re-
ceiver, can be optimized against the number of active users.
In other words, when there are a small number of users, the
receiver will be able to select a more complex detection algo-
rithm to achieve a lower bit error rate. This is an attractive
feature for software defined radio platforms.
Blind user identification enables the receiver to be more
self-reliant and m ay also improve the system efficiency, since
side information is not required. Moreover, a blind scheme
that is capable of identifying users and their spreading se-
quences is very valuable for signal intercept and nonintrusive
test applications.
Several user identification schemes have recently been in-
troduced [1, 2, 3, 4]. In [1, 2, 3], the outputs of different
branches of a filter bank, each matched to a given signature
sequence, are used to identify the active user. This implies the
prior knowledge of the signature sequences.
Schemes based on the subspace theory have been pro-
posed for blind channel estimation as well as blind detection
for a CDMA multiuser receiver [5, 6]. Subspace concept has
also been used for user identification in a CDMA system. In
[4], a subspace approach based on MUSIC algorithm is in-
troduced that also requires the pr ior knowledge of all the sig-
nature sequences. Also, a blind subspace scheme through re-
cursive estimation of the signature sequences is suggested in
[7], however it does not exhibit a consistent convergence be-
havior.
650 EURASIP Journal on Applied Signal Processing
In this paper, a scheme for blind user identification based
on the MUSIC algorithm [4]isproposed.Theschemerelies
only on the second-order statistics. The main contribution
of this work is that the proposed approach does not require
the prior knowledge of the signature sequences. Spreading
codes and users’ powers are discovered and estimated by the
proposed scheme.
2. SIGNAL MODEL
A synchronous direct sequence (DS-) CDMA system is con-
sidered with a processing gain of N. The received signal prior
to chip rate sampling can be modeled as
r(t) =
K
k=1
A
k
b
k
s
k
(t)+n(t), t ∈ (0, T], (1)
where A
k
, b
k
,ands
k
(t) denote the received amplitude, the
transmitted bit, and the spreading sequence of the kth user,
respectively. A
k
is assumed to be unknown but constant dur-
ing the period of observation. b
k
is a random variable tak-
ing ±1 w ith equal probability. Spreading codes are assumed
short, that is, supporting only the bit interval T. The white
Gaussian noise with a variance of σ
2
is denoted as n(t).
After the chip rate sampling, (1)canbewritteninavector
form as
r =
K
k=1
A
k
b
k
s
k
+ n,(2)
where s
k
= (1/
√
N)[
s
k1
s
k2
··· s
kN
]
T
represents the nor-
malized signature sequence of the kth user. The superscript
T denotes the transpose operation; n is a zero mean white
Gaussian noise vector with a covariance matrix σ
2
I
N
,where
I
N
is the N × N identity matrix. For convenience, (2)canbe
rewritten as
r = SAb + n,(3)
where S = [
s
1
s
2
··· s
K
], A = diag[
A
1
A
2
··· A
K
],
and b = [
b
1
b
2
··· b
K
]
T
.
3. SUBSPACE DECOMPOSITION
AND MUSIC ALGORITHM
The autocorrelation matrix of the received signal r can be
obtained by
C = E
rr
T
= SAbb
T
A
T
S
T
+ σ
2
I
N
= SAA
T
S
T
+ σ
2
I
N
.
(4)
The eigenvalue and eigenvector matrices are obtained by per-
forming EVD on the autocorrelation matrix C:
C = UΛU
T
=
U
s
U
n
Λ
s
0
0 Λ
n
U
T
s
U
T
n
,(5)
where U and Λ are the general eigenvector and eigenvalue
matrices. Performing EVD on the autocorrelation matrix of
the received signal results in two orthogonal subspaces of sig-
nal and noise. The dimension of the signal subspace or, in
other words, the number of active users can be determined
by examining the eigenvalues, since the smallest eigenvalues
have the multiplicity (N − K)[4]. The signal and noise sub-
spaces can be separated as follows:
(i) E
s
: the signal subspace,
Λ
s
= diag[
λ
1
λ
2
··· λ
K
]: K largest eigenvalues,
U
s
= [
u
1
u
2
··· u
K
]: corresponding eigenvectors;
(ii) E
n
: the noise subspace, for all λ
i
= σ
2
,
Λ
n
= diag[
λ
K+1
λ
K+2
··· λ
N
]: remaining N − K
eigenvalues,
U
n
= [
u
K+1
u
K+2
··· u
N
]: corresponding eigenvec-
tors.
An active user’s spreading code lies in the signal subspace
and is orthogonal to the noise subspace. Then by applying
the MUSIC algorithm to spreading codes of all the poten-
tial users, active users can be distinguished [4]. By projecting
each signature sequence s
i
vector onto the noise and signal
subspaces,
f
i
=
s
T
i
E
n
s
T
i
E
n
T
=
s
T
i
E
n
2
(6)
g
i
=
s
T
i
E
s
s
T
i
E
s
T
=
s
T
i
E
s
2
. (7)
If s
i
belongs to an active user, it lies in the signal subspace and
then f
i
is equal to zero, however if it is not equal to zero, it
indicates that the user corresponding to s
i
is not active at this
moment. By the same principle, if the ith user is active, as the
result of s
i
residing in the signal subspace, g
i
equals one, and
is less than one otherwise.
4. BLIND USER IDENTIFICATION
If the signature sequences of the users are not known, we have
to examine the orthogonality of S and the noise subspace for
all combinations of spreading sequences. Since the spreading
code is comprised of N chips, this examination calls for a
complete search over 2
N−1
different possible combinations
of chips in a spreading code. However, there is one major
problem with this approach that needs to be resolved. If there
are K active users in a system
S
=
s
1
s
2
··· s
K
(8)
depending on the cross-correlations between the active codes
and also the set threshold for (6)–(7), application of the MU-
SIC algorithm may not result only in all the active spreading
codes in (8), but also in falsely declaring the linear combina-
tions of them. That is simply because the linear combinations
of the codes will also satisfy
f
i
≈ 0,
g
i
≈ 1.
(9)
An Algorithm for Blind User Identification in Multiuser CDMA 651
r
Spreading code
generator
(2
N−1
-bit counter)
Evaluating C
Performing EVD
No
(MUSIC)
noise
and signal
subspace
projection
Yes
Decorrelation
& checking
the statistics
Picking the signature
sequences associated
with lowest J(d
i
)’s
Figure 1: Flow graph of the proposed approach.
Therefore instead of K,wemayobtainK
mixed solu-
tions (K<K
< 2
N−1
). Depending on the selected thresh-
olds for detection in (6)–(7), K
might even be several times
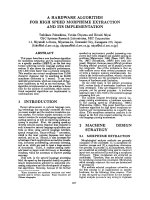
larger than K. As shown in Figure 1, the proposed approach
comprises two steps: (1) applying the MUSIC algorithm and
(2) resolving the ambiguity.
Since the received signal r comprises only K authentic
spreading codes, in order to resolve the ambiguity and dis-
tinguish between the authentic and false solutions, we have
to somehow inspect the relation of each solution to r.Our
approach is as follows. For ever y result from the MUSIC, we
apply a transformation on the received signal and then in-
spect the statistics of the results. The transformation has to
be able to separate different users’ signals to avoid their statis-
tics being mixed up. A proper choice for this task is to use
decorrelating transformation. This does not seem possible
since the spreading codes are not yet known. Assuming prior
knowledge of signature sequences, in a synchronous CDMA
system, we can devise a decorrelator receiver only based on
signal subspace information for each active user [5]. In our
case all the K
solutions resulting from the MUSIC projec-
tion can be regarded as the prior knowledge of signature se-
quences, and since the signal subspace information is already
available from the first step, we can proceed to implement the
decorrelator receiver d
i
for each of the candidate solutions
d
i
= µ
i
U
s
Λ
s
− σ
2
I
K
−1
U
T
s
s
i
,1≤ i ≤ K
, (10)
where µ
i
is a nonzero normalizing factor [5]:
µ
i
=
1
s
T
i
U
s
Λ
s
− σ
2
I
K
−1
U
T
s
s
i
. (11)
Depending on the nature of s
i
, application of (10) to the re-
ceived signal produces different results. If s
i
is an authentic
solution, then d
i
represents a single decorrelating function as
stated in (10):
d
i
= µ
i
U
s
Λ
s
− σ
2
I
K
−1
U
T
s
s
i
. (12)
However, if s
i
is not an authentic solution, it results from
a linear combination of active codes, and then d
i
will be a
linear combination of decorrelating functions of the active
codes as well. If
s
i
=
K
j=1
α
j
s
j
, (13)
where α
j
’s are real numbers representing the combining fac-
tors, then the decorrelating transform is
d
i
= µ
i
U
s
Λ
s
− σ
2
I
K
−1
U
T
s
K
j=1
α
j
s
j
= µ
i
K
j=1
α
j
d
j
µ
j
,
(14)
where
µ
i
=
1
K
j=1
α
j
s
T
i
U
s
Λ
s
− σ
2
I
K
−1
U
T
s
K
l=1
α
l
s
l
=
1
K
j=1
K
l=1
α
j
α
l
s
T
j
U
s
Λ
s
− σ
2
I
K
−1
U
T
s
s
l
=
1
K
j=1
K
l=1
α
j
α
l
/µ
l
s
T
j
d
l
=
1
K
j=1
α
2
j
/µ
j
.
(15)
By applying (10) to the received signal, we have
z
i
= d
T
i
r = d
T
i
SAb + d
T
i
n
= d
T
i
SAb + w
i
,
(16)
where w
i
is white Gaussian noise with a variance σ
2
w
i
=
(d
T
i
d
i
)σ
2
. Application of (12)and(14) results in noise en-
hancement for the two cases. However, the results of decorre-
lating transforms operating on the data part of (16)aresig-
nificantly different. If we only focus on the data part of the
received signal,
z
i
=
A
i
b
i
+ w
i
where s
i
is an original code,
µ
i
K
j=1
α
j
µ
j
A
j
b
j
+ w
i
where s
i
is a linear
combination of codes.
(17)
652 EURASIP Journal on Applied Signal Processing
−0.08 −0.06 −0.04 −0.02 0 0.02 0.04 0.06 0.08
Amplitude samples
0
50
100
150
200
250
300
350
400
Number of samples
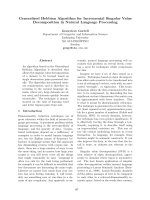
Figure 2: Histogram showing the statistics of the produced samples
for an authentic solution.
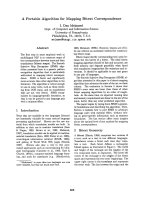
Figures 2 and 3 show histograms of z
i
based on 5000 sam-
ples for the two cases of authentic and false solutions. As
depicted in Figures 2 and 3, the distinct difference between
the two cases lies in their statistics. For the case where s
i
is
an authentic solution, samples at the decorrelator output are
clustered about the ±A
i
.InFigure 2, the only source of per-
turbation of the samples is the additive noise; interference
from other codes does not exist. However, when the s
i
is a
false solution, resulting samples are dispersed significantly.
The amount of dispersion depends on the number of con-
stituting codes, corresponding data bits, combining factors,
and receive amplitudes.
Based on this difference, we define a cost function J(d
i
)
that measures the deviation from the average of the absolute
value of the decorrelation results:
J
d
i
=
E
z
2
i
E
z
i
2
− 1
, (18)
where E(·) indicates expectation of produced samples over
all possible noise and data sequences. Another way to inter-
pret the definition of the cost function is the following. The
main difference between the two cases of a false or authentic
solution is how the power of the signal is distributed over the
amplitude samples. In the case of an authentic solution, the
power is mainly concentrated over a small range of ampli-
tudes in the vicinity of the mean absolute amplitude. How-
ever, in the case of false solution, the values are irregularly
spread over a wide range of samples. Hence, the difference of
the total power and the power of the mean absolute ampli-
tude can be used to distinguish the two cases:
J
d
i
=
P
Total
P
Av.Abs.Amp.
− 1
=
E
z
2
i
E
z
i
2
− 1
. (19)
−0.08 −0.06 −0.04 −0.02 0 0.02 0.04 0.06 0.08
Amplitude samples
0
20
40
60
80
100
120
140
160
Number of samples
Figure 3: Histogram showing the statistics of the produced samples
for a false solution.
Thus, we decide in favor of s
i
as an authentic solution if the
d
i
corresponding to it results in a small value in (18). If s
i
is
an authentic solution, then
z
i
= A
i
b
i
+ w
i
,
p
z
i
=
1
2
√
2πσ
w
i
exp
−
z
i
+ A
i
2
2σ
2
w
i
+
1
2
√
2πσ
w
i
exp
−
z
i
− A
i
2
2σ
2
w
i
.
(20)
Assuming A
i
σ
w
i
,
p
z
i
≈
1
√
2πσ
w
i
exp
−
z
i
− A
i
2
2σ
2
w
i
, (21)
then we have
J
d
i
=
E
z
2
i
E
z
i
2
− 1
=
A
2
i
+ σ
2
w
i
A
2
i
− 1
=
σ
2
w
i
A
2
i
. (22)
Now, we consider the case when s
i
is a false solution. In this
case, since the interference from the other codes is the dom-
inant contributor to the dispersion, and the additive noise is
much less significant,
z
i
= µ
i
K
j=1
α
j
µ
j
A
j
b
j
+ w
i
. (23)
The probability density function of z
i
is a function of
the combining factors, the receive amplitudes, and the in-
formation bits of interfering users. Therefore, a closed
form general derivation does not seem to be easy to find.
An Algorithm for Blind User Identification in Multiuser CDMA 653
For a special case where there are many active users, the prob-
ability density function p(z
i
) can be approximated as a zero
mean Gaussian distribution by using the central limit theo-
rem:
p
z
i
=
1
√
2πσ
z
i
exp
−z
2
i
2σ
2
z
i
, (24)
where
σ
2
z
i
=
K
j=1
µ
i
µ
j
α
j
A
j
2
+ σ
2
w
i
. (25)
Then the mean of the absolute amplitude is
E
z
i
= 2
+∞
0
z
i
p
z
i
=
2
π
σ
z
i
. (26)
Now the cost function can be evaluated:
J
d
i
=
E
z
2
i
E
z
i
2
− 1
=
σ
2
z
i
(2/π)σ
2
z
i
− 1
=
π − 2
2
. (27)
As (27) shows, even if the noise is removed, the interference
term will still remain. The only way to remove the interfer-
ence term and to make (27) insignificant is to have all the
combining factors α
j
= 0, but it contradicts the assumption
of a false solution.
After finding the active spreading codes, user identifica-
tion will be completed by estimating the users’ power. An es-
timate of the users’ powers can be obtained from (4)asfol-
lows:
AA
T
=
S
T
S
−1
S
T
C − σ
2
I
N
S
S
T
S
−1
, (28)
equivalently,
AA
T
= R
−1
S
T
C − σ
2
I
N
SR
−1
, (29)
where σ
2
is estimated from the initial subspace decomposi-
tion. Also, instead of a group estimation of powers, a given
user’s power can be indep endently estimated as
A
2
i
= E
z
2
i
− σ
2
w
i
= E
z
2
i
−
d
T
i
d
i
σ
2
. (30)
5. SIMULATION RESULTS
Through out the simulations, a processing gain of N = 16 is
assumed. The accumulation length for evaluation of autocor-
relation matrix, L1, and the observation length for inspect-
ing the statistics of z
i
, L2, are considered as L1 = 5000 and
L2 = 500 samples, unless specified otherwise. The accumula-
tion lengths can be shortened to make it more appropriate for
a dynamic communication environment. As will be shown,
atrade-off between the accumulation lengths and the detec-
tion margin could be made. Since the spreading codes are not
available in advance, signature sequences are generated by a
2
N−1
counter and then projected onto the subspaces.
−0.25 −0.15 −0.05 0.05 0.15 0.25
Inphase component
−0.25
−0.2
−0.15
−0.1
−0.05
0
0.05
0.1
0.15
0.2
0.25
Quadrature component
(a)
−0.25 −0.15 −0.05 0.05 0.15 0.25
Inphase component
−0.25
−0.2
−0.15
−0.1
−0.05
0
0.05
0.1
0.15
0.2
0.25
Quadrature component
(b)
Figure 4: Decorrelation results from two di fferent false solutions.
Figure 4 shows samples resulting from decorrelating the
received signal through two different false solutions. For both
cases, since false solutions are linear combinations of sev-
eral signature sequences, the samples a re widely dispersed.
Figure 5 demonstrates the case for an authentic solution. T he
samples are symmetrically distributed about the origin, ex-
hibiting almost zero dispersion.
In the next simulation, signals from 10 users arrive at
the receiver. As a result of initial subspace decomposition
and projection, 64 solutions are found. By inspecting the
eigenvalues, it is learned that there are only 10 active users
and the remaining 54 solutions are false. In order to re-
solve the ambiguity, the cost function is measured for each
solution and its inverse is plotted in Figure 6. As shown,
654 EURASIP Journal on Applied Signal Processing
−0.25 −0.15 −0.05 0.05 0.15 0.25
Inphase component
−0.25
−0.2
−0.15
−0.1
−0.05
0
0.05
0.1
0.15
0.2
0.25
Quadrature component
Figure 5: Decorrelation results from an authentic solution.
solutions associated with active users have significantly
higher J(d
i
)
−1
, and false solutions can be easily distinguished
and eliminated by their low J(d
i
)
−1
. T he simulation is re-
peated for two different conditions of signal-to-noise ratio
(SNR). In Figure 6a, it is assumed that all users are of equal
power and have an equal SNR = 30 dB. However, for the
second case presented in Figure 6b, it is assumed that there
is one weak user with S NR = 20 dB and for the remaining
9users,SNR= 30 dB. This is a worst-case scenario for the
weak user. Figure 6 demonstrates that for both cases of equal
and nonequal power, there is a considerable margin for cor-
rect discover y of the active users.
For a dynamic communication environment, it is es-
sential that the processing delay for detection of the active
users be reduced. In the following simulations, we investi-
gate the effect of observation lengths on the detection pro-
cess. In the simulations, 10 equal-power users with SNR =
30 dB are assumed. Figure 7 presents the result for the ef-
fect of L1, while L2 = 500. In principle, L1hastobelong
enough to assure an accurate capture of the statistics of the
received signal. Thus, in a system with K active user, one
may expect that L1 should to be several times larger than
2
K
.AsFigure 7 shows, although L1 = 50 causes signifi-
cant reduction in detection margin, a value of L1 = 500,
while not being too long, can provide a significant mar-
gin for detection. Since the length of L1 is proportional to
the number of active users, in practice the selection of L1
can be done adaptively as follows. The process starts with
a moderate value for L1, and then by obtaining the num-
ber of act ive users from the subspace decomposition, L1
can be adjusted for the next batch accordingly. For exam-
ple, if the number of active users is found to be small, then
L1 can be shortened. On the other hand, if K was large,
then L1 should be increased for an accurate tracking of the
users.
010203040506070
Solution index
10
0
10
1
10
2
10
3
1/J
(a)
010203040506070
Solution index
10
0
10
1
10
2
10
3
1/J
(b)
Figure 6: Plots of 1/J for all the solutions resulting from MUSIC:
(a) equal-power users with SNR = 30 dB, (b) unequal-power users,
one user with SNR = 20 dB and others with SNR = 30 dB.
Figure 8 shows the effect of L2 on the detection process.
L2 can be selected significantly smal ler than L1, since b
k
takes
only ±1. As Figure 8 demonstrates, the difference between
L2=100 and L2=1000 is negligible. Therefore, in order to ac-
quire an accurate estimate of the statistics of z
i
, L2canbe
only a few tens of bit periods long. Also, it is worthwhile to
note that the main difference between L2 = 10 and L2 = 100
is in the floor level of the plots. A higher value of L2 results
in a lower and a more uniform floor for the J(d
i
)
−1
plot. To
summarize our observations from Figures 7 and 8,itcanbe
concluded that the impact of L1 is more on the peaks, how-
ever L2 influences the floor level of the J(d
i
)
−1
plots.
Figure 9 shows the estimation error (σ
Ai
/A
i
) of the re-
ceive amplitude at various users’ powers scenarios. In this
case, we assume there are 8 active users in the system.
An Algorithm for Blind User Identification in Multiuser CDMA 655
L1 = 50, L2 = 500
0 1020304050607080
Solution index
10
0
10
1
10
2
10
3
1/J
(a)
L1 = 500, L2 = 500
0 1020304050607080
Solution index
10
0
10
1
10
2
10
3
1/J
(b)
L1 = 5000, L2 = 500
0 1020304050607080
Solution index
10
0
10
1
10
2
10
3
1/J
(c)
Figure 7: Effect of L1, the a ccumulation length required for evaluation of the autocorrelation matrix, on the detection process.
After performing the identification, we estimate their pow-
ers. Users are grouped into one, two, four, and eight groups
of equal powers with the following SNR’s (dB) at the receiver
side:
SNR =
20 26 29.5323435.536.938
,
SNR =
20 20 26 26 32 32 38 38
,
SNR
=
20 20 20 20 26 26 26 26
,
SNR =
20 20 20 20 20 20 20 20
.
(31)
As demonstrated in Figure 9, in any scenario, the estima-
tion error for users with highest SNRs is very low. Also, it
should be noted that the estimation error for a user with a
certain S NR is about the same in any users’ power scenar-
ios. For example, the estimation error for users with SNR =
20 dB, in any of the above scenarios, is in the same range of
5 ×10
−3
to 8 × 10
−3
. Similarly, the estimation error for users
with SNR = 38 dB is always in the vicinity of 1 × 10
−3
.In
other words, the estimation error is mainly a function of the
signal-to-noise ratio of each user and the interference from
other users does not have significant impact on it.
6. CONCLUSION
To increase the capacity of DS-CDMA system, employment
of multiuser detection schemes b ecomes essential. Multiuser
detection schemes require s ome knowledge about each ac-
tive user and their relevant parameters. The accurate estimate
and knowledge of the active users and their parameters play a
significant role in the success of a multiuser detection scheme
in canceling multiple access interference. Since MAI is a dy-
namic parameter in a multiuser environment, it is essential
to perform user identification for b etter MAI cancellation
as well as the optimization of the receiver structure. A blind
MUSIC-based approach for user identification and power es-
timation in a multiuser synchronous CDMA environment is
suggested. It is shown that the algorithm is perfectly capable
of blind user identification. The simulation results indicate
the accuracy of the identification and power estimation pro-
cess.
656 EURASIP Journal on Applied Signal Processing
L1 = 500, L2 = 10
0 1020304050607080
Solution index
10
0
10
1
10
2
10
3
1/J
(a)
L1 = 500, L2 = 100
0 1020304050607080
Solution index
10
0
10
1
10
2
10
3
1/J
(b)
L1 = 500, L2 = 1000
0 1020304050607080
Solution index
10
0
10
1
10
2
10
3
1/J
(c)
Figure 8: Effect of L2, the a ccumulation length required for evaluation of the autocorrelation matrix, on the detection process.
SNR = [20 26 29.5 32 34 35.5 36.9 38]
SNR = [2020262632323838]
SNR = [2020202026262626]
SNR = [2020202020202020]
12345678
0
0.001
0.002
0.003
0.004
0.005
0.006
0.007
0.008
0.009
0.01
Estimation error
User index
Figure 9: Users’ power estimation error at different users’ power scenario.
An Algorithm for Blind User Identification in Multiuser CDMA 657
REFERENCES
[1] C M. Chang and K C. Chen, “Joint linear user identification,
timing, phase, and amplitude estimation in DS/CDMA com-
munications,” IEEE Communications Letters, vol. 4, no. 4, pp.
113–115, 2000.
[2] K. W. Halford and M. Brandt-Pearce, “New-user identification
in a CDMA system,” IEEE Trans. Communications, vol. 46, no.
1, pp. 144–155, 1998.
[3] Z. Xu, “Blind identification of co-existing synchronous and
asynchronous users for CDMA systems,” IEEE Signal Processing
Letters, vol. 8, no. 7, pp. 212–214, 2001.
[4] W C. Wu and K C. Chen, “Identification of active users in
synchronous CDMA multiuser detection,” IEEE Journal on Se-
lected Areas in Communications, vol. 16, no. 9, pp. 1723–1735,
1998.
[5] X. Wang and H. V. Poor, “Blind multiuser detection: a subspace
approach,” IEEE Transactions on Information Theory, vol. 44,
no. 2, pp. 677–690, 1998.
[6] S. Roy, “Subspace blind adaptive detection for multiuser
CDMA,” IEEE Trans. Communications, vol. 48, no. 1, pp. 169–
175, 2000.
[7] A. Haghighat and M. R. Soleymani, “A subspace scheme for
blind user identification in multiuser DS-CDMA,” in Proc.
IEEE Wireless Communications and Networking (WCNC ’03),
vol. 1, pp. 688–692, New Orleans, La, USA, March 2003.
Afshin Haghighat received the B.S. de-
gree from KNT University of Technology,
Tehran, Iran, in 1992, and the M.A.Sc. de-
gree from Concordia University, Montreal,
Quebec, Canada, in 1998, all in electrical
engineering. From 1997 to 1998, he was
at SR-Telecom, Montreal, Quebec, Canada,
where he was involved in design and im-
plementation of integrated RF transceivers
for point-to-multipoint applications. Since
October 1998, he has been with HARRIS Corporation, Montreal,
Quebec, Canada, where he is involved in design and development
of signal processing algorithms for digital microwave radios. He is
currently pursuing the Ph.D. degree at Concordia University. His
research interests include multiuser detection techniques and sig-
nal processing for communications.
M. Reza Soleymani received the B.S. de-
gree from the University of Tehran, Tehran,
Iran, in 1976, the M.S. deg ree from San
Jose State University, San Jose, California, in
1977, and the Ph.D. deg ree from Concor-
dia University, Montreal, Quebec, Canada,
in 1987, all in electrical engineering. From
1987 to 1990, he was an Assistant Professor
in the Department of Electrical and Com-
puter Engineering, McGill University, Mon-
treal. From October 1990 to January 1998, he was with Spar
Aerospace Ltd. (currently EMS Technologies Ltd.), Montreal, Que-
bec, Canada, where he had a leading role in the design and develop-
ment of several satellite communication systems. In January 1998,
he joined the Depart ment of Electrical and Computer Engineer-
ing, Concordia University, as an Associate Professor. His current re-
search interests include wireless and satellite communications, in-
formation theory, and coding.