Báo cáo hóa học: " A Noise Reduction Preprocessor for Mobile Voice Communication" doc
Bạn đang xem bản rút gọn của tài liệu. Xem và tải ngay bản đầy đủ của tài liệu tại đây (861.13 KB, 13 trang )
EURASIP Journal on Applied Signal Processing 2004:8, 1046–1058
c
2004 Hindawi Publishing Corporation
A Noise Reduc tion Preprocessor for
Mobile Voice Communication
Rainer Martin
Institute of Communication Acoustics, Ruhr-University Bochum, 44780 Bochum, Germany
Email:
David Malah
Department of Electrical Engineering, Technion – Israel Institute of Technology, Haifa 32000, Israel
Email:
Richard V. Cox
AT&T Labs-Research, 180 Park Avenue, Florham Park, NJ 07932, USA
Email:
Anthony J. Accardi
Tellme Networks, 1310 Villa Avenue, Mountain View, CA 94041, USA
Email:
Received 15 September 2003; Revised 20 November 2003; Recommended for Publication by Piet Sommen
We describe a speech enhancement algorithm which leads to significant quality and intelligibility improvements when used as
a preprocessor to a low bit rate speech coder. This algorithm was developed in conjunction with the mixed excitation linear
prediction (MELP) coder which, by itself, is highly susceptible to environmental noise. The paper presents novel as well as known
speech and noise estimation techniques and combines them into a highly effective speech enhancement system. The algorithm
is based on short-time spectral amplitude estimation, soft-decision gain modification, tracking of the a priori probability of
speech absence, and minimum statistics noise power estimation. Special emphasis is placed on enhancing the perfor mance of
the preprocessor in nonstationary noise environments.
Keywords and phrases: speech enhancement, noise reduction, speech coding, spectral analysis-synthesis, minimum statistics.
1. INTRODUCTION
With the advent and wide dissemination of mobile voice
communication systems, telephone conversations are in-
creasingly disturbed by environmental noise. This is espe-
cially true in hands-free environments where the micro-
phone is far away from the speech source. As a result, the
quality and intelligibility of the transmitted speech can be
significantly degraded and fail to meet the expectations of
mobile phone users. The environmental noise problem be-
comesevenmorepronouncedwhenlowbitratecodersare
used in harsh acoustic environments. An example is the
mixed excitation linear prediction (MELP) coder which op-
erates at bit rates of 1.2 and 2.4 kbps. It is used for secure gov-
ernmental communications and has been selected as the fu-
ture NATO narrow-band voice coder [1]. In contrast to wave-
form approximating coders, low bit rate coders transmit pa-
rameters of a speech production model instead of the quan-
tized acoustic waveform itself. Thus, low bit rate coders are
more susceptible to a mismatch of the input signal and the
underlying signal model.
It is well known that single microphone speech enhance-
ment algorithms improve the quality of noisy speech when
the noise is fairly stationary. However, they typically do not
improve the intelligibilit y when the enhanced signal is pre-
sented directly to a human listener. The loss of intelligibil-
ity is mostly a result of the distortions introduced into the
speech signal by the noise reduction preprocessor. However,
the picture changes when the enhanced speech signal is pro-
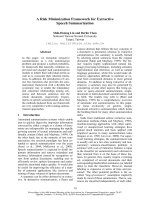
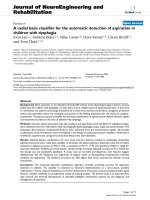
cessed by a low bit rate speech coder as shown in Figure 1.
In this case, a speech enhancement preprocessor can signifi-
cantly improve quality as well as intelligibility [2]. Therefore,
the noise reduction preprocessor should be an integral com-
ponent of the low bit rate sp eech communication system.
Although many speech enhancement algorithms have
been developed over the last two decades, such as Wiener and
A Noise Reduction Preprocessor for Mobile Voice Communication 1047
x
d
Noise reduction
preprocessor
Speech
encoder
Transmission
channel
Speech
decoder
y
Noise robust speech encoder
Figure 1: Speech communication system with noise reduction preprocessing.
y(n)
Analysis
Windowing
DFT
Synthesis
ˆ
x(n)
Overlap-add
IDFT
Noise PSD
estimation
VAD and long-term
SNR estimation
Tracking of the
a priori probability
of speech absence
Estimation of
clean speech
coefficients
AposterioriSNR
estimation
AprioriSNR
estimation
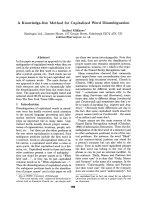
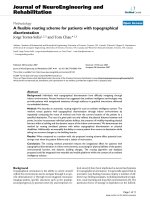
Figure 2: Block diagram of speech enhancement preprocessor.
power-subtraction methods [3], maximum likelihood (ML)
[4], minimum mean squared error (MMSE) [5, 6], and oth-
ers [7, 8], improvements are still sought. In particular, since
mobile voice communication systems frequently operate in
nonstationary noise environments, such as inside moving ve-
hicles, effective suppression of nonstationary noise is of vital
importance. While most existing enhancement algorithms
assume that the spectral characteristics of the noise change
very slowly compared to those of the speech, this may not
be true when communicating from a moving vehicle. Under
such circumstances the noise may change appreciably during
speech activity, and so confining the noise spectrum updates
to periods of speech absence may adversely affect the perfor-
mance of the speech enhancement algorithm. To maximize
enhancement performance, the noise characteristics should
be tracked even during speech.
Most common enhancement techniques, including those
cited above, operate in the frequency domain. These tech-
niques apply a frequency-dependent gain function to the
spectral components of the noisy signal, in an attempt to at-
tenuate the noisier components to a greater degree. The gains
applied are typically nonlinear functions of estimated signal
and noise powers at each frequency. These functions are usu-
ally derived by either estimating the clean speech (e.g., the
Wiener approach) or its spectral magnitude according to a
specific optimization criterion (e.g., ML, M MSE). The noise-
suppression properties of these enhancement algorithms
have been shown to improve when a soft-decision modifica-
tion of the gain function, which takes speech-presence uncer-
tainty into account, is introduced [4, 5, 7, 9]. To implement
such a gain modification function, one must provide a value
to the a priori probability of speech absence for each spectral
component of the noisy signal. Therefore, we use the algo-
rithm in [9] to estimate the a priori probability of speech ab-
sence as a function of frequency, on a frame-by-frame basis.
The objective of this paper is to describe a single mi-
crophone speech enhancement preprocessor which has been
developed for voice communication in nonstationary noise
environments with high quality and intelligibility require-
ments. Recently, this preprocessor has been proposed as an
optional part of the future NATO narrow-band voice coder
standard (also known as the MELPe coder [1]) and, in a
slightly modified form, in conjunction with one of the ITU-
T 4 kbps coder [10] proposals. The improvements we obtain
with this system result from a synergy of several carefully de-
signed system components. Significant contributions to the
overall performance stem from a novel procedure for esti-
mating the a priori probability of speech absence, and from
a noise power spectral density (PSD) estimation algorithm
with small error variance and good tracking properties.
A block diagram of the algorithm is shown in Figure 2.
Spectral analysis consists of applying a window and the DFT.
Spectral synthesis inverts the analysis with the IDFT and
overlap-adding consecutive frames. The algorithm includes
1048 EURASIP Journal on Applied Signal Processing
an MMSE estimator for the spectral amplitudes, a procedure
for estimating the noise PSD, the long-term signal-to-noise
ratio(SNR),andtheaprioriSNR,aswellasamechanismfor
the tracking of the a priori probability of speech absence. The
spectral estimation procedure attenuates frequency compo-
nents which contain primarily noise and passes those which
contain mostly speech. As a result, the overall SNR of the pro-
cessed speech signal is improved.
In the remainder of this paper we describe this algorithm
in detail and evaluate its performance. In Section 2 we dis-
cuss windows for DFT-based spectral analysis and synthesis
as well as the algorithmic delay of the joint enhancement and
coding system. Sections 3, 4,and5 present estimation proce-
dures for the spectral coefficients and the long-term SNR. We
outline the noise estimation algorithm [11]inSection 6,and
summarize listening test results in Section 7. Section 8 con-
cludes the paper. We reiterate that some components have
been previously published [6, 9, 11, 12].Ourgoalhereis
to tie all required components together, thereby providing a
comprehensive description of the MELPe enhancement sys-
tem.
2. SPECTRAL ANALYSIS AND SYNTHESIS
Assuming an additive, independent noise model, the noisy
signal y(n)isgivenbyx(n)+d(n), where x(n) denotes the
clean speech signal, and d(n) the noise. All signals are sam-
pled at a sampling rate of f
s
. We apply a short-time Fourier
analysis to the input signal by computing the DFT of each
overlapping windowed frame,
Y(k, m) =
L−1
=0
y
mM
E
+
h()e
−j2πk/L
. (1)
Here, M
E
denotes the frame shift, m ∈ Z is the frame index,
k ∈{0, 1, , L − 1} is the frequency bin index, which is re-
lated to the normalized center frequency Ω
k
= k2π/L,and
h() denotes the window function. Typical implementations
of DFT-based noise reduction algor ithms use a Hann win-
dow with a 50% overlap (M
E
/L = 0.5) or a Hamming win-
dow with a 75% overlap (M
E
/L = 0.25) for spectral analysis,
and a rectangular window for synthesis.
When no confusion is possible, we drop the frame index
m and write the frequency index k as a subscript. Thus, for a
given frame m we have
Y(k, m) = X(k, m)+D(k, m)orY
k
= X
k
+ D
k
,(2)
where X
k
and Y
k
are characterized by their amplitudes A
k
and R
k
and their phases ϕ
k
and θ
k
,respectively,
X
k
= A
k
exp
jϕ
k
,
Y
k
= R
k
exp
jθ
k
.
(3)
In the gain function derivations cited below, it is assumed
that the DFT coefficients of both the speech and the noise
are independent Gaussian random variables.
Preprocessor
frames
L
M
O
Coder
frames
M
C
∆
E
Time
Figure 3: Frame alignment of enhancement preprocessor and
speech coder with M
E
= M
C
.
The segmentation of the input signal into frames and
the selection of an analysis window is closely linked to the
frame alignment of the speech coder [12] and the admis-
sible algorithmic delay. The analysis/synthesis system must
balance conflicting requirements of sufficient spectral resolu-
tion, little spectral leakage, smooth transitions between sig-
nal frames, low delay, and low complexity. Delay and com-
plexity constraints limit the overlap of the signal frames.
However, the frame advancement must not be too aggres-
sive so as to degrade the enhanced signal’s quality. When the
frame overlap is less than 50%, we obtain good results with a
flat-top (Tukey) analysis window and a rectangular synthesis
window.
The total algorithmic delay of the joint enhancement and
coding system is minimized wh en the frame shift of the noise
reduction preprocessor is adjusted such that l(L − M
O
) =
lM
E
= M
C
,withl ∈ N and where M
C
and M
O
denote the
frame length of the speech coder and the length of the over-
lapping portions of the preprocessor frames, respectively.
This situation is depicted in Figure 3.
The additional delay ∆
E
, due to the enhancement pre-
processor, is equal to M
O
. For the MELP coder and its frame
length of M
C
= 180, we use an FFT length of L = 256 and
have M
O
= 76 overlapping samples between adjacent signal
frames.
Reducing the number of overlapping samples M
O
,and
thus the delay of the joint system, has several effects. First,
with a flat-top analysis window, this decreases the sidelobe
attenuation during spectral analysis, which leads to increased
crosstalk between frequency bins that might complicate the
speech enhancement task. Most enhancement algorithms as-
sume that adjacent frequency bins are independent and do
not exploit correlation between bins. Second, as the over-
lap between frames is reduced, transitions between adjacent
frames of the enhanced signal become less smooth. Discon-
tinuities arise because the analysis window attenuates the in-
put signal most at the ends of a frame, while estimation er-
rors, which occur during the processing of the frame in the
spectral domain, tend to spread evenly over the whole frame.
This leads to larger relative estimation errors at the frame
ends. The resulting discontinuities, which are most notable
in low SNR conditions, may lead to pitch estimation errors
and other speech coder artifacts.
These discontinuities are greatly reduced if we use a ta-
peredwindowforspectralsynthesisaswellasoneforspectral
A Noise Reduction Preprocessor for Mobile Voice Communication 1049
analysis [12]. We found that a tapered synthesis window is
beneficial when the overlap M
O
is less than 40% of the DFT
length L. In this case, the square root of the Tukey window
h(n)
=
0.5
1 − cos
πn
M
O
,1≤ n ≤ M
O
,
1, M
O
+1≤n≤L−M
O
−1,
0.5
1 − cos
π(L − n)
M
O
, L − M
O
≤ n ≤ L,
(4)
can be used as an analysis and synthesis window. It results in
a perfect reconstruction system if the signal is not modified
between analysis and synthesis. Note that the use of a tapered
synthesis window is also in line with the results of Griffin
and Lim [13] for the MMSE reconstruction of modified short
time spectra.
3. ESTIMATION OF SPEECH SPECTRAL COEFFICIENTS
Let C
k
be some function of the short-time spectral amplitude
A
k
of the clean speech in the kth bin (e.g., A
k
,logA
k
, A
2
k
).
Taking the uncertainty of speech presence into account, the
MMSE estimator
C
k
of C
k
is given by [4]
C
k
= E
C
k
Y
k
, H
k
1
P
H
k
1
Y
k
+ E
C
k
Y
k
, H
k
0
P
H
k
0
Y
k
,
(5)
where H
k
0
and H
k
1
represent the following hypotheses:
(i) H
k
0
: speech absent in kth DFT bin,
(ii) H
k
1
: speech present in kth DFT bin,
and E{·|·} and P(·|·) denote conditional expectations and
conditional probabilites, respectively. Since E{C
k
|Y
k
, H
k
0
}=
0, we have
C
k
= E
C
k
Y
k
, H
k
1
P
H
k
1
Y
k
. (6)
P(H
k
1
|Y
k
) is thus the soft-decision modification of the opti-
mal estimator under the signal presence hypothesis.
Applying Bayes’ rule, one obtains [4, 5]
P
H
k
1
Y
k
=
p
Y
k
H
k
1
P
H
k
1
p
Y
k
H
k
0
P
H
k
0
+ p
Y
k
H
k
1
P
H
k
1
=
Λ
k
1+Λ
k
G
M
(k),
(7)
where p(
·|·) represents conditional probability densities,
and
Λ
k
µ
k
p
Y
k
H
k
1
p
Y
k
H
k
0
, µ
k
P
H
k
1
P
H
k
0
=
1 − q
k
q
k
. (8)
Λ
k
is a generalized likelihood ratio and q
k
denotes the a
priori probability of speech absence in the kth bin.
C
k
is then used to find an estimate of the clean signal
spectral amplitude A
k
.IfC
k
= A
k
, as for the MMSE am-
plitude estimator, one gets [5]
ˆ
A
SA
(k) = G
M
(k)G
SA
(k)R
k
,(9)
where,
ˆ
A
SA
(k) is the MMSE estimator of A
k
that takes into
account speech presence uncertainty and, according to (6)
and (7), G
M
(k) is the modification function of G
SA
(k) =
E{A
k
|Y
k
, H
k
1
}/R
k
. The derivation of G
SA
(k)canbefoundin
[5].
3.1. MMSE-LSA and MM-LSA estimators
Based on the results reported in [6], we prefer using the
MMSE-LSA estimator (corresponding to C
k
= log A
k
)over
the MMSE-STSA (C
k
= A
k
) estimator [5], as the basic en-
hancement algorithm. In this case the amplitude estimator
has the form
ˆ
A
LSA
(k) = exp
E
log A
k
Y
k
, H
k
1
G
M
(k)
G
LSA
(k)R
k
G
M
(k)
,
(10)
where, again, G
M
(k) is the gain modification function de-
fined in (7) and satisfies, of course, 0 ≤ G
M
(k) ≤ 1. Be-
cause the soft-decision modification of R
k
in ( 10)isnotmul-
tiplicative and does not result in a meaningful improvement
over using G
LSA
(k) alone [6], we choose to use the following
estimator, which is called the multiplicatively modified LSA
(MM-LSA) estimator [9]:
ˆ
A
L
(k) = G
M
(k)G
LSA
(k)R
k
G
L
(k)R
k
. (11)
It should be mentioned that in [14, 15] the second term in
(5) is not zeroed out, as we did in arriving at (6), but is
rather constrained in such a way that (10)canbereplacedby
[G
LSA
(k)R
k
]
G
M
(k)
[G
min
R
k
]
1−G
M
(k)
,whereG
min
is a threshold
gain value [14, 15]. This way, one gets an exact multiplica-
tive modification of R
k
, by replacing the expression for G
L
(k)
in (11)withG
LSA
(k)
G
M
(k)
G
1−G
M
(k)
min
. Since the computation of
G
L
(k) according to (11) is simpler, and gives close results for
awiderangeofpracticalSNRvalues[15], we prefer to con-
tinue with (11).
Under the above assumptions on speech and noise, the
gain function G
LSA
(k)isderivedin[6]tobe
G
LSA
ξ
k
, γ
k
=
ξ
k
1+ξ
k
exp
1
2
∞
v
k
e
−t
t
dt
, (12)
where,
v
k
ξ
k
1+ξ
k
γ
k
, γ
k
R
2
k
λ
d
(k)
,
ξ
k
η
k
1 − q
k
, η
k
λ
x
(k)
λ
d
(k)
,
λ
x
(k) E
X
k
2
= E
A
2
k
, λ
d
(k) E
D
k
2
.
(13)
In [6], γ
k
is called the a posteriori SNR for bin k, η
k
is called
1050 EURASIP Journal on Applied Signal Processing
the a priori SNR, and q
k
is the prior probability of speech
absence discussed earlier (see ( 7)).
With the above definitions, the expression for Λ
k
in ( 7)is
given by [5]
Λ
k
= µ
k
exp
v
k
1+ξ
k
ξ
k
=η
k
/(1−q
k
)
. (14)
In order to evaluate these gain functions, one must first esti-
mate the noise p ower spectrum λ
d
. This is often done during
periods of speech absence as determined by a voice activity
detector (VAD), or, as we will show below using the mini-
mum statistics [11] approach. The estimated noise spectrum
and the squared input amplitude R
2
k
provide an estimate for
the a posteriori SNR. In [5, 6], a decision-directed approach
for estimating the a priori SNR is proposed:
ˆ
η
k
(m) = α
η
ˆ
A
2
(k, m)
λ
d
(k, m −1)
+
1 − α
η
max
γ(k, m) − 1
,0
,
(15)
where 0 ≤ α
η
≤ 1.
An important property of both the MMSE-STSA [5]and
the MMSE-LSA [6] enhancement algorithms is that they
do not produce musical noise [16] that plagues many other
frequency-domain algorithms. This can be attributed to the
above decision-directed estimation method for the a priori
SNR [16]. To improve the perceived performance of the es-
timator, [16] recommends imposing a lower limit η
MIN
on
the estimated η
k
, analogous to the use of a “spectral floor”
in [17]. This lower limit depends on the overall SNR of the
noisy speech and may be adaptively adjusted as outlined in
Section 5. The parameter α
η
in (15)providesatrade-off be-
tween noise reduction and signal distortion. Typical values
for α
η
range between 0.90 and 0.99, where at the lower end
one obtains less noise reduction but also less speech distor-
tion.
Before we consider the estimation of the prior probabili-
ties, we mention that in order to reduce computational com-
plexity, the exponential integral in (12)maybeevaluatedus-
ing the functional approximation below instead of iterative
solutions or tables. Thus, to approximate
ei(v)
∞
v
e
−t
t
dt, (16)
we use
˜
ei(v)
=
−
2.31 log
10
(v) − 0.6forv<0.1,
−1.544 log
10
(v)+0.166 for 0.1 ≤ v ≤ 1,
10
−(0.52v+0.26)
for v>1.
(17)
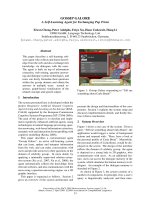
Since in (12) we need exp(0.5ei(v)), we show this func-
tion (solid line) alongside its approximation (dashed line) in
Figure 4. For the present purpose this approximation is more
than adequate.
3.2. Estimation of prior probabilities
A key feature of our speech enhancement algorithm is the es-
timation of the set of prior probabilities {q
k
}required in (12)
10
3
10
2
10
1
10
0
exp(0.5ei(v))
10
−4
10
−2
10
0
v
Exact
Approximation
Figure 4: An approximation of exp(0.5ei(v)) using the approxima-
tion for ei(v)in(17).
and (14), where k is the frequency bin index. Our first ob-
jectiveistoestimateafixedq (i.e., a frequency-independent
value) for each fr ame that contains speech. The basic idea is
to estimate the relative number of frequency bins that do not
contain speech and use a short time average of this statistic
as an estimate for q. Due to this averaging, the estimated q
will vary in time and will serve as a control parameter in the
above gain expressions.
The absence of speech energy in the kth bin clearly cor-
responds to η
k
= 0. However, since the analysis is done with
a finite length window, we can expect some leakage of energy
from other bins. In addition, the human ear is unable to de-
tect signal presence in a bin if the SNR is below a certain level
η
min
. In general, η
min
can vary in frequency and should be
chosen in accordance with a perceptual masking model. Here
we choose a constant η
min
for all the frequency bins, and set
its value to the minimum level, η
MIN
, that the estimate
ˆ
η in
(15) is allowed to attain. The values used in our work ranged
between 0.1 and 0.2. It is interesting to note that the use of
a lower threshold on the a priori SNR has a similar effect to
constraining the gain, when speech is absent, to some G
min
,
which is the basis for the derivation of the gain function in
[14, 15].
Due to the nonlinearity of the estimator for η
k
in (15),
there is a “locking” phenomenon to η
MIN
when the speech
signal level is low. Hence, one could consider using η
MIN
as
a threshold value to which
ˆ
η
k
is compared in order to decide
whether or not speech is present in bin k.However,ourat-
tempt to use this threshold resulted in excessively high counts
of noise-only bins, leading to high values of q (i.e., closer to
one). This is easily noticed in the enhanced signal which suf-
fers from an over-aggressive attenuation by the gain modifi-
cation func tion G
M
(k).
A Noise Reduction Preprocessor for Mobile Voice Communication 1051
We therefore turn our attention to the a posteriori SNR,
γ
k
,definedin(12) and determined directly from the squared
amplitude R
2
k
, once an estimate for noise spectrum λ
d
(k)
is given. Assuming that the DFT coefficients of the speech
and noise are independent Gaussian random variables, the
pdf of γ
k
for a given value of the a priori SNR, η
k
,isgiven
by [5]
p
γ
k
=
1
1+η
k
exp
−
γ
k
1+η
k
, γ
k
≥ 0. (18)
To decide whether speech is present in the kth bin (in the
sense that the true η
k
hasavaluelargerorequaltoη
min
), we
consider the following composite hypotheses:
(H
0
) η
k
≥ η
min
(speech present in kth bin),
(H
A
) η
k
<η
min
(speech absent in kth bin).
We have chosen the null hypothesis (H
0
) as stated above since
its rejection when true is more grave than the alternative er-
ror of accepting when false. This is because the first t ype of
error corresponds to deciding that speech is absent in the bin
when it is actually present. Making this error would increase
the estimated value of q, which would have a worse effect on
the enhanced speech than if the value of q is under-estimated.
Since η
k
parameterizes the pdf of γ
k
, as shown in (18), γ
k
can
be used as a test statistic. In particular, since the likelihood ra-
tios that correspond to simple alternatives to the above two
hypotheses
p
γ
k
η
k
= η
min
p
γ
k
η
k
= η
a
k
, (19)
for any η
a
k
<η
min
, are monotonic functions in γ
k
(for γ
k
>
0 and any chosen η
min
> 0), it can be shown [18] that the
likelihood ratio test for the following decision between two
simple hypotheses is a uniformly most powerful test for our
original problem:
(H
0
) η
k
= η
min
,
(H
A
) η
k
= η
a
k
; η
a
k
<η
min
.
This gives the test
γ
k
H
0
>
<
H
A
γ
TH
, (20)
where γ
TH
is set to satisfy a desired significance level [19](or
size [18]) α
0
of the test. That is, α
0
is the probability of reject-
ing (H
0
) when true, and is therefore
α
0
=
γ
TH
0
p
γ
k
η
k
= η
min
dγ
k
. (21)
Substituting the pdf of γ
k
from (18), we obtain
γ
TH
=
1+η
min
log
1
1 − α
0
. (22)
Let M be the number of positive frequency bins to con-
sider. Typically, M = (L/2) + 1, where L is the DFT trans-
form size. However, if the input speech is limited to a nar-
rower band, M should be chosen accordingly. Let N
q
(m)be
the number of bins out of the M examined bins in frame m
for which the test in (20) results in the rejection of hypothe-
sis (H
0
). With r
q
(m) N
q
(m)/M, the proposed estimate for
q(m) is formed by recursively smoothing r
q
(m)intime:
ˆ
q(m) = α
q
ˆ
q(m − 1) +
1 − α
q
r
q
(m). (23)
The smoothing in (23) is performed only for frames which
contain speech (as determined from a VAD). We selected the
parameters based on informal listening tests. We noticed im-
proved performance with α
0
= 0.5 ( giving γ
TH
= 0.8in(22))
and α
q
= 0.95 in (23).
Yet, as discussed earlier, a better gain modification could
be expected if we allow different q’s in different bins. Let
I(k, m) be an index function that denotes the result of the
test in (20), in the kth bin of frame m. That is, I(k, m) = 1if
(H
0
)isrejected,andI(k, m) = 0ifitisaccepted.Wesuggest
the fol l owing estimator for q(k, m):
ˆ
q(k, m) = α
q
ˆ
q(k, m − 1) +
1 − α
q
I(k, m). (24)
The same settings for γ
TH
and α
q
above are appropriate here
also. This way, averaging
ˆ
q(k, m)overk in frame m results in
the
ˆ
q(m)of(23).
4. VOICE ACTIVITY DETECTION AND LONG-TERM
SNR ESTIMATION
The noise power estimation algorithm described in Section 6
does not rely on a VAD and therefore need not deal with
detection errors. Nevertheless, it is beneficial to have a VAD
available for controlling certain aspects of the preprocessor.
In our algorithm we use VAD decisions to control estimates
of the a priori probability of speech absence and of the long-
term SNR. We briefly describe our delayed decision VA D a nd
the long-term SNR estimation.
As in [7] (see also [20]), we have found that the mean
value
¯
γ of γ
k
(averaged over all frequency bins in a given
frame), is useful for indicating voice activity in each frame.
For stationary noise and independent DFT coefficients,
¯
γ is
approximately normal with mean 1 and standard deviation
σ
¯
γ
=
√
1/M (for sufficiently large M, which is usually the
case). Thus, by comparing
¯
γ to a suitable fixed threshold, one
can obtain a reliable VAD—as long as the short-time noise
spectrum does not change too fast. Typically, we use thresh-
old values
¯
γ
th
in the range between 1.35 and 2, where the
lower value, which we denote by
¯
γ
min
th
, corresponds to 1 + 4σ
¯
γ
for M = L/2 + 1 with a transform size of L = 256 (32-
millisecond window). We found this value suitable for sta-
tionary noise at input SNR values down to 3 dB. The higher
threshold value allows for larger fluctuations of
¯
γ (as ex-
pected if the noise is nonstationarity) without causing a de-
cision error in noise-only frames, but may result in misclas-
sification of weak speech signals as noise, particularly at SNR
1052 EURASIP Journal on Applied Signal Processing
values below 10 dB. We may further improve the VAD de-
cision by considering the maximum of γ
k
, k = 0, , M,
and the average frame SNR. We declare a speech pause if
¯
γ<
¯
γ
th
,max
k
(γ
k
) <γ
max-th
,andmean(η(k, m)) < 2
¯
γ
th
,where
γ
max-th
≈ 25
¯
γ
th
. Finally, we require a consistent VAD decision
for at least two consecutive frames before taking action.
The long term sig nal-to-noise ratio SNR
LT
(m) character-
izes the SNR of the noisy input speech averaged over periods
of one to two seconds. It is used for the adaptive limiting of
the a priori SNR and the adaptive smoothing of the signal
power, as outlined b elow. The computation of SNR
LT
(m)re-
quires a VAD since the average speech power can be updated
only if speech is present. The signal power is computed using
a first-order recursive system update on the average frame
power with time constant T
LT
:
λ
y
(m) = α
LT
λ
y
(m − 1)
+
1 − α
LT
1
M +1
M
k=0
R
2
(k, m),
(25)
where α
LT
≈ 1 − M
E
/(T
LT
f
s
). SNR
LT
(m) is then given by
SNR
LT
(m) =
(M +1)λ
y
(m)
M
k=0
λ
d
(k, m)
− 1. (26)
If SNR
LT
(m) is smaller than zero, it is set equal to SNR
LT
(m−
1), the estimated long-term SNR of the previous frame.
5. ADAPTIVE LIMITING OF THE A PRIORI SNR
After applying the noise reduction preprocessor described so
far to the MELP coder, we found that most of the degrada-
tions in quality and intelligibility that we witnessed were due
to errors in estimating the sp ectral parameters in the coder.
In this section, we present a modified spectral weighting rule
which allows for better spectral parameter reproduction in
the MELP coder, where linear predictive coefficients (LPC) are
transformed into line spectral frequencies (LSF). We use an
adaptive limiting procedure on the spectral gain factors ap-
plied to each DFT coefficient. We note that while spectral val-
leys in between formant frequencies are not important for
speech perception (and thus can be filled with noise to give a
better auditory impression), they are important for LPC esti-
mation.
It was stressed in [9, 16] that in order to avoid structured
“musical” residual noise and achieve good audio quality, the
aprioriSNRestimate
ˆ
η
k
should be limited to values between
0.1 and 0.2. This means that less signal attenuation is applied
to bins with low SNR in the spectral valleys between for-
mants. By limiting the attenuation, we largely avoid the an-
noying “musical” distortions and the residual noise appears
very natural. However, this attenuation distorts the overall
spectral shape of speech sounds, which impacts the spectral
parameter estimation. One solution to this problem is the
adaptive limiting scheme we outline below.
We utilize the VAD to distinguish between speech-and-
noise and noise-only signal frames. Whenever we detect
pauses in speech, we set a preliminary lower limit for the a
priori SNR estimate in the mth frame to η
MIN 1
(m) = η
min P
(typically, η
min P
= 0.15) in order to achieve a smooth resid-
ual noise. During speech activity, the lower limit η
MIN 1
(m)is
set to
η
MIN 1
(m) = η
min P
0.0067
0.5+SNR
LT
(m)
0.65
(27)
and is limited to a maximum of 0.25. We obtained (27)by
fitting a function to data from listening tests using several
long-term SNR values. We then smooth this result using a
first-order recursive system,
η
MIN
(m) = 0.9η
MIN
(m − 1) + 0.1η
MIN 1
(m), (28)
to obtain smooth transitions between active and pause seg-
ments. We use the resulting η
MIN
as a lower limit for
ˆ
η
k
.The
enhanced speech sounds appear to be less noisy when us-
ing the adaptive limiting procedure, while at the same time
the background noise during speech pauses is very smooth
and natural. This method was also found to be effective in
conjunction with other speech coders. A slightly different dy-
namic lower limit optimized for the 3GPP AMR coder [21]
is given in [22].
6. NOISE POWER SPECTRAL DENSITY ESTIMATION
The importance of an accurate noise PSD estimate can be
easily demonstrated in a computer simulation by estimating
it directly from the isolated noise source. In fact, it turns out
that many of the annoying artifacts in the processed signal
are due to errors in the noise PSD estimate. It is therefore of
paramount impor tance both to estimate the noise PSD with
a small error variance and to effectively track nonstationary
noise. This requires a careful balance between the degree of
smoothing and the noise tracking rate.
A common approach is to use a VAD and to update the
estimated noise PSD during speech pauses. Since the noise
PSD might also fluctuate during speech activity, VAD-based
methods do not work satisfactorily when the noise is nonsta-
tionary or when the SNR is low. Soft-decision update strate-
gies which take the probability of speech presence in each fre-
quency bin into account [9, 20] allow us to also update the
noise PSD during speech activity, for example, in between
the formants of the speech spectrum or in between the pitch
peaks during voiced speech.
The approach we present here is based on the minimum
statistics method [11, 23] which is very robust, even for low
SNR conditions. The minimum statistics approach assumes
that speech and noise are statistically independent and that
the spectral characteristics of speech vary faster in time than
those of the noise. During both speech pauses and speech
activity, the PSD of the noisy signal frequently decays to the
level of the noise. The noise floor can therefore be estimated
by tracking spectral minima within a finite time window
without relying on a VAD decision. The noise PSD can be up-
dated during speech activity, just as with soft-decision meth-
ods. An important feature of the minimum statistics method
A Noise Reduction Preprocessor for Mobile Voice Communication 1053
is its use of an optimally smoothed power estimate which
provides a balance between the error variance and effective
tracking properties.
6.1. Adaptive optimal short-term smoothing
To derive an optimal smoothing procedure for the PSD of
the noisy signal, we assume a pause in speech and consider
a first-order smoothing recursion for the short-term power
of the DFT coefficients Y(k, m) of the mth frame (1), us-
ing a time- and frequency-dependent smoothing parameter
α(k, m):
λ
y
(k, m +1)= α( k, m)
λ
y
(k, m)
+
1 − α(k, m)
Y(k, m)
2
.
(29)
Since we want
λ
y
(k, m) to be as close as possible to the true
noise PSD λ
d
(k, m), our objective is to minimize the condi-
tional mean squared error
E
λ
y
(k, m +1)− λ
d
(k, m)
2
λ
y
(k, m)
(30)
from one frame to the next. After substituting (29)for
λ
y
(k, m +1)in(30) and using E{|Y(k, m)|
2
}=λ
d
(k, m)and
E{|Y(k, m)|
4
}=2λ
2
d
(k, m), the mean squared error is given
by
E
λ
y
(k, m +1)− λ
d
(k, m)
2
λ
y
(k, m)
= α
2
(k, m)
λ
y
(k, m) − λ
d
(k, m)
2
+ λ
2
d
(k, m)
1 − α(k, m)
2
,
(31)
where we also assumed the statistical independence of suc-
cessive signal frames. Setting the first derivative with respect
to α(k, m) to zero yields
α
opt
(k, m) =
1
1+
λ
y
(k, m)/λ
d
(k, m) − 1
2
, (32)
and the second derivative, being nonnegative, reveals that
this is indeed a minimum. The term
λ
y
(k, m)/λ
d
(k, m) =
γ(k, m) on the right hand side of (32) is a smoothed version
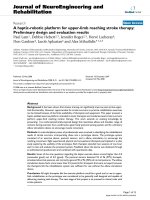
of the a posteriori SNR. Figure 5 plots the optimal smooth-
ing parameter α
opt
for 0 ≤ γ ≤ 10. This parameter is be-
tween zero and one, thus guaranteeing a stable and nonneg-
ative noise power estimate
λ
y
(k, m).
Assuming a pause in speech in the above derivation does
not pose any major problems. The optimal smoothing pro-
cedure reacts to speech a ctivity in the same way as to highly
nonstationary noise. During speech activity, the smoothing
parameter is small, allowing the PSD estimate to closely fol-
low the time-varying PSD of the noisy speech signal.
To compute the optimal smoothing parameter in (32),
we replace the t rue noise PSD λ
d
(k, m) with an estimate
λ
d
(k, m). However, since the estimated noise PSD may be
either too small or too large, we have to take special pre-
1
0.8
0.6
0.4
0.2
0
α
opt
0246810
γ
Figure 5: Optimal smoothing parameter α
opt
as a function of the
smoothed a posteriori SNR γ(k, m).
cautions. If the computed smoothing parameter is smaller
than the optimal value, the smoothed PSD estimate
λ
y
(k, m)
will have an increased variance. This is not a problem if the
noise estimator is unbiased, since the smoothed PSD will still
track the true signal PSD, and the estimated noise PSD w ill
eventually converge to the true noise PSD. However, if the
computed smoothing parameter is too large, the smoothed
power will not accurately track the true signal PSD, leading
to noise PSD estimation errors. We therefore introduce an
additional factor α
c
(m) in the numerator of the smoothing
parameter which decreases whenever deviations between the
average smoothed PSD estimate and the average signal power
are detected. Now the smoothing parameter has the form
α(k, m) =
α
c
(m)
1+
λ
y
(k, m)/
λ
d
(k, m) − 1
2
, (33)
where
α
c
(m) = c
max
α
c
(m−1) +
1−c
max
max
α
c
(m), 0.7
, (34)
α
c
(m) =
α
max
1+
L−1
k=0
λ
y
(k, m)/
L−1
k=0
Y(k, m)
2
− 1
2
. (35)
α
max
is a constant smaller than but close to 1 and prevents the
freezing of the PSD estimator. c
max
does not appear to be a
sensitive parameter and was set to 0.7. Equation (35)ensures
that the average smoothed power of the noisy signal cannot
deviate by a large factor from the power of the cur rent frame.
The ratio of powers Ξ =
L−1
k=0
λ
y
(k, m)/
L−1
k=0
|Y(k, m)|
2
in
(35) is evaluated in terms of the soft weighting function
α
max
/(1 + (Ξ − 1)
2
), which we found very suitable for this
purpose [11].
To improve the performance of the noise estimator in
nonstationary noise environments, we found it necessary to
also apply a lower limit α
min
to α(k, m). Since α
min
limits the
1054 EURASIP Journal on Applied Signal Processing
rise and decay times of
λ
y
(k, m), this lower limit is a func-
tion of the overall SNR of the speech sample. To avoid at-
tenuating weak consonants at the end of a word we require
λ
y
(k, m) to decay from its peak values to the noise level in
about ∆T = 64 ms. Therefore, α
min
can be computed as
α
min
= SNR
−M
E
/∆ Tf
s
LT
. (36)
6.2. The minimum tracking algorithm
If
λ
min
(k, m) denotes the minimum of D consecutive PSD es-
timates
λ
y
(k, ), = m −D +1, , m, an unbiased estimator
of the noise PSD λ
d
(k, m)isgivenby
λ
d
(k, m) = B
min
D, Q(k, m)
λ
min
(k, m), (37)
where the bias compensation factor B
min
(D, Q(k, m)) can be
approximated by [11, 23]
B
min
(k, m) ≈ 1+(D − 1)
2
1 − M(D)
Q(k, m) − 2M(D)
. (38)
M(D) is approximated by
M(D) = 0.025 + 0.23
1+log(D)
0.8
+2.7 · 10
−6
D
2
− 1.14 · 10
−3
D − 7 · 10
−2
.
(39)
The unbiased estimator requires the knowledge of the
degrees of freedom Q(k, m) of the smoothed PSD estimate
λ
y
(k, m) at any given time and frequency index. In our con-
text, Q(k, m) can attain noninteger values since the PSD
is obtained via recursive smoothing and consecutive sig-
nal frames might be correlated. Since the variance of the
smoothed PSD estimate
λ
y
(k, m) is inversely proportional to
Q(k, m), we compute 1/Q(k, m)as
1
Q(k, m)
=
var
λ
y
(k, m)
2λ
2
d
(k, m)
, (40)
which then allows us to approximate B
min
(D, Q(k, m)) via
(38).
To compute the variance of the smoothed PSD estimate
λ
y
(k, m), we estimate the first and the second moments,
E{
λ
y
(k, m)} and E{
λ
2
y
(k, m)},of
λ
y
(k, m) by means of first-
order recursive systems,
P(k, m +1)= β(k, m)P( k, m)+
1 − β(k, m)
λ
y
(k, m +1),
P
2
(k, m +1)= β(k, m)P
2
(k, m)+
1 − β(k, m)
λ
2
y
(k, m +1),
var
λ
y
(k, m)
=
P
2
(k, m) − P
2
(k, m).
(41)
We choose β(k, m) = α
2
(k, m) and limit β(k, m) below 0.8.
Finally, we estimate 1/Q(k, m)by
1
Q(k, m)
≈
var
λ
y
(k, m)
2
λ
2
d
(k, m)
(42)
and limit this estimate below 0.5. This limit corresponds to
the minimum degrees of freedom, Q = 2, which we ob-
tain when no smoothing is in effect (α(k, m) = 0). Fur-
thermore, since the error variance of the minimum statis-
tics noise estimator is larger than the error variance of an
ideal moving average estimator [11], we increase the in-
verse bias B
min
(k, m)byafactorB
c
(m) = 1+a
v
Q
−1
(m)
with Q
−1
(m) = 1/L
L−1
k=0
(1/Q(k, m)) and a
v
typically set to
a
v
= 1.5.
6.3. Tracking nonstationary noise
The minimum statistics method searches for the bias-
compensated minimum λ
min
(k, m)ofD consecutive PSD es-
timates
λ
y
(k, l), l = m −D +1, , m. For each frequency bin
k, the D samples are selected by sliding a rectangular window
over the smoothed power data
λ
y
(k, l). Furthermore, we di-
vide the window of D samples into U subwindows of V sam-
ples each (UV = D). This allows us to update the minimum
of
λ
y
(k, m)everyV samples while keeping the computational
complexity low. For every V samples read, we compute the
minimum of the current subwindow and store it for later
use. We obtain an overall minimum after considering all such
subwindow minima. Also, we achieve better tracking of non-
stationary noise when we take local minima in the vicinity of
the overall minimum λ
min
(k, m) into account. For our pur-
poses, we ignore subwindow minima where the minimum
value is attained in the first or the last frame of a subwindow.
Since (37) is a function of the window length, computing
power estimates on the subwindow level requires a bias com-
pensation for the minima obtained from subwindows as well
(i.e., put D = V in (37)). A local (subwindow) minimum
may then override the overall minimum λ
min
(k, m) when it is
close to the overall minimum λ
min
(k, m)oftheD consecutive
power estimates. This procedure uses the spectral minima
of the shorter subwindows for improved tracking. To reduce
the likelihood of large estimation errors when using subwin-
dow minima, we apply a threshold noise slope max to the
difference between the subwindow minima and the overall
minimum. This threshold depends on the normalized aver-
aged variance Q
−1
(m)of
λ
y
(k, m) according to the procedure
shown in Algorithm 1. A large update is only possible when
the normalized averaged var iance Q
−1
(m)issmallandhence
when speech is most likely absent. Thus, we update the noise
PSD estimate when a local minimum is found, and when the
difference between the subwindow minimum and the overall
minimum does not exceed the threshold noise slope max. A
pseudocode program of the complete noise estimation algo-
rithm is shown in Algorithm 2. All computations are embed-
ded into loops over all frequency indices k and all frame in-
dices m. Subwindow quantities are subscripted by sub; subwc
is a sub-window counter which is initialized to subwc = V at
the start of the program; actmin(k, m) and actmin sub(k, m)
are the spectral minima of the current window and subwin-
dow up to frame m,respectively.
We point out that the tracking of nonstationary noise
is significantly influenced by this mechanism and may be
improved (at the expense of speech signal distortion) by
A Noise Reduction Preprocessor for Mobile Voice Communication 1055
If Q
−1
(m) < 0.03,
noise
slope max = 8.
Elseif Q
−1
(m) < 0.05,
noise
slope max = 4.
Elseif Q
−1
(m) < 0.06,
noise
slope max = 2.
Else noise slope max = 1.2.
Algorithm 1: Computation of noise slope max .
Compute smoothing parameter α(k, m), (33).
Compute smoothed power
λ
y
(k, m), (29).
Compute Q
−1
(m) =
k
1/Q(k, m).
Compute bias correction B
min
(k, m)andB
min sub
(k, m),
(38), (39), (42), and B
c
(m)
Set update-flag k mod(k) = 0forallk.
If
λ
y
(k, m) B
min
(k, m) B
c
(m) < actmin(k, m),
actmin(k, m) =
λ
y
(k, m) B
min
(k, m) B
c
(m),
actmin sub(k, m) =
λ
y
(k, m) B
min sub
(k, m) B
c
(m),
set k mod(k) = 1.
If subwc == V ,
if k
mod(k) == 1,
l min flag(k, m) = 0,
store actmin(k, m),
find λ
min
(k, m), the minimum of the last U stored
values of actmin,
compute noise slope max,
if l min flag(k, m) and (actmin sub(k, m)
< noise slope max λ
min
(k, m))
and (actmin sub(k, m) >λ
min
(k, m)),
λ
min
(k, m) = actmin sub(k, m),
replace all previously stored values
of actmin(k, )byactmin sub(k, m),
l min flag(k, m) = 0;
set subwc = 1 and actmin(k, m) to its maximum
initial value.
Else
if subwc > 1,
if k
mod(k) == 1,
set l min flag(k, m) = 1,
compute
λ
d
(k, m)
= min(actmin sub(k, m), λ
min
(k, m)),
set λ
min
(k, m) =
λ
d
(k, m),
set subwc = subwc +1.
Algorithm 2: The minimum statistics noise estimation algorithm
[11].
increasing the noise slope max threshold. We also note that
it is important to use an adaptive smoothing parameter
α(k, m)asin(33). Otherwise, for a high SNR and a fixed
smoothing parameter close to 1, the estimated signal power
will decay too slowly after a period of speech activity. Hence,
the minimum search window might then be too small to
track the noise floor without being biased by the speech.
Although the minimum statistics approach [11, 23]was
originally developed for a sampling rate of f
s
= 8000 Hz
and a frame advance of 128 samples, it can be easily adapted
to other sampling ra tes and frame advance schemes. The
length D of the minimum search w indow must be set pro-
portional to the frame rate. For a given sampling rate f
s
and frame advance M
E
, the duration of the time window
for minimum search, D · M
E
/f
s
, should be equal to approx-
imately 1.5 seconds. For U
= 8 subwindows, we therefore
use V =0.1875 f
s
/M
E
,wherex denotes the smallest in-
teger larger than or equal to x. When a constant smoothing
parameter [23]isusedin(29), the length D of the window
for minimum search must be at least 50% larger than that for
the adaptive smoothing algorithm.
7. EXPERIMENTAL RESULTS
The evaluation of noise reduction algorithms using instru-
mental (“objective”) measures is an ongoing research topic
[24, 25]. Frequently, quality improvements are evaluated in
terms of (segmental) SNR and the achieved noise attenua-
tion. These measures, however, can be misleading as speech
signal distortions and unnatural-sounding residual noise are
not properly reflected. Also, as long as the reduction of noise
power is larger than the reduction of speech power, the per-
formance with respect to these met rics may be improved
by applying more attenuation to the noisy signal at the ex-
pense of speech quality. The basic noise attenuation ver-
sus speech distortion t rade-off is application- and possibly
listener-dependent. Even l istening tests do not always lead
to conclusive results, as was experienced during the stan-
dardization process of a noise reduction preprocessor for the
ETSI/3GPP AMR coder [26, 27]. Specifically, the outcome
of these tests depends on whether an absolute category rat-
ing (ACR) or a comparison category rating (CCR) method is
favored.
To capture the possible degradations of both the speech
signal and the background noise, a multifaceted approach
such as the well-established diagnostic acceptability mea-
sure (DAM) is useful. The DAM evaluates a large number
of quality characteristics, including the nature of the residual
background noise in the enhanced signal. Intelligibility tests
are more conclusive and reproducible despite being rarely
used. In our investigation, we evaluated intelligibility using
the standard diagnostic rhyme test (DRT). For both tests,
higher scores are an indication of better quality. More in-
formation about the DAM and the DRT may be found in
[28].
While preliminary results for a floating-point implemen-
tation of the preprocessor were presented in [2], we sum-
marize our results here for a 16-bit fixed-point implemen-
tation, used in conjunction with the MELP coder. We eval-
uate quality and intelligibility, respectively, all using DAM
and DRT scores obtained via formal listening tests. To pro-
vide an additional reference, we compare the 2.4-kbps MELP
coder using our enhancement preprocessor (denot ed in [1]
by MELPe) with the toll quality 8-kbps ITU-T coder, G.729a
1056 EURASIP Journal on Applied Signal Processing
Table 1: DAM scores and standard error without environmental
noise.
Coder DAM Standard error
MELPe 68.6 0.90
G.729a 80.9 1.80
Table 2: DAM scores and standard error with vehicular noise (av-
erage SNR ≈ 6dB).
Coder DAM Standard error
Unprocessed 45.0 1.2
MELP 38.9 1.1
MELPe 50.3 0.80
G.729a 46.3 0.90
(without a preprocessor). Compared to the results reported
for the floating-point implementation [2], the fixed-point
implementation scores about 2 points less on both the DAM
and the DRT scales. Table 1 presents DAM scores for the
MELPe and the G.729a coders without environmental noise.
Clearly, the G.729a coder, operating at a much higher rate
than the MELPe coder, delivers significantly better quality.
In the presence of vehicular noise with an average SNR of
about 6 dB (Table 2), the MELPe scores significantly higher
than the standalone MELP coder, the unprocessed signal,
and the G.729a coder. Note that the G.729a achieves ap-
proximately the same DAM score as the unprocessed sig-
nal.
Tables 3 and 4 show intelligibility results for the clean
and noisy conditions. For the clean condition, the higher bit
rate G.729a coder is clearly more transparent, but the intel-
ligibility of the MELPe is surprisingly close. This reinforces
the frequently made observation that high intelligibility can
be achieved with low bit rate coders. For the noisy envi-
ronment (Table 4), we find that the unprocessed (and un-
encoded) signal achieves the best intelligibility. The MELPe
coder, containing the noise reduction preprocessor, results in
a significant intelligibility improvement. These intelligibility
improvements are mostly due to the conservative noise esti-
mation algorithm which is unbiased for stationary noise but
underestimates the noise floor for nonstationary noise [11].
More detailed results for different noise environments may
be found in [29].
8. CONCLUSION
We have presented a noise reduction preprocessor based on
MMSE estimation techniques and the minimum statistics
noise estimation approach. The combination of these algo-
rithms and the careful selection of parameters lead to a noise
reduction preprocessor that achieves improvements both in
quality and intelligibility when used with the 2.4 kbps MELP
Table 3: DRT scores and standard error without environmental
noise.
Coder DRT Standard error
MELPe 93.9 0.53
G.729a 94.7 0.25
Table 4: DRT scores and standard error with vehicular noise (aver-
age SNR ≈ 6dB).
Coder DRT Standard error
Unprocessed 91.1 0.37
MELP 67.3 0.8
MELPe 72.5 0.58
G.729a 77.8 0.58
coder. Thus, in the context of low bit rate coding, single mi-
crophone enhancement algorithms can result in intelligibil-
ity improvements. The loss of intelligibility is not as severe
for high bit rate coders as for low bit rate coders, such as the
MELP coder.
We believe that the potential for further improving
speech transmission in noisy conditions has not yet been
fully exploited. Further improvements might be obtained by
using optimal enhancement algorithms for the various pa-
rameters found in speech coders, such as the LPC coeffi-
cients, the pitch, and the representation of the prediction
residual signal. Such an approach is proposed in [30]. Novel
noise PSD and a priori SNR estimation procedures [14, 15],
as well as more realistic assumptions for the probability den-
sity functions of the speech and noise spectral coefficients
[31, 32], could also lead to improved performance.
ACKNOWLEDGMENTS
This work was generously supported by AT&T Labs-Research
and the US government. The authors would like to thank
Dr. John Collura for many stimulating discussions and for
providing the subjective listening test results. This work
was sponsored by US government contract MDA-904-97-C-
0452. The authors collaborated on this project at AT&T Labs-
Research, Speech and Image Processing Services Research
Lab, USA.
REFERENCES
[1] T. Wang, K. Koishida, V. Cuperman, A. Gersho, and J. Collura,
“A 1200/2400 BPS coding suite based on MELP,” in Proc. IEEE
Workshop on Speech Coding Proceedings, pp. 90–92, Tsukuba,
Japan, October 2002.
[2] J. Collura, “Speech enhancement and coding in harsh acous-
tic noise environments,” in Proc. IEEE Workshop on Speech
Coding Proceedings, pp. 162–164, Porvoo, Finland, June 1999.
A Noise Reduction Preprocessor for Mobile Voice Communication 1057
[3] J. S. Lim and A. Oppenheim, “Enhancement and bandwidth
compression of noisy speech,” Proceedings of the IEEE, vol. 67,
no. 2, pp. 1586–1604, 1979.
[4] R. McAulay and M. Malpass, “Speech enhancement using a
soft-decision noise suppression filter,” IEEE Trans. Acoustics,
Speech, and Signal Processing, vol. 28, no. 2, pp. 137–145, 1980.
[5] Y. Ephraim and D. Malah, “Speech enhancement using a min-
imum mean square error short-time spectral amplitude esti-
mator,” IEEE Trans. Acoustics, Speech, and Signal Processing,
vol. 32, no. 6, pp. 1109–1121, 1984.
[6] Y. Ephraim and D. Malah, “Speech enhancement using a min-
imum mean-square error log-spectral amplitude estimator,”
IEEE Trans. Acoustics, Speech, and Signal Processing, vol. 33,
no. 2, pp. 443–445, 1985.
[7] J. Yang, “Frequency domain noise suppression approaches in
mobile telephone systems,” in Proc. IEEE Int. Conf. Acoustics,
Speech, Signal Processing, pp. 363–366, Minneapolis, Minn,
USA, April 1993.
[8] P. Scalart and J. V. Filho, “Speech enhancement based on apri-
ori signal to noise estimation,” in Proc. IEEE Int. Conf. Acous-
tics, Speech, Signal Processing, pp. 629–632, Atlanta, Ga, USA,
May 1996.
[9] D. Malah, R. Cox, and A. Accardi, “Tracking speech-
presence uncertainty to improve speech enhancement in
non-stationar y noise environments,” in Proc. IEEE
Int. Conf. Acoustics, Speech, Signal Processing, vol. 2, pp. 789–
792, Phoenix, Ariz, USA, Mar 1999.
[10] J. Thyssen, Y. Gao, A. Benyassine, et al., “A candidate for
the ITU-T 4 kbit/s speech coding standard,” in Proc. IEEE
Int. Conf. Acoustics, Speech, Signal Processing, vol. 2, pp. 681–
684, Salt Lake City, Utah, USA, May 2001.
[11] R. Martin, “Noise power spectral density estimation based
on optimal smoothing and minimum statistics,” IEEE Trans.
Speech, and Audio Processing, vol. 9, no. 5, pp. 504–512, 2001.
[12] R. Martin and R. Cox, “New speech enhancement tech-
niques for low bit r ate speech coding,” in Proc. IEEE Workshop
on Speech Coding Proceedings, pp. 165–167, Porvoo, Finland,
June 1999.
[13] D. Griffin and J. Lim, “Signal estimation from modified short-
time Fourier transform,” IEEE Trans. Acoustics, Speech, and
Signal Processing, vol. 32, no. 2, pp. 236–243, 1984.
[14] I. Cohen and B. Berdugo, “Speech enhancement for non-
stationar y noise environments,” Signal Processing, vol. 81, no.
11, pp. 2403–2418, 2001.
[15] I. Cohen, “Optimal speech enhancement under signal pres-
ence uncertaint y using log-spectral amplitude estimator,”
IEEE Signal Processing Letters, vol. 9, no. 4, pp. 113–116, 2002.
[16] O. Capp
´
e, “Elimination of the musical noise phenomenon
with the Ephraim and Malah noise suppressor,” IEEE Trans.
Speech, and Audio Processing, vol. 2, no. 2, pp. 345–349, 1994.
[17] M. Berouti, R. Schwartz, and J. Makhoul, “Enhancement
of speech corrupted by acoustic noise,” in Proc. IEEE
Int. Conf. Acoustics, Speech, Signal Processing, pp. 208–211,
April 1979.
[18] T. Ferguson, Mathematical Statistics: A Dec ision Theoretic Ap-
proach, Academic Press, New York, NY, USA, 1967.
[19] J. A. Rice, Mathematical Statistics and Data Analysis,Duxbury
Press, Boston, Mass, USA; Wadsworth Publishing, Belmont,
Calif, USA, 1995.
[20] J. Sohn and W. Sung, “A voice activity detector employing
soft decision based noise spectrum adaptation,” in Proc. IEEE
Int. Conf. Acoustics, Speech, Signal Processing, vol. 1, pp. 365–
368, Seattle, Wash, USA, May 1998.
[21] E. Ekudden, R. Hagen, I. Johansson, and J. Svedberg, “The
adaptive multi-rate speech coder,” in Proc. IEEE Workshop
on Speech Coding Proceedings, pp. 117–119, Porvoo, Finland,
June 1999.
[22] R. Martin, I. Wittke, and P. Jax, “Optimized estimation
of spectral parameters for the coding of noisy speech,” in
Proc. IEEE Int. Conf. Acoustics, Speech, Signal Processing, vol. 3,
pp. 1479–1482, Istanbul, Turkey, June 2000.
[23] R. Martin, “Spectral subtraction based on minimum statis-
tics,” in Proc. 7th European Signal Processing Conference,pp.
1182–1185, Edinburgh, Scotland, September 1994.
[24] E. Paajanen and V V. Mattila, “Improved objective mea-
sures for characterization of noise suppression algorithms,” in
Proc. IEEE Workshop on Speech Coding Proceedings, pp. 77–79,
Tsukuba, Ibar aki, Japan, October 2002.
[25] P. Dreiseitel, “Hybrid quality measures for single-channel
speech enhancement algorithms,” European Transactions on
Telecommunication, vol. 13, no. 2, pp. 159–166, 2002.
[26] ETSI, TS 122 076, V5.0.0: Digital Cellular Telecommunications
System (Phase 2+); Universal Mobile Telecommunications Sys-
tem (UMTS); Noise Suppression for the AMR Codec; Service
Description, June 2002.
[27] ETSI, TR 126 978, V4.0.0: Universal Mobile Telecommunica-
tions System (UMTS); Results of the AMR Noise Suppression Se-
lection Phase (3GPP TR 26.978 Version 4.0.0 Release 4),March
2001.
[28] S. R. Quackenbush, T. P. Barnwell, and M. A. Clements, Ob-
jective Measures of Speech Quality, Prentice-Hall, Englewood
Cliffs, NJ, USA, 1988.
[29] M. St reet, “STANAG 4591 results,” in Proc. NC3A Workshop
on STANAG 4591, The Hague, Netherlands, October 2002.
[30] A. Accar di and R. Cox, “A modular approach to speech
enhancement with an application to speech coding,” in
Proc. IEEE Int. Conf. Acoustics, Speech, Signal Processing, vol. 1,
pp. 201–204, Phoenix, Ariz, USA, March 1999.
[31] R. Martin, “Speech enhancement using MMSE short time
spectral estimation with gamma distributed speech priors,” in
Proc. IEEE Int. Conf. Acoustics, Speech, Signal Processing, vol. 1,
pp. 253–256, Orlando, Fla, USA, May 2002.
[32] R. Martin, “Speech enhancement based on minimum mean
square error estimation and supergaussian priors,” to appear
in IEEE Trans. Speech and Audio Processing.
Rainer Martin received the Dipl. Ing . and
Dr. Ing. degrees from Aachen University of
Technology, in 1988 and 1996, respectively,
and the MSEE degree from Georgia Insti-
tute of Technology in 1989. From 1996 to
2002 he has been a Senior Research Engi-
neer with the Institute of Communication
Systems and Data Processing, Aachen Uni-
versity of Technology. From April 1998 to
March 1999 he was on leave at the AT&T
Speech and Image Processing Services Research Lab, Florham Park,
NJ. From April 2002 until October 2003 he was a Professor of dig-
ital signal processing at the Technical University of Braunschweig,
Germany. Since October 2003 he has been a Professor of informa-
tion technology at Ruhr-University Bochum, Germany, and Head
of the Institute of Communication Acoustics, Bochum, Germany.
His research interests are signal processing for voice communi-
cation systems, acoustics, and human-machine interfaces. He has
worked on algorithms for noise reduction, acoustic echo cancella-
tion, microphone arrays, and speech recognition. Furthermore, he
is interested in speech coding and robustness issues in speech and
audio transmission.
1058 EURASIP Journal on Applied Signal Processing
David Malah received the B.S. and M.S. de-
grees in 1964 and 1967, respectively, from
the Technion – Israel Institute of Technol-
ogy, Haifa, Israel, and the Ph.D. degree
in 1971 from the University of Minnesota,
Minneapolis, Minnesota, all in electrical en-
gineering. During 1971–1972 he was an
Assistant Professor at the Electrical Engi-
neering Department of the University of
New Brunswick, Fredericton, NB, Canada.
In 1972 he joined the Electrical Eng ineering Department of the
Technion, where he is a Full Professor, holding the Elron/Elbit
Chair in Electrical Engineering. During the period from 1979 to
2001 he spent about 6 years, cumulatively, of sabbaticals and sum-
mer leaves at AT&T Bell Laboratories, Murray Hill, NJ, and AT&T
Labs, Florham Park, NJ, performing research in the areas of speech
and image communication. Since 1975 he has been the academic
head of the Signal and Image Processing Laboratory (SIPL), at the
Technion, Department of Electrical Engineering, which is active
in image and speech communication research and education. His
main research interests are in image, video, speech, and audio cod-
ing; speech enhancement; image processing; digital watermarking
applications; and digital signal processing techniques. Since 1987
he has been a Fellow of the IEEE.
Richard V. Cox received his B.S. from Rut-
gers University and his Ph.D. from Prince-
ton University, both in electrical engineer-
ing. In 1979 he joined the Acoustics Re-
search Depart ment of Bell Laboratories.
He has conducted research in the areas
of speech coding, digital signal processing,
analog voice privacy, audio coding, real-
time implementations, speech recognition,
and speech enhancement. He is well known
for his work in speech coding standards. He collaborated on the
low-delay CELP algorithm that became ITU-T Recommendation
G.728 in 1992. He managed the International Telecommunication
Union effort that resulted in the creation of ITU-T Recommenda-
tion G.723.1 in 1995. In 1992 he was appointed Department Head
of the Speech Coding Research Department of AT&T Bell Labs.
In 1996 he joined AT&T Labs as Division Manager of the Speech
Processing Software and Technology Research Department. In Au-
gust 2000 he was appointed Speech and Image Processing Services
Research Vice President. He is currently IP and Voice Services Re-
search Vice President. Dr. Cox is a Fellow of the IEEE and is past
President of the IEEE Signal Processing Society. In 1999 he was
awarded the AT&T Science and Technology Medal and in 2000 the
IEEE Third Millennium Medal.
Anthony J. Accardi is a software archi-
tect at Tellme Networks, a privately held
company that makes extensive use of
speech signal processing technology. In
1998 he received B.S. degrees in mathemat-
ics and electrical engineering/computer sci-
ence, and an M.Eng. degree in electrical
engineering/computer science, all from the
Massachusetts Institute of Technology. He
worked at AT&T Bell Labs and AT&T Re-
search on speech processing and enhancement algorithms (1996–
1998). In 1999, he became a member of the team that founded
Tellme Networks. His current research interests include large-scale
network design and highly available systems.