A survey of the uk tax system
Bạn đang xem bản rút gọn của tài liệu. Xem và tải ngay bản đầy đủ của tài liệu tại đây (774.28 KB, 66 trang )
A survey of the UK tax system
IFS Briefing Note BN09
Thomas Pope
Tom Waters
A Survey of the UK Tax System
Updated by Thomas Pope and Tom Waters*
November 2016
Institute for Fiscal Studies
Acknowledgements
This briefing note is a revision of earlier versions by Stuart Adam, James
Browne, Lucy Chennells, Andrew Dilnot, Christine Frayne, Charlotte Grace,
Greg Kaplan, Thomas Pope, Barra Roantree, Nikki Roback and Jonathan
Shaw, which substantially revised and updated the UK chapter by A. Dilnot
and G. Stears in K. Messere (ed.), The Tax System in Industrialized
Countries, Oxford University Press, Oxford, 1998. The original briefing note
can be downloaded from />The paper was funded by the ESRC Centre for the Microeconomic Analysis
of Public Policy at the Institute for Fiscal Studies (grant ES/M010147/1).
The authors thank Stuart Adam for his help and advice during revision of
the briefing note. All errors are the responsibility of the authors.
*Address for correspondence:
ISBN 978-1-909463-68-4
© Institute for Fiscal Studies, 2016
Contents
1. Introduction .......................................................................................................................... 3
2. Revenue raised by UK taxes........................................................................................... 4
3. The tax system ..................................................................................................................... 6
3.1 Income tax ...................................................................................................................... 6
3.2 National Insurance contributions (NICs) ...................................................... 14
3.3 Value added tax (VAT) ........................................................................................... 17
3.4 Other indirect taxes ................................................................................................. 19
3.5 Capital taxes................................................................................................................ 24
3.6 Corporation tax ......................................................................................................... 28
3.7 Taxation of North Sea production .................................................................... 31
3.8 Taxation of banks ..................................................................................................... 32
3.9 Council tax ................................................................................................................... 32
3.10 Business rates ......................................................................................................... 34
4. Summary of recent trends ........................................................................................... 37
4.1 How did we get here? ............................................................................................. 37
4.2 Personal income taxes ........................................................................................... 40
4.3 Taxation of savings and wealth.......................................................................... 49
4.4 Indirect taxes.............................................................................................................. 56
4.5 Taxes on companies ................................................................................................ 61
4.6 Local taxation ............................................................................................................. 63
5. Conclusions ........................................................................................................................ 65
© Institute for Fiscal Studies, 2016
2
1. Introduction
This briefing note provides an overview of the UK tax system. It describes
how each of the main taxes works and examines their current form in the
context of the past 35 years or so. We begin, in Section 2, with a brief
assessment of the total amount of revenue raised by UK taxation and the
contribution made by each tax to this total. In Section 3, we describe the
structure of each of the main taxes: income tax; National Insurance
contributions; value added tax and other indirect taxes; capital taxes such
as capital gains tax and inheritance tax; corporation tax; taxes on North
Sea production; the bank levy; council tax; and business rates. The
information given in these subsections relates, where possible, to the tax
system for the fiscal year 2016–17.
In Section 4, we set the current system in the context of reforms that have
taken place over the last 35 years or so. The section examines the changing
structure of income tax and National Insurance contributions and
developments in the taxation of savings, indirect taxes, taxes on companies
and local taxation. 1
Much of the information in this briefing note is taken from the
government’s website. 2 Information relating to tax receipts is from the
Office for Budget Responsibility (OBR)’s Economic and Fiscal Outlook
published alongside the March 2016 Budget. 3 Occasionally, sources can be
inconsistent because of the different timing of publications or minor
definitional disparities.
1
There is more information on historical tax rates on the IFS website at
/>2
See />
3
See />
© Institute for Fiscal Studies, 2016
3
2. Revenue raised by UK taxes
Total UK government receipts are forecast to be £716.5 billion in 2016–17,
or 36.9% of UK GDP. This is equivalent to roughly £13,500 for every adult
in the UK, or £10,900 per person. 4 Not all of this revenue comes from
taxes: taxes as defined in the National Accounts are forecast to raise
£665.1 billion in 2016–17, with the remainder provided by surpluses of
public sector industries, rent from state-owned properties and so on.
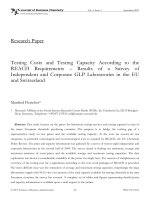
Table 1 shows the composition of UK government revenue. Income tax,
National Insurance contributions and VAT are easily the largest sources of
revenue for the government, together accounting for almost 60% of total
tax revenue. Duties and other indirect taxes constitute around 10% of
current receipts, with fuel duties of £27.6 billion the largest component.
The only other substantial category is company taxes, which come to 10%
of current receipts, predominantly corporation tax and business rates.
There has been some variation over time in the composition of
government receipts and the size of receipts as a proportion of GDP. We
return to these topics in Section 4.
4
Using table Z1 of Office for National Statistics, Principal Population Projections
(2014-Based).
© Institute for Fiscal Studies, 2016
4
Table 1. Sources of government revenue, 2016–17 forecasts
Income tax (gross of tax credits)
National Insurance contributions
Value added taxa
Other indirect taxes
Fuel duties
Tobacco duties
Alcohol duties
Betting and gaming duties
Vehicle excise duty
Air passenger duty
Insurance premium tax
Landfill taxb
Climate change levy
Customs duties
Capital taxes
Capital gains tax
Inheritance tax
Stamp duty land taxb
Stamp duty on shares
Company taxes
Corporation tax (net of tax credits)
Petroleum revenue tax
Business rates
Bank levy
Bank surcharge
Council tax
Other taxes and royaltiesc
National Accounts taxes
Interest and dividends
Gross operating surplus, rent, other receipts & adjustments
Current receipts
a
Revenue
(£bn)
Percentage
of total
receipts
182.1
126.5
120.1
25.4
17.7
16.8
27.6
9.2
11.0
2.6
5.5
3.2
4.6
0.9
2.1
3.1
3.9
1.3
1.5
0.4
0.8
0.4
0.6
0.1
0.3
0.4
7.0
4.8
12.9
3.0
1.0
0.7
1.8
0.4
42.7
–1.1
28.4
2.9
0.8
30.1
35.4
665.1
5.6
45.7
716.5
6.0
–0.2
4.0
0.4
0.1
4.2
4.9
92.8
0.8
6.4
100
Net of (i.e. after deducting) VAT refunds paid to other parts of central and local government;
these are included in ‘Other taxes and royalties’.
b
Excluding Scotland. Land and buildings transaction tax operates instead of stamp duty land tax
in Scotland. Landfill tax is also devolved but maintains the same system as the rest of the UK.
c
‘Other taxes and royalties’ includes environmental levies, EU ETS auction receipts, VAT
refunds, diverted profits tax, corporation tax credits, Scottish taxes, aggregates levy, licence fee
receipts, and other taxes.
Note: Figures may not sum exactly to totals because of rounding.
Source: Office for Budget Responsibility, Economic and Fiscal Outlook, March 2016,
/>
© Institute for Fiscal Studies, 2016
5
3. The tax system
3.1 Income tax
The tax base
Income tax is forecast to raise £182.1 billion in 2016–17, but not all
income is subject to tax. The primary forms of income subject to tax are
earnings from employment, income from self-employment and
unincorporated businesses, 5 jobseeker’s allowance, retirement pensions,
income from property, bank and building society interest, and dividends
on shares. Incomes from most means-tested social security benefits are
not liable to income tax. Many non-means-tested benefits are subject to tax
(e.g. basic state pension), but some (e.g. disability living allowance) are
not. Gifts to registered charities can be deducted from income for tax
purposes, as can employer and employee pension contributions (up to an
annual and a lifetime limit), although employee social security (National
Insurance) contributions are not deducted. Income tax is also not paid on
income from certain savings products, such as National Savings certificates
and Individual Savings Accounts (ISAs).
Allowances, bands and rates
Income tax operates through a system of allowances and bands of income.
Each individual has a personal allowance, which is deducted from total
income before tax to give taxable income. Taxpayers receive a basic
personal allowance of £11,000. Previously those born before 6 April 1938
were entitled to a higher age-related allowance (ARA), but that was
abolished in 2016–17. Since 2015–16, a married person with some unused
personal allowance is able to transfer up to 10% of that allowance to a
higher-earning spouse, as long as the higher earner is not paying
higher- or additional-rate income tax.
In the past, married couples were also entitled to a married couple’s
allowance (MCA). This was abolished in April 2000, except for those
5
Self-employed individuals and owners of unincorporated businesses can deduct
allowable business expenses when calculating taxable income. For buy-to-let landlords,
an important deduction is mortgage interest, though measures to restrict relief to the
basic rate of income tax will be phased in over four years from April 2017. See
/>© Institute for Fiscal Studies, 2016
6
already aged 65 or over at that date (i.e. born before 6 April 1935). For
these remaining claimants, the MCA does not increase the personal
allowance; instead, it simply reduces final tax liability by up to £835.50.
These allowances are withdrawn from taxpayers with sufficiently high
incomes. The personal allowance is reduced by 50 pence for every pound
of income above £100,000, gradually reducing it to zero for those with
incomes above £122,000. The MCA begins to be withdrawn at income
levels above £27,700 at a rate of 5 pence in the pound until the relief
reaches the minimum amount of £322 at income levels of £37,970. 6
Taxable income (i.e. income above the personal allowance) is subject to
different tax rates depending upon the band within which it falls. Up to the
basic-rate limit (£32,000 in 2016–17), taxable income is subject to the
basic rate of 20%. Taxable income between the basic-rate limit and the
higher-rate limit of £150,000 is subject to the higher rate of 40%, and the
additional rate of 45% is payable on income above £150,000. Since April
2016, the basic, higher and additional rates of income tax in Scotland have
been reduced by 10 percentage points and a new Scottish rate of income
tax applies to those living in Scotland. The Scottish parliament has set this
at 10%, meaning no changes in income tax rates for affected taxpayers. 7
The Smith Commission proposed that income tax rates and bands on nonsavings or dividend income and all associated revenues could in future be
devolved to the Scottish parliament. This would give the power to vary
each rate of tax individually – for instance, putting up only the top rate of
tax, or cutting only the basic rate – and to change the thresholds at which
the higher (40%) and additional (45%) rates become payable. In principle,
it would also allow for the creation of new bands and rates, and be a
significant increase in powers over the current situation.
6
The withdrawal of the personal allowance effectively creates extra tax rates in the
system. Those with incomes between £100,000 and £122,000 lose 50p of personal
allowance for each additional pound of income, which is worth 20p (40% of 50p),
meaning that their overall marginal income tax rate is 60% once this is added to the
40% higher rate of income tax. In addition, child benefit is reduced by 1% for every
£100 of earnings above £50,000. This creates additional tax rates that depend on the
amount of child benefit received, and so the number of children. For further details, see
A. Hood and A. Norris Keiller, ‘A survey of the UK benefit system’, IFS Briefing Note
BN13, 2016, />7
See />
© Institute for Fiscal Studies, 2016
7
Savings income and dividend income are subject to slightly different tax
rates. Savings income that falls into the first £5,000 of taxable income is
free from tax. Since April 2016, most taxpayers receive a further personal
savings allowance, 8 such that any savings income below this allowance is
tax-free. The size of the personal savings allowance is determined by the
taxpayer’s income tax bracket. The first £1,000 of savings income for
basic-rate taxpayers and £500 for higher-rate taxpayers is tax-free, though
additional-rate taxpayers do not receive a personal savings allowance.
Savings income above the personal savings allowance is taxed, like other
income, at 20% in the basic-rate band, 40% in the higher-rate band and
45% above £150,000.
Since April 2016, there is also a dividend income allowance of £5,000.
Dividend income above this allowance is taxed at 7.5% up to the basic-rate
limit, 32.5% between the basic-rate and additional-rate limits, and 38.1%
above that. When calculating which tax band different income sources fall
into, dividend income is treated as the top slice of income, followed by
savings income, followed by other income.
Most bands and allowances are increased at the start (in April) of every tax
year in line with statutory indexation provisions, unless parliament
intervenes. These increases are announced at the time of the annual
Budget and are in line with the percentage increase in the Consumer
Prices Index (CPI) in the year to the previous September. Increases in
personal allowances and the starting-rate limit are rounded up to the next
multiple of £10, while the basic-rate limit is rounded up to the next
multiple of £100. The additional-rate limit and the £100,000 threshold at
which the personal allowance starts to be withdrawn are frozen in
nominal terms each year unless parliament intervenes.
Of a UK adult population of around 53.2 million, it is estimated that there
will be 30.1 million income tax payers in 2016–17. Around 4.4 million of
these will pay tax at the higher rate (but not the additional rate), providing
8
Although called a personal savings allowance, this is in fact a nil-rate band rather than
an allowance, in the sense that the interest income it covers is taxed at 0% but is not
deducted from taxable income when calculating whether the individual is a basic-,
higher- or additional-rate taxpayer and whether their personal allowance, child benefit
or tax credits should be withdrawn. The same applies to the ‘dividend allowance’
described below.
© Institute for Fiscal Studies, 2016
8
38.5% of total income tax revenue, and 333,000 taxpayers will pay tax at
the additional rate, providing 28.0% of total income tax revenue. 9
Taxation of alternative forms of saving
Individual Savings Accounts (ISAs) allow individuals to add up to £15,240
to a tax-sheltered savings account each year. Funds can be saved as cash,
placed in stocks and shares, or invested in ‘innovative finance’ (peer-topeer lending), and income resulting from these savings is not taxed
(including capital gains, which might otherwise be subject to capital gains
tax). From April 2017, Lifetime Individual Savings Accounts (LISAs),
vehicles that subsidise pension saving and saving towards buying a first
house, will be available. These are discussed in further detail in Section
4.3.
The tax system treats pensions differently from other forms of saving.
Contributions towards pensions are exempt from tax, as are the returns on
pension investments, while withdrawals from pensions are taxed like
other forms of income, except that individuals can take 25% of their
pension pot tax-free. 10 An annual allowance caps the amount of pension
contributions on which individuals can receive tax relief in a given year. In
2016–17, this allowance is £40,000, having been substantially reduced
over the past six years (see Section 4.3). 11 Tax relief on contributions is
also only available to those with a pension pot under the lifetime
allowance. This has also been cut in recent years, and stands at £1 million
in 2016–17.
Taxation of charitable giving
There are two ways in which people can donate money to charities taxfree: Gift Aid and payroll giving schemes.
9
Source: Tables 2.1 and 2.6 at />10
On top of this tax-free ‘lump sum’, employer contributions to pensions in particular
have a favourable NICs treatment (see Section 3.2), making pensions an extremely taxadvantaged form of saving.
11
This allowance is also subject to a taper for incomes (including employer pension
contributions) above £150,000 at a rate of £1 for every £2 of additional income, until it
reaches the minimum of £10,000. This means that any individual with earnings over
£210,000 can only receive tax relief on £10,000 of pension contributions.
© Institute for Fiscal Studies, 2016
9
Gift Aid gives individuals (and companies) tax relief on donations.
Individuals make donations out of net (after-tax) income and, if the donor
makes a Gift Aid declaration, the charity can claim back the basic-rate tax
paid on it; higher- and additional-rate taxpayers can claim back from
HMRC (and keep) the difference between basic-rate and higher-rate or
additional-rate tax. In 2015–16, charities received £1.26 billion under the
Gift Aid scheme on £5.05 billion of donations, while higher- and additionalrate taxpayers received £480 million in relief on charitable donations from
HMRC. 12
Under a payroll giving scheme (Give-As-You-Earn), employees nominate
the charities to which they wish to make donations and authorise their
employer to deduct a fixed amount from their pay. This requires the
employer to contract with an HMRC-approved collection agency, and tax
relief is given by deducting donations from pay before calculating tax due.
The cost of the payroll giving scheme was estimated to be £40 million in
2015–16. 13
Payments system
The Pay-As-You-Earn (PAYE) system of withholding income tax from
earnings (and from private and occupational pensions) involves exact
cumulative deduction – i.e. when calculating tax due each week or month,
the employer considers income not simply for the period in question but
for the whole of the tax year to date. Tax due on total cumulative income is
calculated and tax paid thus far is deducted, giving a figure for tax due this
week or month. The cumulative system means that, at the end of the tax
year, the correct amount of tax should have been deducted – at least for
those with relatively simple affairs – whereas under a non-cumulative
system (in which only income in the current week or month is
considered), an end-of-year adjustment might be necessary.
Since April 2013, employers have been obliged to report salary payments
to HMRC in real time, rather than just at the end of the year. This – in
principle – allows HMRC to calculate and deduct tax based on real-time
12
Source: Table 10.3 at and table 10.2 at />13
Source: Table 10.2 at />
© Institute for Fiscal Studies, 2016
10
knowledge of individuals’ income from all sources. 14 About 85% of income
tax revenue is collected through PAYE.
Those with more complicated affairs – such as the self-employed, those
with very high incomes, company directors and landlords – must fill in a
self-assessment tax return after the end of the tax year, setting down their
incomes from different sources and any tax-privileged spending such as
pension contributions or gifts to charity; HMRC will calculate the tax owed
given this information. Tax returns must be filed by 31 October if
completed on paper or by 31 January if completed online; 31 January is
also the deadline for payment of the tax. Fixed penalties and surcharges
operate for those failing to make their returns by the deadlines and for
underpayment of tax.
PAYE works well for most people most of the time, sparing two-thirds of
taxpayers from the need to fill in a tax return. However, in a significant
minority of cases, the wrong amount is withheld – typically when people
have more than one source of PAYE income during the year (e.g. more than
one job/pension over the course of the year), especially if their
circumstances change frequently or towards the end of the year. Such
cases can be troublesome to reconcile later on, which is one reason the
government has embarked on a programme of modernisation for PAYE. 15
Tax credits
The Labour government of 1997–2010 oversaw a move towards the use of
tax credits to provide support that would previously have been delivered
through the benefit system. Since April 2003, there have been two tax
14
There could also be benefits beyond income tax from this: for example, it might
become possible to adjust benefit and tax credit awards automatically when income
changes, eliminating the need for individuals to notify the government separately. The
government intends its new universal credit to use such a system for calculating
entitlements. For more details on universal credit, see A. Hood and A. Norris Keiller, ‘A
survey of the UK benefit system’, IFS Briefing Note BN13, 2016,
/>15
For an assessment of PAYE, see J. Shaw, J. Slemrod and J. Whiting, ‘Administration
and compliance’, in J. Mirrlees, S. Adam, T. Besley, R. Blundell, S. Bond, R. Chote, M.
Gammie, P. Johnson, G. Myles and J. Poterba (eds), Dimensions of Tax Design: The
Mirrlees Review, Oxford University Press for IFS, Oxford, 2010,
and the associated commentaries by R.
Highfield and by B. Mace (same volume).
© Institute for Fiscal Studies, 2016
11
credits in operation – child tax credit and working tax credit. Both are
based on family (as opposed to individual) circumstances and both are
refundable tax credits, meaning that a family’s entitlement is payable even
if it exceeds the family’s tax liabilities.
Child tax credit (CTC) provides means-tested support for families with
children as a single integrated credit paid on top of child benefit. Families
are eligible for CTC if they have at least one child aged under 16, or aged
16–19 and in full-time non-advanced education (such as A levels) or
approved training. CTC is made up of a number of elements: a family
element of £545 per year, a child element of £2,780 per child per year, a
disabled child element worth £3,140 per child per year (payable in
addition to the child element) and a severely disabled child element worth
£1,275 per child per year (payable in addition to the disabled child
element). Entitlement to CTC does not depend on employment status –
both out-of-work families and lower-paid working parents are eligible for
it – and it is paid directly to the main carer in the family (nominated by the
family itself).
Working tax credit (WTC) provides in-work support for low-paid working
adults with or without children. It consists of a basic element worth £1,960
per year, with an extra £2,010 for couples and lone parents (i.e. everyone
except single people without children). Single claimants working at least
30 hours a week are entitled to an additional £810 payment, as are couples
with at least one child who jointly work at least 30 hours with one working
at least 16 hours. Lone parents, couples where at least one partner is
entitled to carer’s allowance, workers over 60 and workers with a
disability are eligible for WTC provided at least one adult works 16 or
more hours per week. Couples with children are eligible if they jointly
work at least 24 hours per week, with one partner working at least 16
hours per week. For workers aged under 60 without children or a
disability, at least one adult must be aged 25 or over and working at least
30 hours per week to be eligible. There are supplementary payments for
disability. In addition, for families in which all adults work 16 hours or
more per week, there is a childcare credit, worth 70% of eligible childcare
expenditure of up to £175 for families with one child or £300 for families
with two or more children (i.e. worth up to £122.50 or £210). The
childcare credit is paid directly to the main carer in the family. The rest of
WTC is paid to a full-time worker (two-earner couples can choose who
© Institute for Fiscal Studies, 2016
12
receives it); originally, this was done through the pay packet where
possible, but this proved rather burdensome for employers, and so since
April 2006 all WTC has been paid directly to claimants.
A means test applies to child tax credit and working tax credit together.
Currently, families with pre-tax family income below £6,420 per year
(£16,105 for families eligible only for CTC) are entitled to the full CTC and
WTC payments appropriate for their circumstances. Once family income
exceeds this level, the tax credit award is reduced by 41p for every £1 of
family income above this level. The main WTC entitlement is withdrawn
first, followed by the childcare element of WTC, then the child and
disability elements of CTC and finally the family element of CTC. This
means that a family without any eligible childcare costs or disabilities will
exhaust their entitlement to tax credits once their total income exceeds
around £24,200 if they have one child, around £31,000 if they have two
children or around £37,750 if they have three children.
HMRC paid out £28.5 billion in tax credits in 2015–16, of which
£22.4 billion was CTC and £6.1 billion WTC. Of this, £2.4 billion is counted
as negative taxation in the National Accounts and £25.8 billion is classified
as public expenditure. 16 However, many families are paid more (and some
less) than their true entitlement over the year, mostly because of
administrative errors or because family circumstances changed to reduce
their entitlement (e.g. spending on childcare fell) and HMRC did not find
out early enough (or did not respond quickly enough) to make the
necessary reduction in payments for the rest of the year. The scale of this
problem has been reduced since the first two years of operation of CTC
and WTC, but HMRC still overpaid between £1.26 billion and £1.48 billion
(and underpaid between £0.17 billion and £0.22 billion) in 2014–15. 17,18
16
Source: HM Revenue & Customs, Annual Report and Accounts 2015–16, 2016,
/>08/HMRC_Annual_Report_and_Accounts_2015-16-web.pdf.
17
Source: HM Revenue & Customs, ‘Child and working tax credits: annual error and
fraud statistics 2014-15’, />18
For more on the operational problems with tax credits and attempts to solve them,
see M. Brewer, ‘Tax credits: fixed or beyond repair?’, in R. Chote, C. Emmerson, R.
Harrison and D. Miles (eds), The IFS Green Budget: January 2006, IFS Commentary
C100, 2006, />© Institute for Fiscal Studies, 2016
13
As at April 2016, 4.4 million families containing 7.4 million children were
receiving tax credits (or the equivalent amount in out-of-work benefits). Of
these, 2.0 million receive just child tax credit, 0.5 million receive just
working tax credit and 1.9 million receive both. 19
The government is in the process of replacing tax credits (and other
means-tested benefits for those of working age) with a unified payment
called universal credit, though roll-out of this system has been persistently
delayed. 20
3.2 National Insurance contributions (NICs)
National Insurance contributions act like a tax on earnings, but their
payment entitles individuals to certain (‘contributory’) social security
benefits. 21 In practice, however, contributions paid and benefits received
bear little relation to each other for any individual contributor, and the
link has weakened over time. Some contributions (18.7% of the total in
2016–17 22) are allocated to the National Health Service; the remainder are
paid into the National Insurance Fund. The NI Fund is notionally used to
finance contributory benefits; but in years when the Fund was not
sufficient to finance benefits, it was topped up from general taxation
revenues, and in years when contributions substantially exceed outlays (as
they have every year since the mid 1990s), the Fund builds up a surplus,
largely invested in gilts: the government is simply lending itself money.
These exercises in shifting money from one arm of government to another
19
HM Revenue & Customs, ‘Child and working tax credits statistics, April 2016’, 2016,
/>72/cwtc-main-Apr16.pdf.
20
For more details on universal credit, see A. Hood and A. Norris Keiller, ‘A survey of
the UK benefit system’, IFS Briefing Note BN13, 2016,
/>21
For details of contributory benefits, see A. Hood and A. Norris Keiller, ‘A survey of
the UK benefit system’, IFS Briefing Note BN13, 2016,
/>22
Source: Appendix 4 of Government Actuary’s Department, Report by the
Government Actuary on: the Draft Social Security Benefits Up-Rating Order 2016;
and the Draft Social Security (Contributions) (Limits and Thresholds Amendments and
National Insurance Funds Payments) Regulations 2016, 2016,
/>30/53430_GA_UpRating_Report_2016_Accessible.pdf.
© Institute for Fiscal Studies, 2016
14
maintain a notionally separate Fund, but merely serve to illustrate that NI
contributions and NI expenditure proceed on essentially independent
paths. The government could equally well declare that a fifth of NICs
revenue goes towards financing defence spending, and no one would
notice the difference.
In 2016–17, NICs are forecast to raise £126.5 billion, the vast majority of
which will be Class 1 contributions. Two groups pay Class 1 contributions:
employees under the state pension age as a tax on their earnings (primary
contributions) and employers as a tax on the people they employ
(secondary contributions). 23 Class 1 contributions for employers and
employees are related to employee earnings (including employee, but not
employer, pension contributions), subject to an earnings floor. Until 1999,
this floor was the lower earnings limit (LEL). In 1999, the levels at which
employees and employers started paying NI were increased by different
amounts. The resulting two floors were named, respectively, the primary
threshold (PT) and the secondary threshold (ST). The LEL was not
abolished, but became the level of income above which individuals are
entitled to receive social security benefits previously requiring NI
contributions. The rationale was that individuals who would have been
entitled to these benefits before 1999 should not lose eligibility because of
the overindexation of the NI earnings floor. Between 2001–02 and 2007–
08, the PT and ST were aligned at the level of the income tax personal
allowance, but further reforms resulted in this alignment being broken.
Employee NICs are paid at a rate of 12% on any earnings between the PT
(£155 per week in 2016–17) and the upper earnings limit (UEL, £827 in
2016–17) and at 2% on earnings above the UEL. Employer NICs are paid at
a flat rate of 13.8% on earnings above the ST (set at £156 per week in
2016–17), with employers entitled to a rebate of £3,000 or their total
employer NICs liability, whichever is lower. Since April 2015, employer
23
From April 2017, an additional tax on employers’ pay bills – the apprenticeship levy –
will be introduced. Unlike employer NICs, this will be charged at the company (rather
than individual) level, at a rate of 0.5% with an allowance of £15,000 (so only
companies with a total pay bill above £3 million will pay). The proceeds of the levy are
to be spent on funding apprenticeships, and companies will be able to reduce their
liability through spending on apprenticeship training. The precise details are still to be
announced.
© Institute for Fiscal Studies, 2016
15
NICs for employees under the age of 21 are charged only on earnings
above the UEL.
Previously, reduced rates of NICs were available for those who had
contracted out of the state second pension (formerly the State EarningsRelated Pension Scheme, SERPS) and instead belonged to a recognised
defined benefit private pension scheme. However, the Pensions Act 2014
replaced the two-tier system with a single flat-rate pension, and
accordingly the option of contracting out was removed. From April 2016,
any employees previously contracted out had their NICs increased to the
standard rate.
Table 2 summarises the Class 1 contribution structure for 2016–17.
The self-employed pay two different classes of NI contributions – Class 2
and Class 4. Class 2 contributions are paid at a flat rate (£2.80 per week in
2016–17) by those whose earnings (i.e. profits, since these people are selfemployed) exceed the small profits threshold of £5,965. Class 4
contributions are paid at 9% on any profits between the lower profits limit
(£8,060 per year in 2016–17) and the upper profits limit (£43,000 per
year in 2016–17), and at 2% on profits above the upper profits limit. 24
This regime for the self-employed is much more generous than the Class 1
regime, and the self-employed typically pay far less than would be paid by
employee and employer combined.
Table 2. National Insurance contribution Class 1 rates, 2016–17
Band of weekly earnings (£)
Employee NICs (%)
Employer NICs (%)
0–155/156 (PT/ST)
0
0
155/156–827 (UEL)
12
13.8a
Above 827
2
13.8
a
0 for under-21s.
Note: Rates shown are marginal rates, and hence apply to the amount of weekly earnings within
each band.
Source: HM Revenue & Customs, />
24
From April 2018, Class 2 NICs will be abolished, and so the self-employed will only
pay Class 4 NICs if they pay any NICs at all. The government intends to reform Class 4
NICs after consultation to ensure that self-employed individuals continue to build
entitlement to the state pension and other contributory benefits.
© Institute for Fiscal Studies, 2016
16
Class 3 NI contributions are voluntary and are usually made by UK citizens
living (but not working) abroad in order to maintain their entitlement to
benefits when they return. Class 3 contributions are £14.10 per week in
2016–17.
3.3 Value added tax (VAT)
VAT is a proportional tax paid on all sales and is expected to raise
£120.1 billion in 2016–17. Before passing the revenue on to HMRC,
however, firms may deduct any VAT they paid on inputs into their
products; hence it is a tax on the value added at each stage of the
production process, not simply on all expenditure. The standard rate of
VAT has been 20% since 4 January 2011; previously, it was 17.5%. A
reduced rate of 5% applies to domestic fuel and power, women’s sanitary
products, children’s car seats, contraceptives, certain residential
conversions and renovations, certain energy-saving materials, and
smoking cessation products. A number of goods are either zero-rated or
exempt. Zero-rated goods have no VAT levied upon the final good, and
firms can reclaim any VAT paid on inputs as usual. Exempt goods have no
VAT levied on the final good sold to the consumer, but firms cannot
reclaim VAT paid on inputs; thus exempt goods are in effect liable to lower
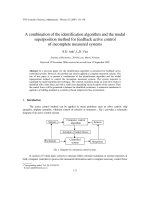
rates of VAT than standard-rated goods. Table 3 lists the main categories
of goods that are zero-rated, reduced-rated and exempt, together with
estimates of the revenue forgone by not taxing them at the standard rate in
2015–16.
Only firms whose sales of non-exempt goods and services exceed the VAT
registration threshold (£83,000 in 2016–17) need to pay VAT. Since April
2002, small firms (defined as those with sales of no more than £230,000
including VAT, in 2016–17) have had the option of using a simplified flatrate VAT scheme. 25 Under the flat-rate scheme, firms pay VAT at a single
rate on their total sales and give up the right to reclaim VAT on inputs. The
flat rate, which varies between 4% and 14.5% depending on the industry,
is intended to reflect the average VAT rate in each industry, taking into
account recovery of VAT on inputs, zero-rating and so on. The intention
was that, while some eligible firms would pay more VAT and some would
25
Firms must have sales of under £150,000 (excluding VAT) to join the scheme, but
having joined they can remain in it unless their sales exceed £230,000 (including VAT).
© Institute for Fiscal Studies, 2016
17
Table 3. Estimated costs of zero-rating, reduced-rating and exempting goods and
services for VAT revenues, 2015–16
Estimated cost
(£m)
Zero-rating of:
Food
17,400
Construction of new dwellings*
11,400
Domestic passenger transport
4,750
International passenger transport*
350
Books, newspapers and magazines
1,700
Children’s clothing
1,950
Water and sewerage services
2,300
Drugs and supplies on prescription
3,400
Supplies to charities*
300
Certain ships and aircraft
450
Vehicles and other supplies to disabled people
900
Cycle helmets
20
Reduced rate for:
Domestic fuel and power
4,800
Women’s sanitary products
45
Contraceptive products
10
Children’s car seats
20
Smoking cessation products
20
Energy-saving materials*
100
Certain residential conversions and renovations*
300
Exemption of:
Rent on domestic dwellings*
4,600
Supplies of commercial property*
200
Education*
3,950
Health services*
3,200
Postal services
150
Burial and cremation
250
Finance and insurance*
5,300
Betting and gaming and lottery duties*
1,900
Cultural admission charges*
35
Small traders below the turnover limit for VAT registration*
Total
1,600
71,400
* These figures are particularly tentative and subject to a wide margin of error.
Note: The figures for all reduced-rate items are estimates of the cost of the difference between
the standard rate of VAT and the reduced rate of 5%.
Source: />and />
© Institute for Fiscal Studies, 2016
18
pay less by using the flat-rate scheme, all would gain from not having to
keep such detailed records and calculate VAT for each transaction
separately. But, in practice, it is not clear how great the administrative
savings are, since firms must keep similar records for other purposes and
many now make the extra effort of calculating their VAT liability (at least
roughly) under both the standard scheme and the flat-rate scheme in
order to decide whether it is worth joining (or leaving) the flat-rate
scheme.
3.4 Other indirect taxes
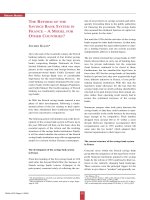
Excise duties
Excise duties are levied on three major categories of goods – alcoholic
drinks, tobacco and road fuels. They are levied at a flat rate (per pint, per
litre, per packet etc.); tobacco products are subject to an additional ad
Table 4. Excise duties, April 2016
Good
Duty
(pence)
Total duty
as a % of
price
Total tax
as a % of
pricea
Packet of 20 cigarettes:
specific duty
392.8
ad valorem (16.5% of retail price)
152.6
59.0
75.6
Pint of beer
40.7
13.6
30.3
Wine (75cl bottle)
208.4
48.6
65.3
Spirits (70cl bottle)
774.5
47.6
64.2
Unleaded petrol (litre)
58.0
54.4
71.1
Diesel (litre)
58.0
54.2
70.9
a
Includes VAT.
Note: Assumes beer (bitter) at 3.9% abv, still wine exceeding 5.5% but not exceeding 15% abv,
and spirits (whisky) at 40% abv.
Source: Duty and VAT rates from HMRC, Prices – cigarettes and beer from
Office for National Statistics, Dataset: Consumer Price Inflation,
/>wine and spirits from HM Revenue & Customs, Alcohol Factsheet 2012-13,
/>uprated to April 2016 prices from 2012 prices using wines and spirits RPI sub-index from Office
for National Statistics, Dataset: Consumer Price Inflation,
/>petrol and diesel from table 4.1.1 of Department for Business, Energy & Industrial Strategy,
Monthly and annual prices of road fuels and petroleum products,
/>
© Institute for Fiscal Studies, 2016
19