THE RELATIONSHIPS OF TAXONOMIC AND STRUCTURAL ATTRIBUTES ON ABOVE GROUND CARBON BIOMASS OF TROPICAL DRY FORESTS IN PHOU KHAO KHOUAY NATIONAL PARK, LAOS - Full 10 điểm
Bạn đang xem bản rút gọn của tài liệu. Xem và tải ngay bản đầy đủ của tài liệu tại đây (727.16 KB, 11 trang )
Silviculture & Forest Inventory-Planning
THE RELATIONSHIPS OF TAXONOMIC AND STRUCTURAL
ATTRIBUTES ON ABOVE GROUND CARBON BIOMASS OF TROPICAL
DRY FORESTS IN PHOU KHAO KHOUAY NATIONAL PARK, LAOS
Khamphet Phomphoumy1,2, Cao Thi Thu Hien1, Nguyen Hong Hai1*
1
Vietnam National University of Forestry
National University of Laos
2
/>
ABSTRACT
Forest ecosystems play an integral role in climate regulation through carbon sequestration and storage. Tropical
forests in Laos have undergone major degradation which threatened the standing biomass and carbon
sequestration potential of these forests, apart from altering the dynamics of the ecosystem. In this study, species
diversity and forest structure were assessed through 32 of 0.25-ha study plots representing 3 major forest types
in Phou Khao Khouay Nation Park, Laos. The findings found a total of 5,477 individuals, 188 species belonging
to 57 families. H. pierrei was the most dominant tree species (IVI =9.29%) among 138 species in DEF; A. grandis
and L. fenestratus were the most co-domimant species (IVI=8.57%) among 126 species of MDF and P. merkusii
covered the grestest IVI (20.02%) among 54 species in MCF. Individual tree distribution was inversed J-shape
in all forest types suggesting good regeneration and recruitment potential. Significant differences of taxonomic
and structural between 3 forest types showed through Kruskal-Wallis test with p-value < 0.05. Above ground
carbon biomass decreased with decreasing species richness, basal area and volume through forest types,
specifically 184.00±66.79 Mg/ha in DEF; 107.57±7.90 Mg/ha in MDF and 110.99±7.69 Mg/ha in MCF.
Taxonomic and structural attributes contributed positive effects on above ground carbon biomass. Biodiversity
conservation should be a key component of the UN Reducing Emission from Deforestation and Degradation
strategy (REDD+).
Keywords: carbon biomass, REDD+, species diversity, tree size structure, tropical dry forest.
1. INTRODUCTION
Tropical forests cover 7% of the earth’s land
surface and constitute more than haft of the
world tree species [1]. Moreover, tropical
forests provide many benefits to human
including material products (timbers, water,
foods, medicines, raw materials, etc.) and
protection functioning such as shelter, natural
hazards prevention, and ecosystem services
such as carbon sequestration and climate
regulation [2]. They are often referred as the
major carbon sink and have high standing
biomass and greater productivities [3], however
these forests have been currently disappearing
at an alarming rate. Tropical forest degradation
in Laos is caused by illegal logging, agricultural
extension, forest fires and infrastructure
development leading to negative impact on
forest ecosystems [4].
*Corresponding author:
Recent studies suggested that forest structure
is important for understanding the role of
species coexistence and long term ecological
processes in uneven aged natural forest
ecosystems [5]. Structure and density of major
canopy tree species can help to understand
status of regeneration of species as well as
management history and ecology of the forest
[6]. Stand structure and species composition
assist to understand forest ecosystems and
biodiversity [7]. To characterize complexity of
forest structure, the floristic composition,
diversity and vegetation structure are key
elements [8].
The UN Reducing Emission from
Deforestation and Degradation (REDD+) aims
to conserve carbon storage of tropical forest
while
safeguarding
biodiversity
[9].
Importantly, an higher biodiversity enhances
carbon sequestration and storage [10]. Forest
JOURNAL OF FORESTRY SCIENCE AND TECHNOLOGY NO. 15 (2023)
27
Silviculture & Forest Inventory-Planning
functioning may be determined not only by
species identity of the vegetation but also by
structural attributes and differed among forest
types [9]. The roles of biodiversity in ecosystem
properties, ecological processes and services
have been emphasized in previous studies [9,
11-13]. Specifically, species richness is
assumed to enhance productivity via: (i) niche
complementary where species have different
niches and are able to access more of the
available environmental resources or facilitate
each other, therefore facilitating overall
productivity [12]; (ii) the selection effect, as by
chance a very productive species contributing
major part of stand bimomass is contained in the
community [13]; and (iii) the insurance effect,
as one species contributes more to ecosystem
productivity in one year and another species in
another year [13]. These hypotheses about the
relationship between species richness and
productivity could also apply to standing carbon
biomass, as higher productivity may lead to
faster accumulation of carbon biomass [14].
Not only taxonomic attributes but also
structural attributes such as stem diameter, tree
height, tree density determine biomass, resource
capture and productivity. Tree structure
contributes directly to stand carbon biomass but
variation in structure, for example different
forest types, may also enhance light capture and
carbon gain [9]. Structural properties may vary
more strongly than taxonomic attributes within
forest community and between forest
communities, therefore they may have a larger
direct impact on biomass and ecosystem
processes. The question is different taxonomic
and structural attributes of forest types may
explain for variation in above ground biomass
and carbon storage [9].
In this study, we aim to assess the
relationships of the taxonomic attributes (such
as species richness and diversity, community
composition) and structural attributes (such as
diameter, height, volume and above ground
28
biomass) of the three major forest types in Phou
Khao Khouay National Park of Laos. We
address a main question: what are the
relationships of taxonomic and structural
attributes on above ground carbon biomass in
the three major forest types including dry
evergreen forest, mixed deciduous forest and
mixed coniferous forest in the study area.
2. RESEARCH METHODOLOGY
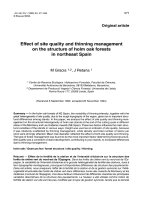
2.1. Study area
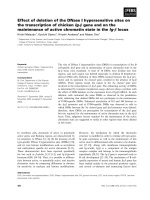
Phou Khao Khouay (PKK) National Park is
one of 24 sites in Laos legally established since
1993, with total area of 191,942 ha. PKK
national park is located from 18°14’ - 18°32’ N
and 102°38’ - 102°59’ E (Figure 1). Forest types
in PKK national park are classified to the mixed
deciduous forest - MDF, dominated by
Meliaceae; dry evergreen forest - DEF,
dominated by Lythaceae; evergreen forest -EF,
dominated by Dipterocarpaceae and mixed
coniferous forest -MCF, mainly Pinaceae [4].
Elevation varies from 100 m to nearly 1,700
m a.s.l [4]. The average annual rainfall in PKK
is about 1,769 mm and divided into two seasons.
The rainy season lasts from April to October
with the highest rainfall usually in August of
about 494.2 mm and the average temperature is
from 20.6°C - 31.8°C [15]. The dry season lasts
from November to March with the lowest
rainfall of about 2.5 mm in February and the
average temperature is around 16.8°C - 24.6°C.
The national park is covered by typical tropical
red to brown soils of orthic acrisols and lithosols
with textures from sandy to sandy loam and
poorly organic matter [4].
2.2. Data collection
In this study, data was collected from 32
permanent plots, these plots were established by
the Institude Recherche pour le Development
(IRD) France and Faculty of Forestry Science
(FFS), National University of Laos (NUoL) in
2009 [4, 16]. The plots vary in different
elevations from 390 m to 816 m and cover all
three main forest types (Figure 1). Each plot of
JOURNAL OF FORESTRY SCIENCE AND TECHNOLOGY NO. 15 (2023)
Silviculture & Forest Inventory-Planning
0.25 ha (50 x 50 m) was divided into 25 subplots
of 10 by 10 m. In 2022, all tree individuals with
diameter at breast height - dbh at 1.3 m ≥ 5 cm
were identified and recorded. Dbh of tree
species were measured by using diameter tape
tree height by Blume-leiss Hypsometer; relative
coordinates of trees were determined by the
Laser distance measurer Leica Disto D2 and
compass. Tree specimens were collected to
confirm identification at herbarium of Faculty
of Forestry Science, National University of
Laos.
Figure 1. Maps of PKK national park and the location of sample plots
2.3. Data analysis
Tree basal area (BA, m2): was calculated by:
𝐵𝐵𝐵𝐵 =
𝜋𝜋𝜋𝜋𝜋𝜋ℎ2
4
where, dbh is Diameter at breast height (cm).
Tree volume (m3): was estimated by 0.45 x
H x BA [17], where, H is total tree height (m).
Species composition: was explained by
Important Value Index (IVI) calculated by
relative density (RD), relative dominance
(RDo) and relative frequency (RF) for each
species as follows [18]:
𝑅𝑅𝑅𝑅 + 𝑅𝑅𝑅𝑅𝑅𝑅 + 𝑅𝑅𝑅𝑅
𝐼𝐼𝐼𝐼𝐼𝐼 =
3
Relative Density was calculated as follows:
𝑛𝑛
𝑅𝑅𝑅𝑅 = � 𝑁𝑁𝑖𝑖 � × 100%
where,
ni = number of individuals of species i;
N = total number of individuals in the entire
sampled population.
Relative Dominance was calculated as
𝐵𝐵𝐵𝐵
follows: 𝑅𝑅𝑅𝑅𝑅𝑅 = �∑ 𝐵𝐵𝐵𝐵𝑖𝑖 � × 100%
𝑛𝑛
where,
BAi = Basal area of all species individuals i;
BAn = Stand basal area.
Relative Frequency was calculated as
𝐹𝐹
follows: 𝑅𝑅𝑅𝑅 = �𝐹𝐹 𝑖𝑖 � × 100%
𝑛𝑛
where,
Fi = Frequency of species i encountered;
Fn = Total frequency of all species.
Species diversity: was described by diversity
indices as follows:
Shannon’s index (H’) refers to species
diversity and is calculated as follows [18]:
JOURNAL OF FORESTRY SCIENCE AND TECHNOLOGY NO. 15 (2023)
29
Silviculture & Forest Inventory-Planning
𝐻𝐻 ′ = − � 𝑝𝑝𝑝𝑝 × 𝑙𝑙𝑙𝑙𝑙𝑙𝑙𝑙
where, pi = the proportion of abundance
(individuals) of the ith species.
Simpson’s index (D) refers to species
dominance calculated by equation as follows
[18]:
∑ 𝑛𝑛(𝑛𝑛 − 1)
𝐷𝐷 = 1 −
𝑁𝑁(𝑁𝑁 − 1)
where,
n = abundance contributed by by species;
N = total species abundance.
Pielou’s evenness index (J) refers to the
degree of relative dominance of each species
calculated by equation as follows [19]:
𝐻𝐻′
𝐽𝐽 =
ln(𝑆𝑆)
where,
H’ = Shannon-Wiener index;
S = species richness.
𝑛𝑛
Species richness; 𝑆𝑆 = 𝑎𝑎 × �1 + 𝑎𝑎�
Bray-Curtis index (CN) (Bray and Curtis,
1947), a similarity coefficient, is used to
measure similarity between forest types.
2𝑗𝑗𝑗𝑗
𝐶𝐶𝑁𝑁 =
𝑎𝑎𝑎𝑎 + 𝑏𝑏𝑏𝑏
where,
CN = the Bray-Curtis index;
aN=individual numbers of forest type A;
bN=individual numbers of forest type B;
jN= the sum of less individual numbers of
each species common in forest types A and B.
Relationship between height and diameter:
We used eleven theoretical models embedded in
IBM SPSS version 20 software, including:
(1) Linear: y = b0 + b1*x;
(2) Logarithmic: y = b0 + b1*ln(x);
(3) Inverse: y = b0 + b1/x;
(4) Quadratic: y = b0 + b1*x + b2*x2;
(5) Cubic: y = b0 + b1*x + b2*x2 + b3*x3;
(6) Power: y = b0*xb1 or ln(y) = ln(b0) +
b1*ln(x); (7) Compound: y = b0*b1x or ln(y) =
ln(b0) + [ln(b1)]*x;
(8) S: y = exp(b0 + b1/x) or ln(y) = b0 + b1/x;
(9) Logistic: y = 1/[(1/u) + (b0*b1x)] or ln[(1/y)
30
+ (1/u)] = ln(b0 + [ln(b1)]*X;
(10) Growth: y = exp(b0 + b1*x) or ln(y) = b0 +
b1*X;
(11) Exponential: y = b0*exp(b1*X) or ln(y) =
ln(b0) + b1*X;
The Akaike Information Criteria (AIC) may
aid in the selection of model. Lower values for
AIC imply a better fit, adjusted for number of
parameters. All diversity indices and diameterheight relationships were analyzed by using
PAST 4 (Paleontological Statistics) software
( />urces/past/).
Above Ground Biomass (AGB) of three
forest types was estimated using allometric
model for pan-tropical forests [20], as follows:
𝐴𝐴𝐴𝐴𝐴𝐴𝑒𝑒𝑒𝑒𝑒𝑒 = 0.0673 × (𝜌𝜌𝐷𝐷2 𝐻𝐻)0.976
where, D is dbh (cm), H is height (m) and p
is wood density in (g cm3). Wood density (WD)
data were compiled from published sources
[21]. Subsequently, AGB was converted to
above ground carbon biomass -AGCB (Mg/ha)
by multiplying AGB with a conversion factor of
0.47 assuming that 47% of the total tree biomass
is C biomass [22].
The feature differences among three forest
types for each variable such as density; basal
area; diameter class and aboveground biomass
were evaluated by using a nonparametric test
(Kruskal-Wallis test) after verification for the
assumptions of normality and equal variances.
Mann-Whitney test was performed for
comparison of differences between the two
forest types. The statistical analyses were
performed by using IBM SPSS version 20
software.
3. RESULTS
3.1. Taxonomic attributes
A total of 5,477 individuals with stem
diameter at breast height (dbh) of ≥ 5 cm
representing 188 different species and 57
families were recorded in 32 permanent plots of
the 3 forest types (Table 1) including dry
evergreen forest (DEF), mixed deciduous forest
(MDF), and mixed coniferous forest (MCF).
JOURNAL OF FORESTRY SCIENCE AND TECHNOLOGY NO. 15 (2023)
Silviculture & Forest Inventory-Planning
Table 1. Main characteristics of three forest types (mean±standard deviation)
Forest types
Variables
DEF
MDF
MCF
Number of plots
18
8
6
Number of species
138
126
54
Number of families
52
51
36
Density (trees/ha)
705±9.14
754±7.18
530±16.7
Shannon-Wiener (H’)
4.95±0.27
5.08±0.25
4.66±0.27
Simpson (D)
0.99±0.003
0.99±0.002
0.99±0.003
Evenness (J)
0.83±0.07
0.87±0.05
0.83±0.03
DBH (cm)
19.07±14.33
17.86±11.31
20.34±14.20
Height (m)
13.71±7.75
11.95±5.48
12.80±6.98
Basal area (m2/ha)
Volume (m3/ha)
AGB (Mg/ha)
AGCB (Mg/ha)
31.50±5.71
358.81±111.54
368.01±133.59
184.00±66.79
In 18 plots of DEF, a total of 3,173
individuals was counted with 176 ± 42
trees/plot belonging to 138 species (28 ± 7) and
52 families (19 ± 4) (table 2). The most
dominant tree species in the DEF were H.
pierrei with IVI value of 9.29%, H. ilicifolia
(4.60%), G. nervosa (4.30%), S. wallichii
(4.12%), A. gaudichaudiana (3.86%), and C.
formosum (3.25%) and 132 other species
belonged to 46 different families (table 2).
A total of 1,509 individuals (188 ± 35), 126
species (33 ± 10) and 51 families (22 ± 6) in
eight plots MDF (Table 2). Dominant tree
26.47±1.19
236.85±15.20
215.14±15.81
107.57±7.90
species were A. grandis (4.85%), L. fenestratus
(3.72%), L. calyculata (2.72%), S. syzygioides
(2.62%), S. cinereum (2.51%) and A.
gaudichaudiana (2.36%) and 120 other species
belonging to 46 different families (table 2).
There were 795 individuals (132 ± 35), 54
species (16 ± 4) and 36 families (13 ± 4) in six
plots MCF (table 2). The dominant species were
P. merkusii (20.02%), S. wallichii (8.28%), D.
elatum (7.80%), D. obtusifolius (7.75%), S.
cinereum (5.41%) and S. norounhae (4.41%)
and 48 other species belonging to 31 different
families (Table 2).
Table 2. The species composition of three forest types
RD
RDo
Forest
Dominant species
Family
type
(%)
(%)
Hopea pierrei
Dipterocarpaceae
8.76
17.76
Hydnocarpus
Flacourtiaceae
5.89
5.00
ilicifolia
Gironniera nervosa Cannabaceae
3.81
7.34
Schima wallichii
Theaceae
5.36
4.27
Alphonsea
Annonaceae
5.61
3.82
gaudichaudiana
Cratoxylum
Hypericaceae
4.79
3.02
formosum
Syzygium
Myrtaceae
2.55
3.80
syzygioides
Syzygium cinereum
Myrtaceae
2.93
2.27
Vatica harmandiana Dipterocarpaceae
2.33
2.29
Nephelium
Sapindaceae
2.84
1.97
hypoleucum
128 other species
44 other families
55.12
48.48
Dry evergreen forest
25.61±0.46
253.39±20.73
221.99±15.39
110.99±7.69
RF
(%)
1.36
IVI
(%)
9.29
2.92
4.60
1.75
2.72
4.30
4.12
2.14
3.86
1.95
3.25
2.53
2.96
2.72
2.92
2.64
2.51
2.33
2.38
76.55
60.08
JOURNAL OF FORESTRY SCIENCE AND TECHNOLOGY NO. 15 (2023)
31
Silviculture & Forest Inventory-Planning
Mixed coniferous forest
Mixed deciduous forest
Forest
type
Dominant species
Aglaia grandis
Lithocarpus
fenestratus
Lagerstroemia
calyculata
Syzygium
syzygioides
Syzygium cinereum
Alphonsea
gaudichaudiana
Alstonia scholaris
Aralia chinensis
Hydnocarpus
ilicifolia
Cratoxylum
formosum
116 other species
Pinus merkusii
Schima wallichii
Dacrydium elatum
Dipterocarpus
obtusifolius
Syzygium cinereum
Schima noronhae
Lithocarpus
fenestratus
Garcinia multiflora
Parinari anamensis
Syzygium lineatum
44 other species
RD
(%)
4.04
RDo
(%)
8.09
RF
(%)
2.41
IVI
(%)
4.85
Fagaceae
5.37
3.72
2.07
3.72
Lythraceae
4.37
2.74
1.03
2.72
Myrtaceae
2.52
3.27
2.07
2.62
Myrtaceae
2.58
2.86
2.07
2.51
Annonaceae
3.11
2.25
1.72
2.36
Apocynaceae
Araliaceae
1.52
1.59
3.72
3.26
1.72
2.07
2.32
2.31
Flacourtiaceae
2.45
2.21
2.07
2.25
Hypericaceae
2.32
2.91
3.18
2.20
42 other families
Pinaceae
Theaceae
Podocarpaceae
70.11
15.47
9.69
12.08
64.97
38.47
9.02
9.30
81.38
6.12
6.12
2.04
72.15
20.02
8.28
7.80
Dipterocarpaceae
9.43
9.72
4.08
7.75
Myrtaceae
Theaceae
6.92
6.54
3.18
2.62
6.12
4.08
5.41
4.41
Fagaceae
3.02
2.18
4.08
3.09
2.26
2.01
1.38
31.19
3.06
1.19
0.91
20.36
1.02
3.06
3.06
60.20
2.11
2.09
1.78
37.25
Family
Meliaceae
Clusiaceae
Chrysobalanaceae
Myrtaceae
28 other families
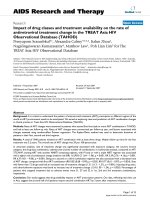
In terms of the Bray-Curtis index (Figure 2),
the most similar was found in the DEF with
82.10% indicating that this forest type was the
major forest type in the study area. MDF
covered 72.30% and MCF was 55.57%
similarity of species richness, respectively.
These results showed a significant difference in
species composition of the forest types in the
PPK national park.
MCF
MDF
DEF
ALL
100
80
60
40
20
0
Bray-Curtis similarity (%)
Figure 2. Species similarity of three forest types
32
JOURNAL OF FORESTRY SCIENCE AND TECHNOLOGY NO. 15 (2023)
Silviculture & Forest Inventory-Planning
The Kruskal-Wallis tests showed that species
composition and diversity were significantly
different among 3 forest types, except species
evenness (Table 3), specifically containing the
mean density (Chi-Square = 7.124, Sig. = 0.028
< 0.05), number of species (Chi-Square
=11.088, Sig. = 0.004 < 0.05), number of family
(Chi-Square = 9.435, Sig. = 0.009 < 0.05),
Shannon-Wiener index (Chi-Square = 8.101,
Sig. = 0.017 < 0.05) and Simpson index (ChiSquare = 6.434, Sig. = 0.040< 0.05).
Table 3. Results of Kruskal-Wallis test among three forest types
Properties
Chi-Square
Asymp. Sig
Density (trees/plot)
7.124
0.028*
Number of species
11.088
0.004*
Number of family
9.345
0.009*
Shannon-Wiener (H’)
8.101
0.017*
Simpson (D)
6.434
0.040*
Evenness (J)
2.918
0.232
DBH (cm)
2.297
0.317
Height (m)
6.893
0.032*
Basal area (m2/ha)
14.289
0.001*
3
Volume (m /ha)
5.372
0.068
AGB (Mg/ha)
3.372
0.185
AGCB (Mg/ha)
2.427
0.297
3.2. Structural attributes
The structural properties of three forest types
were shown in Table 1. Tree size attributes
generally decreased from DEF to MDF and
MCF, respectively. Tree diameter (DBH)
slightly differed among forest types, it was
19.07±14.33 cm in DEF, 17.86±11.31 cm in
MDF, and 20.34±14.20 cm in MCF,
respectively. Total tree height (H) also slightly
differed among forest types, it was 13.71±7.75
m in DEF, 11.95±5.48 m in MDF, and
12.80±6.89 m in MCF. Total basal area (BA)
was highest in DEF with 31.50±5.71 m2/ha, and
it was similar in the two other types with
26.47±1.19 m2/ha in MDF and 25.61±0.46
m2/ha in MCF. The total volume varied widely
among forest types. It was 358.81±111.54
a, DEF
b, MDF
p-value
0.05
0.05
0.05
0.05
0.05
0.05
0.05
0.05
0.05
0.05
0.05
0.05
m3/ha in DEF, 236.85±15.20 m3/ha in MDF,
and 253.39±20.73 m3/ha in MCF, respectively.
The AGB estimation was differently among
forest types as well. It was 368.01±133.59
Mg/ha in DEF, 215.14±15.81 Mg/ha in MDF,
and 221.99±15.39 Mg/ha in MCF, respectively.
Above ground carbon biomass decreased from
184.00±66.79 Mg/ha in DEF to 107.57±7.90
Mg/ha in MDF and 110.99±7.69 Mg/ha in
MCF.
Structural properties among three forest
types were also significant different via
Kruskal-Wallis tests including tree height (ChiSquare = 6.893, Sig. = 0.032< 0.05), basal area
(Chi-Square = 14.289, Sig. = 0.001< 0.05),
except DBH, Volume and above ground carbon
biomass-AGCB (Table 3).
c, MCF
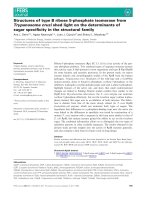
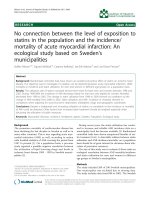
Figure 3. Tree diameter distribution of three forest types
JOURNAL OF FORESTRY SCIENCE AND TECHNOLOGY NO. 15 (2023)
33
Silviculture & Forest Inventory-Planning
All three forest types, DBH distributions
formed reverse J-shape patterns (Figure 3). In
DEF, tree DBH ranged from 5 – 137.7 cm with
mean DBH = 19.07 ± 14.32 cm and skewness
of 2.49. Similarly, tree DBH of MDF ranged
from 5.5 – 114.5 cm with mean DBH = 17.85 ±
11.31 cm and skewness = 2.93. Also, in MCF,
tree DBH ranged from 5 – 102 cm with mean
DBH = 20.34 ± 14.19 cm and skewness of 1.78.
These results indicated that number of trees
decreased with increasing DBH classes,
therefore it allows to replace removed trees by
smaller size trees through forest succession
process.
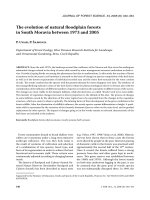
The Quadratic model was the best fit model
for diameter-height relationship of all forest
types including DEF, MDF and MCF,
respectively (Table 4). The best fit models were
selected based on the lowest Akaike
information criterion (AIC) values. The strong
relationships between diameter and height of all
forest types were shown by high coefficients
R2>0.8. The diameter-height relationships of
three forest types were presented in Figure 4.
Table 4. The relationships between diameter-height relationship of the three forest types
Parameter estimates
Forests
AIC
R2
Models
Type
a
b
c
DEF
MDF
MCF
Quadratic
Quadratic
Quadratic
a, DEF
y = -0.003312x2+0.71969x+1.8729
-0.003312
-0.0024936
-0.0024523
0.71969
0.60209
0.60746
b, MDF
1.8729
2.3089
1.9473
y = -0.0024936x2+0.60209x+2.3089
0.804
0.810
0.836
37304
8617
6343.1
c, MCF
y = -0.0024523x2+0.60746x+1.9473
Figure 5. Tree diameter-height relationship of the three forest types
4. DISCUSSION
Taxonomic attributes
In total, 5,477 individuals with dbh≥ 5 cm
belonging to 188 species and 57 families were
recorded in this study. The important value
index (IVI) showed that H. pierrei
(Dipterocarpaceae) was the dominant species in
DEF , A. grandis (Meliaceae) and L. fenestratus
(Fagaceae) were the dominant species in MDF,
and P. merkusii was the dominant species in
MCF. These results are along with findings of
previous studies in where? [23].
The individual density, species richness and
species diversity decreased from DEF (705
34
individuals/ha, 138 species and 52 families), to
MDF (754 individuals/ha, 126 species and 51
families) and MCF (530 individuals/ha, 54
species and 36 families), respectively. These
numbers were greater than reported findings of
previous studies carried out in this area [4, 16,
23]. Previous studies in the study area,
Satdichanh, Millet [16], Soukhavong, Yong
[23], Chanthalaphone [24] found in total of 145;
123; 76 species, respectively. The stand
densities of three forest types ranging from 530
trees/ha to 754 trees/ha, are greater than those
reported in this area is 467; 744 trees/ha [4, 24].
The overall stand densities of the three forest
JOURNAL OF FORESTRY SCIENCE AND TECHNOLOGY NO. 15 (2023)
Silviculture & Forest Inventory-Planning
types exhibited the reverse J-shaped diameter
class distribution, suggesting a stable
population structure. This is similar to those
reported in this area [23], in Vietnam [25],
Malaysia [26]. Moreover, in our study, the
species diversity indices, such as ShannonWiener index (H’) ranging from 4.66 to 5.08,
Simpson’s index ranging from 0.99 to 0.99,
Pielou’s evenness index (E) ranging from 0.83
to 0.87, are also greater than those reported by
Lucas et al., 2013, Chanthalaphone 2020 in the
same study area. That may be caused by our
threshold of measured dbh which was greater
than 5 cm comparing to threshold of greater
than 10 cm from their studies.
Structural attributes
In the present study, the mean basal area
(BA) of tree species varying from 25.61 to
31.50 m2/ha in 3 forest types, was lower than
other findings in Laos of 35; 38.9 m2/ha [4, 27].
The estimation of mean above ground Carbon
biomass varied widely among forest types from
107.57 Mg/ha (in MDF) to 184.00 Mg/ha (in
DEF). This may be caused by illegal logging of
local people reported by forest rangers and
missing trees found in our study plots.
The allometry of tree diameters and heights
has been receiving a great deal of attention for
long time because inaccurate estimates of tree
heights can seriously affect the estimation of
carbon stock in a forest [28]. Therefore, an
accurate diameter-height model is essential of
tree volume and biomass estimation and hence
stand level carbon stocks of forests. Developing
a diameter-height model presented for each
forest type is proved to be a suitable approach
to avoid the bias [29]. In our study, three
diameter-height models which are ….derived
from ten theoretical models and practical data
based on a lowest AIC value were proposed for
three forest types.
Carbon storage and biomass are essential
analytical aspects of forest ecosystems.
Assessment of biomass demonstrates the extent
of carbon that a forest can hold and is an
essential element for national development
planning of carbon budget [30]. Our findings
indicated a relative high C storage in PKK
forests ranging from 107.57±7.90 Mg/ha (in
MDF) to 184.00±66.79 Mg/ha (in DEF). There
were no large differences in aboveground C
biomass of PKK forests and other regions, for
example in Asian sites with 141.8 ± 15.2 Mg/ha,
Neotropical regions with 193.8 ± 12.3 Mg/ha,
and African sites with 170.1 ± 14.5 Mg/ha [31].
DEF dominated by Dipterocarpaceae and was
the richest species forest type stores highest C
biomass due to productive species facilitate
light capture and light use efficiencies in
association with complex tree size structures
[9]. In contrary, MDF had lower species
diversity and no dominant productive species
leading to lower C biomass achievement. Our
fundings support for the hypotheses of niche
complementary and the selection effects related
to the role of biodiversity in ecosystem
properties [9].
5. CONCLUSION
The research on species diversity, stand
structure and community composition of
tropical forests was conducted in Phou Khao
Khouay Nation Park, Laos. We collected data in
total of 8 ha from 32 plots 50 x 50 m (0.25 ha)
with all stems dbh ≥ 5 cm. The results showed
that a total of 5,477 individuals representing 188
different species and 57 families in 3 forest
types. Species diversity indices and quantities
of tree size structure decrease from DEF to
MDF and MCF, respectively. The majority of
forests in PKK are natural and are maintained
according to competent management plans,
which satisfy the criteria of SFM of REDD+.
We suggest that as REDD+ idea of
"Conservation of forest carbon stocks", forest
conservation is needed to encourage
biodiversity conservation in the study area.
Moreover, the third REDD+ option, sustainable
forest management (SFM), may help to build
forest carbon reserves and assure the ongoing
flow of other ecosystem services in the PKK
national park as well.
JOURNAL OF FORESTRY SCIENCE AND TECHNOLOGY NO. 15 (2023)
35
Silviculture & Forest Inventory-Planning
Acknowledgement
This research was supported by the Second
Strengthening Higher Education Project
(SSHEP), Ministry of Education and Sports of
Lao PDR. We highly appreciate to the Institude
of Recherche pour le Development France and
Faculty of Forestry Science, National
University of Laos for permission to access the
study site in permanent plots. Thanks army
rangers of the PKK National Park and students
who are from the faculty of forestry science for
their help in data collection. I would like to
thanks my families, my best friends and my
supervisors for helpful and constructive
comments for this research.
REFERENCES
[1]. Gallery, R.E. (2014). Ecology of tropical rain
forests. Ecology and the Environment. 1-22.
[2]. Batumike, R., G. Imani, B. Bisimwa, H.
Mambo, J. Kalume, F. Kavuba & A. Cuni‐Sanchez
(2022). Lomami Buffer Zone (DRC): Forest composition,
structure, and the sustainability of its use by local
communities. Biotropica. 54(2): 289-300.
[3]. Tarakeswara Naidu, M., D. Premavani, S.
Suthari & M. Venkaiah (2018). Assessment of tree
diversity in tropical deciduous forests of Northcentral
Eastern Ghats, India. Geology, Ecology, and Landscapes.
2(3): 216-227.
[4]. Lucas, C., K. Nanthavong & J. Millet (2013).
Environmental and human influence on forest
composition, structure and diversity in Laos. Journal of
Tropical Forest Science. 410-420.
[5]. Dar, A.A. &N. Parthasarathy (2022). Tree
species composition, stand structure and distribution
patterns across three Kashmir Himalayan forests, India.
Écoscience. 1-14.
[6]. Harper, J.L. (1977). Population biology of plants.
Population biology of plants; Tesfaye, G., D. Teketay, M.
Fetene & E. Beck. 2010. Regeneration of seven indigenous
tree species in a dry Afromontane forest, southern Ethiopia.
Flora-Morphology, Distribution, Functional Ecology of
Plants. 205(2): 135-143.
[7]. Su, D., D. Yu, L. Zhou, X. Xie, Z. Liu & L. Dai.
(2010). Differences in the structure, species composition
and diversity of primary and harvested forests on
Changbai Mountain, Northeast China. Journal of Forest
Science. 56(6): 285-293.
[8]. Darro, H., S. Swamy, T.K. Thakur & A. Mishra
(2020). Floristic Composition, Structure, Diversity and
Conservation Strategies for Rehabilitation of Dry
Tropical Forests in Buffer Zone of Achanakmaar
Amarkantak Biosphere Reserve (AABR), India. Int. J.
Curr. Microbiol. App. Sci. 9(4): 650-663.
36
[9]. Poorter, L., M.T. van der Sande, J. Thompson,
E.J. Arets, A. Alarcón, J. Álvarez‐Sánchez, N. Ascarrunz,
P. Balvanera, G. Barajas‐Guzmán & A. Boit (2015).
Diversity enhances carbon storage in tropical forests.
Global Ecology and Biogeography. 24(11): p. 1314-1328.
[10]. Díaz, S., A. Hector & D.A. Wardle (2009).
Biodiversity in forest carbon sequestration initiatives: not
just a side benefit. Current Opinion in Environmental
Sustainability. 1(1): 55-60.
[11]. Naeem, S., D.E. Bunker, A. Hector, M. Loreau
& C. Perrings, Biodiversity, ecosystem functioning, and
human wellbeing: an ecological and economic
perspective. 2009: OUP Oxford.
[12]. Tilman, D., P.B. Reich, J. Knops, D. Wedin, T.
Mielke & C. Lehman (2001). Diversity and productivity
in a long-term grassland experiment. Science. 294(5543):
843-845.
[13]. Loreau, M. &A. Hector (2001). Partitioning
selection and complementarity in biodiversity
experiments. Nature. 412(6842): 72-76.
[14]. Chisholm, R.A., H.C. Muller‐Landau, K. Abdul
Rahman, D.P. Bebber, Y. Bin, S.A. Bohlman, N.A.
Bourg, J. Brinks, S. Bunyavejchewin & N. Butt (2013).
Scale‐dependent relationships between tree species
richness and ecosystem function in forests. Journal of
Ecology. 101(5): 1214-1224.
[15]. Department of Meteorology and Hydrology
(2022). Report on Meteorology and Hydrology in Laos.
The climates in Phou Khao Khouay National Park, Lao
PDR, in Department of Meteorology and Hydrology, Lao
PDR.
[16]. Satdichanh, M., J. Millet, A. Heinimann, K.
Nanthavong & R.D. Harrison (2015). Using plant
functional traits and phylogenies to understand patterns
of plant community assembly in a seasonal tropical forest
in Lao PDR. PLoS One. 10(6): e0130151.
[17]. Vu Tien Hinh (1992). Forest Inventory. Vietnam
Forestry University.
[18]. Magurran, A. (2004). Measuring Biological
Diversity. Oxford: Blackwell Publishing. 256.
[19]. Pielou, E.C. (1966). The measurement of
diversity in different types of biological collections.
Journal of theoretical biology. 13: 131-144.
[20]. Chave, J., M. Réjou‐Méchain, A. Búrquez, E.
Chidumayo, M.S. Colgan, W.B. Delitti, A. Duque, T. Eid,
P.M. Fearnside & R.C. Goodman (2014). Improved
allometric models to estimate the aboveground biomass
of tropical trees. Global change biology. 20(10): 31773190.
[21]. Zanne, A., G. Lopez-Gonzalez, D. Coomes, J.
Ilic, S. Jansen, S. Lewis, R. Miller, N. Swenson, M.
Wiemann & J. Chave (2009). Global wood density
database. Dryad Identifier http. hdl. handle.
net/10255/dryad. 235.
JOURNAL OF FORESTRY SCIENCE AND TECHNOLOGY NO. 15 (2023)
Silviculture & Forest Inventory-Planning
[22]. IPCC (2006). Eggleston, HS. Buendia, Leandro
Miwa, Kyoko Ngara, Todd Tanabe, Kiyoto. IPCC
guidelines for national greenhouse gas inventories.
[23]. Soukhavong, M., L. Yong, K. Nanthavong & J.
Millet (2013). Investigation on species composition of
plant community at Tad Xai at Phou Khao Khouay
National Park, Lao PDR. Our Nature. 11(1): 1-10.
[24]. Chanthalaphone,
K.
(2020).
Structural
characteristics and plant species diversity of some natural
foerst types at Phou Khao Khouay national park, Lao
people’s democratic republic. Journal of Forestry Science
and Technology. 9: 53-63.
[25]. Nguyen Hong Hai (2016). Structure, composition
and spatial pattern sof degraded limestone forests. Journal
of Forest Science and Technology. 3: 60-68.
[26]. Ruziman, H.H., A. Ismail, K.A. Radzun, N.S.
Ishak, A.F. Zohari, M. Kusin & F. Pardi (2022). Tree
Species Diversity and Conservation Status of Keniam
Forest, Taman Negara, Pahang. in IOP Conference Series:
Earth and Environmental Science. IOP Publishing.
[27]. Sovu, T., Mulualem, P. Savadogo, P.C. Odén &
L. Xayvongsa (2009). Recovery of secondary forests on
swidden cultivation fallows in Laos. Forest ecology and
management. 258(12): 2666-2675.
[28]. Kearsley, E., T. De Haulleville, K. Hufkens, A.
Kidimbu, B. Toirambe, G. Baert, D. Huygens, Y. Kebede,
P. Defourny & J. Bogaert (2013). Conventional tree
height–diameter relationships significantly overestimate
aboveground carbon stocks in the Central Congo Basin.
Nature communications. 4(1): 2269.
[29]. Cui, K., X. Wu, C. Zhang, X. Zhao & K. von
Gadow. (2022). Estimating height-diameter relations for
structure groups in the natural forests of Northeastern
China. Forest Ecology and Management. 519: 120298.
[30]. Dar, A.A. &N. Parthasarathy (2022). Patterns
and drivers of tree carbon stocks in Kashmir Himalayan
forests: implications for climate change mitigation.
Ecological Processes. 11(1): 1-13.
[31]. Cavanaugh, K.C., J.S. Gosnell, S.L. Davis, J.
Ahumada, P. Boundja, D.B. Clark, B. Mugerwa, P.A.
Jansen, T.G. O'Brien & F. Rovero (2014). Carbon storage
in tropical forests correlates with taxonomic diversity and
functional dominance on a global scale. Global Ecology
and Biogeography. 23(5): 563-573.
QUAN HỆ GIỮA CÁC ĐẶC TRƯNG ĐA DẠNG LOÀI VÀ CẤU TRÚC VỚI
SINH KHỐI CÁC BON TRÊN MẶT ĐẤT CỦA RỪNG NHIỆT ĐỚI KHÔ
Ở VƯỜN QUỐC GIA PHOU KHAO KHOUAY, LÀO
Khamphet Phomphoumy1,2, Cao Thị Thu Hiền1, Nguyễn Hồng Hải1*
1
Trường Đại học Lâm nghiệp
Trường Đại học Quốc gia Lào
2
TÓM TẮT
Các hệ sinh thái rừng có một vài trị thiết yếu trong điều tiết khí hậu thơng qua q trình tích trữ các bon. Rừng
nhiệt đới ở Lào đang bị suy thoái đe dọa đến sinh khối cây đứng và khả năng tích trữ các bon của rừng, như là
một phần của sự biến động các hệ sinh thái rừng. Trong nghiên cứu này, đa dạng loài cây và cấu trúc quần xã
rừng được đánh giá thông qua 32 ô tiêu chuẩn 0.25-ha đại diện cho ba trạng thái rừng chủ yếu ở vườn quốc gia
Phou Khao Khouay Nation Park, Lào. Kết quả cho thấy, tổng cộng 5.477 cây thuộc 188 loài và 57 họ được ghi
nhận. H. pierrei là loài ưu thế nhất (IVI =9,29%) trong số 138 lồi của rừng thường xanh khơ (DEF); A. grandis
và L. fenestratus là đồng ưu thế nhất (IVI=8,57%) trong số 126 loài của rừng hỗn giao cây họ Dầu (MDF) và P.
merkusii chiếm ưu thế lớn nhất với IVI =20,02% trong số 54 loài của rừng hỗn giao cây lá kim (MCF). Phân bố
số cây theo đường kính có dạng chữ J ngược ở cả ba trạng thái rừng cho thấy tiềm năng tốt trong quá trình tái
sinh và bổ sung của diễn thế rừng. Sự khác biệt có ý nghĩa của đặc trưng đa dạng lồi và cấu trúc của ba trạng
thái rừng được thể hiện qua phép kiểm tra Kruskal-Wallis với p-value < 0,05. Sinh khối các bon trên mặt đất
giảm cùng với sự suy giảm của độ nhiều loài, tiết diện ngang và trữ lượng gỗ, với 184,00±66,79 Mg/ha ở DEF;
107,57±7,90 Mg/ha ở MDF và 110,99±7,69 Mg/ha ở MCF. Các đặc trưng đa dạng lồi và cấu trúc có ảnh hưởng
theo chiều thuận với sinh khối các bon trên mặt đất ở khu vực nghiên cứu. Bảo tồn đa dạng sinh học được coi là
vấn đề then chốt của chiến lược giảm phát thải từ phá rừng và suy thoái rừng (REDD+) của liên hợp quốc.
Từ khóa: cấu trúc kích thước, đa dạng lồi, REDD+, rừng nhiệt đới khô, sinh khối các bon.
Received
Revised
Accepted
: 03/02/2023
: 06/3/2023
: 21/3/2023
JOURNAL OF FORESTRY SCIENCE AND TECHNOLOGY NO. 15 (2023)
37