STUDY ON APPLICATION OF THE NUCLEAR METHODS FOR ANALYSIS TIO 2 /SIO 2 MATERIAL USING ACCELERATED ION BEAM - Full 10 điểm
Bạn đang xem bản rút gọn của tài liệu. Xem và tải ngay bản đầy đủ của tài liệu tại đây (1.62 MB, 29 trang )
MINISTRY OF EDUCATION
VIETNAM ACADEMY
AND TRAINING
OF SCIENCE AND TECHNOLOGY
GRADUATE UNIVERSITY OF SCIENCE AND TECHNOLOGY
-----------------------------
TRẦN VĂN PHÚC
STUDY ON APPLICATION OF THE
NUCLEAR METHODS FOR ANALYSIS TIO2/SIO2 MATERIAL
USING ACCELERATED ION BEAM
Major: Atomic Physics
Code: 9440106
SUMMARY OF ATOMIC PHYSICS DOCTORAL THESIS
Hanoi – 2023
Cơng trình được hồn thành tại: Học viện Khoa học và Công nghệ - Viện
Hàn lâm Khoa học và Công nghệ Việt Nam.
Người hướng dẫn khoa học 1: GS.TS. Lê Hồng Khiêm – Viện Vật Lý,
VHLKH&CNVN
Người hướng dẫn khoa học 2: TS. Miroslaw Kulik – Viện Liên Hiệp
Nghiên Cứu Hạt Nhân (JINR), Dubna, Liên Bang Nga
Phản biện 1: …
Phản biện 2: …
Phản biện 3: ….
Luận án sẽ được bảo vệ trước Hội đồng đánh giá luận án tiến sĩ cấp Học
viện, họp tại Học viện Khoa học và Công nghệ - Viện Hàn lâm Khoa học
và Công nghệ Việt Nam vào hồi … giờ … ngày … tháng … năm 201….
Có thể tìm hiểu luận án tại:
- Thư viện Học viện Khoa học và Công nghệ
- Thư viện Quốc gia Việt Nam
PREAMBLE
1.
The urgency of the thesis
For the application of ion beams to modify material structures, ion
implantation is the most typical method. It is a well-known fact that the
structures and properties of materials can be modified in a controlled way by
means of the ion implantation technique [1]. For multilayer materials, once a
target is bombarded with an appropriate ion beam, ion beam mixing (IBM)
occurs in the regions between material layers, even in the normal experimental
conditions [2]. IBM has thus become an effective approach to customizing the
properties of multilayer materials, especially when the traditional methods, e.g.,
deposition or thermal processing, do not succeed. In fact, creating stable,
metastable, amorphous, and crystalline phases in bilayer and multilayer
materials has been common use of the IBM [3,4]. Many material systems
involving metal-metal [5,6], metal-silicon [7,8] or metal-insulator systems have
been employed for studies on IBM’s fundamental mechanisms and prospective
applications [9]. However, the fundamental mechanism of the IBM and how it
affects the properties of irradiated materials have not been fully understood.
One has known that there exists an optimum combination of thickness of the
over-layer thin film and the ion beam parameters to enhance the interfacial
mixing yield, whereas the dependence of mixing amount on ion fluence and
deposited energy can be predicted using mixing models [10,11]. Nevertheless,
the precise recipe for finding that optimum combination and understanding the
modification of the parameters of the mixing models are still under
development. The main difficulty comes from the fact that the mixing is not
merely a simple function of ion energy and mass.
Furthermore, unlike metal/metal, metal/silicon, and metal/insulator
systems, where the mixing mechanism is rather understood, data on oxide/oxide
systems is sparse. In the energy range of 100 – 250 keV, there was no report on
the influence of ion energy and mass on atomic mixing also the changes in
properties of oxide/oxide materials. Therefore, the mechanism and potential of
ion mixing for modifying the interfacial properties of oxide/oxide systems have
yet to be adequately determined. Relatively few systems have been studied, and
the range of experimental conditions has been limited. In principle, because
most oxide-oxide reactions are neither extremely exothermic nor highly
endothermic, it is difficult to anticipate how much ion-induced interfacial
mixing will occur. Additionally, it is unclear whether ion mixing promotes the
formation of glassy oxide mixtures or separates the oxide phases. These factors
greatly influence the adhesion enhancement expected from ion mixing.
1
Therefore, the mechanism of mixing induced by irradiation associated with
changes in oxide material properties is essential to be investigated. This work
is directed toward obtaining a better understanding of mixing characterization
and the relative roles of kinetics in oxide-oxide bilayer mixing.
Among the double antireflective self-cleaning coatings for photovoltaic
solar cells, such as Al2O3/SiO2, TiO2/SiO2, Si3N4/MgF2, the most widely used
system is TiO2/SiO2 due to their excellent adhesion and transmittance [12,13].
On the one hand, due to the tunable refractive index, SiO 2 was considered to
achieve high antireflection property [14]. On the other hand, two photo-induced
phenomena: photo-induced hydrophilicity and photocatalysis of TiO2 film
made it self-cleaning [15]. It has been proved that TiO2 and SiO2 coatings on
solar cells reduced the reflection of solar cells from 36% to 15% with a singlelayer (SiO2) and to 7% with a double-layer (TiO2/SiO2) [16]. When used
normally, TiO2/SiO2 needs to be resistant to environmental aggression that
might arise. The key to achieving excellent antireflection performance is the
control of coatings' refractive index (𝑛). This means that absorption in materials
and at interfaces should be kept to a minimum and the refractive index should
remain constant over time [17]. Accordingly, it is important to know how the
interface is formed and their thickness results in a variation of the index and
possibly absorption. It has been proved that the thickness of interface area
between materials is well controlled by IBM [7]. Nevertheless, the implantation
necessary to mix an oxide/oxide interface might cause significant damage,
which is undesirable for the majority of thin-film applications [18]. Therefore,
to understand the overall irradiation response of the TiO2/SiO2 bilayer, further
studies on irradiation-induced defects and the corresponding changes in
interfacial properties are essential.
2.
The purpose and tasks of the research
The first goal of the thesis is to grasp the principles, experiments and
applications of the Rutherford Backscattering Spectrometry (RBS) method in
the analysis of materials, especially multilayer materials. Approach to the
scientific problems as well as modern research directions in the world toward
the research on application of ion beam in modification and analysis of
materials.
The thesis focuses on describing and analyzing the atomic mixing
phenomenon that occurs at the material interface after ion implantation using
the RBS method. Investigate the variation in the degree of atomic mixing
through experimental parameters that cannot be predicted by theoretical
models, and explain the phenomena by Monte Carlo simulation. In addition,
2
analyze the chemical and optical properties of the samples after being implanted
with noble gas ions by Xray Photoelectron Spectroscopy (XPS) and
Ellipsometry Spectroscopy (ES) methods.
3.
The object and scope of the research
i) Characterization changes in structure of the TiO2/SiO2/Si systems,
including the transition layers between TiO2 and SiO2 induced by noble gases
ion irradiation in the energy range of 100-250 keV using one of the ion beam
analysis methods - Rutherford Backscattering Spectrometry (RBS).
ii)Investigation dependence of ion-induced mixing at TiO2/SiO2 interface on
the energy and mass of incident ions with different thickness of material layers.
iii)
Interpretation of mixing mechanism in term of kinetic atomic
transport using Stopping and Range of Ions in Matter (SRIM) simulation.
iv)
Study on influence of changes in chemical composition induced by
ion irradiation on mixing amount as function of ion energy using XPS method.
v) Investigation changes in optical parameters of un-irradiated and irradiated
TiO2/SiO2 transition area as function of ion energy using the ES method.
3
CHAPTER I
INTRODUCTION
1.1. Low-energy ion modification of solids and ion beam mixing process
During low energy ion irradiation, particularly with heavy ions, the structure
and composition of the surface layers of a sample can be substantially modified.
There are four main processes (Fig.1.1) involved: ion implantation - the
introduction of a new atomic species; radiation damage - the displacement of
sample atoms; ion beam mixing - the promotion of diffusion and migration of
atomic species; and sputtering - the ejection of surface atoms.
The near-surface composition of a sample can be substantially modified by
ion implantation (Fig.1.1a) and this is now widely used for changing materials
properties. When ions lose energy in nuclear collisions with target atoms, many
atoms are displaced from their normal locations. Target atoms recoiling from
these collisions can themselves carry enough energy to cause additional
displacements sometimes producing a collision cascade which affects many
atoms at a distance from the original ion path (Fig.1.1b). Ion irradiation can also
promote diffusion through both collisional effects and increases in local
temperature in the irradiated region (Fig.1.1c). Ion beam mixing of atomic
constituents is a process which can be usefully exploited for the development
of new materials but it can also change the target composition during ion beam
analysis, particularly when high fluences of heavy ions are employed. The
unique features of ion beam mixing are the spatial selectivity and no
requirement for heat treatment. The sputtering accompanies collision cascades
which cause target atoms to be ejected (Fig. 1.1d). Sputtering is an important
method for the controlled removal of surface layers from a solid.
Fig.1.1. Schematic illustration of four ion beam modification processes [19].
4
1.2. Concept of ion beam mixing
Ion beam mixing is the process of atoms from several atomic species
merging across an interface under the influence of an ion beam. When energetic
ions interact with nuclei and electrons of a solid, their energy is deposited in the
substance. The formation of a moving atoms cascade is one of the effects of
energy transfer to target atoms. If the ion energy is high enough to penetrate
beyond the interface between two materials A and B, the recoiling atoms
created near the interface may have sufficient energy to cross it. Intermixing of
A and B atoms in the interface region therefore is the outcome.
There are three types of the sample configurations that are used commonly
in the ion beam mixing study. The first type, a thin maker of element A is placed
between two layers of material B. The system approximates the spreading of
impurity A in a matrix made up largely of B atoms with the typical thickness of
layer A is about 1 nm. The second type of geometry, thin film of element A is
evaporated onto substrate B. During ion bombardment, A and B form a semiinfinite diffusion couple and are free to form continuous solid solutions,
intermediate phases or compounds. The third type of sample design, is made up
of alternate thin evaporated layers (multilayers) of A and B with an overall
thickness less than the ion range. To be merged with the opposite layer, A (or
B) atoms now must be displaced only a few interatomic lengths. In this thesis,
the configuration of the bilayer has been utilized for the ion beam mixing
studies.
The basic process involved in low energy ion beam mixing is illustrated
schematically in Fig.1.2. When the energetic heavy ion penetrates a top
(impurity) layer A to reach a bulk material B, it loses energy due to collision
with target atoms, which receive sufficient energy to get displaced from their
original positions. These displaced atoms in turn make multiple collisions with
the target atoms to produce a displacement cascade. The displacement of atoms
occurring near the interface of layer A and the bulk material B results into a
mixed region of A and B. The compositional changes achieved by ion beam
mixing of an A–B interface, where A and B denote different materials turned
out to be much faster as compared to implantation of A into B.
5
a
)
b
)
c
)
Fig.1.2. The formation process of transition layer during ion irradiation [20].
The effects of these collisions can be divided into two mechanisms based
on the time scales: prompt effects (∼ a few ps) termed as ballistic mixing
including recoil implantation and cascade mixing; delayed effects (exceeding
several ns) termed as thermal mixing consisting of Radiation Enhanced
Diffusion (RED) at higher temperatures and thermal spike diffusion at lower
temperatures. In the present work, the contribution of the recoil and cascade to
ion mixing will be investigated, mechanism of this process is given in the
following sections.
In literature, it indicates that the dependence of mixing degree on ion
fluence ∅ and energy deposited per unit depth FD has been well established by
both experimental studies using the primary RBS method and model-based
calculations. However, choosing a convenient mixing model depends on ion
beam parameters and the target properties (or material configuration). Mixing
degree do not depend directly on the factors as samples temperature, ion charge
state, ion energy, or ion mass. Effects of these parameters on mixing of different
material configurations has been carried out experimentally. Moreover, most
investigations of ion-induced mixing have dealt with metal films on oxide,
polymer, semiconductor, and metal substrates. The mixing behavior and
potential of ion mixing for modifying the interfacial properties of oxide/oxide
systems have yet to be adequately determined.
6
CHAPTER 2
THE EXPERIMENTAL TECHNIQUES
In order to investigate the mixing and changes in interfacial properties of
the TiO2/SiO2 systems induced by ion implantation, the Rutherford
Backscattering Spectrometry (RBS), Ellipsometry Spectroscopy (ES), and Xray Photoelectron Spectroscopy (XPS) methods has been used. The techniques
can be classified into major – ion implantation and RBS, and auxiliary – XPS
and ES. In this chapter, a short discussion of physical concepts of the
techniques will be given, followed by the experimental conditions.
2.1.
Ion implantation
Ion implantation has proved its superiority over diffusion in integrated
circuit technology because of the precise control which it offers over the doping
level and the thickness of the doped layer. In addition, it has good
reproducibility and can be used for doping selected areas by masking
procedures. The collisional nature of ion implantation makes it a violent
technique and being a non-equilibrium process it introduces crystalline disorder
or radiation damage. Often this radiation damage may be unwanted and is
removed by an annealing cycle, but frequently it may prove beneficial. Ion
beam mixing is an interesting application of ion implantation where radiation
damage can be used in fabricating and modifying material characteristics. This
approach is particularly interested in creating stable compounds, durable
imitation alloys, and super-saturated alloys. Also, it has the potential to
improve the wear or corrosion resistance of metals. In semiconductors, IBM is
utilized as a method for combining contacts, metal layer with a semiconductor
for preparation of electrical, and it has been demonstrated to be useful for
dispersal of impurities prior to film growth.
For the aims of present study, two groups of TiO2/SiO2/Si structures with
different layer thickness were surveyed. Mixing of the TiO2/SiO2 systems was
induced by implantation the samples with four different species of noble ions
Ne+, Ar+, Kr+ and Xe+ at four different energies of 100, 150, 200 and 250 keV.
For each implantation, the fluence of the incident ion beam was fixed at 3 ×
1016 (ions/cm2). The noble gas ions were used due to they would not produce
any chemical binding with the target atoms during interaction, in this way the
samples only modified in physical structure. With these species of ions, the
energy was chosen so that the ions interact with the atoms in samples at both
before and beyond the TiO2/SiO2 interface.
7
2.2. Rutherford Backscattering Spectrometry (RBS) method.
In this work, the RBS experiments were carried out using ion beams
accelerated by a Van de Graff accelerator at the EG-5 group, Frank Laboratory
of Neutron Physics, JINR, Dubna, Russia. After acceleration process, the
energetic ions pass through a magnet system for changing the beam direction
from perpendicular to parallel with the floor surface. The beam is collimated
to a small divergence angle at the target. The beam line pressure is about l0 6
Torr, connected with the target chamber located at the IBA experimental hall.
Just before entering the chamber the beam spot has a diameter of nearly 5 mm.
In the target chamber, the samples are putted on a holder that can keep four
samples at the same time. The holder is designed to connect to a sensitive
current integrator for monitoring the beam current. During bombardment, the
backscattered particles are collected by a surface barrier detector placed in the
chamber according to IBM geometry, in which, 𝛼 is incident angle, and 𝜃 is
scattering angle. The exit angle 𝛽 is simply given by 𝛽 = |1800 − 𝛼 − 𝜃 |. In
the RBS experiment for analysis of TiO2/SiO2/Si samples, a He+ ion beam of
1.5 MeV was used.
2.3. Ellipsometry Spectroscopy (ES) method
In the present study, the ES experiments were conducted at the Institute of
Electron Technology in Warsaw, Poland using the rotating-analyzer
ellipsometer (RAE). The ellipse of the angles Ψ (λ) and Δ (λ) was measured
with the light wavelength from 250 nm to 1100 nm, with the step of 1 nm at six
different incident angles (i.e., the angle between direction of incident light beam
and the normal of the sample surface), namely 70.00, 72.00, 74.00, 76.00 78.00,
and 80.00. Once all these SE experiments had done, all the measured angles Ψ
(λ) and Δ (λ) were used as input to calculate the spectra of Ψ (λ) and Δ (λ) using
the Multiple-angle-of-incidence Ellipsometry (MAIE) method. In order to
analyze the optical parameters of the irradiated TiO2/SiO2/Si systems, a fourlayer optical model was constructed. It consists of a Si substrate, a SiO 2 layer,
TiO2 layer, and an interface layer between SiO2 and TiO2. It was assumed that
all layers are homogeneous, and the boundaries between the materials are sharp.
The thickness, and concentration of the compounds of the material layers are
free parameters, whose values were determined by fitting to the experimental
Ψ (λ) and Δ (λ) spectra. Knowing the values of all the parameter models, the
refractive index n, and extinction coefficient k, of the investigated samples were
deduced using the effective medium approximation (EMA).
8
2.4. X-ray Photoelectron Spectroscopy (XPS) method.
In a XPS instrument, a sample is illuminated by low-energy X-rays to
activate the photoelectric effect, the atoms of the surface thus excited by the
electrons. The energy spectrum of photoelectric electrons is determined by the
high-resolution electron spectrometer. Photovoltaic emission provides
information about electron binding energy, chemical state, electronic state and
quantitative composition of compounds. The recording and measurement of the
kinetic energy of the excited photoelectric electron allows to determine their
binding energy from known X-ray energy. Spectra measured include peaks
corresponding to the electronic energy levels of the material. In this work, XPS
method was used to study experimentally influence of changes in chemical
composition induced by ion irradiation on mixing amount of TiO2/SiO2 systems
as function of ion energy. XPS spectra were recorded in the energy range of 450
eV - 462 eV, this energy range represents the binding energy of the electrons Ti
2p.
CHAPTER 3
INFLUENCE OF ION ENERGY AND MASS ON MIXING OF
TIO2/SIO2 STRUCTURES WITH DIFFERENT THICKNESS
In this chapter, variation in structural properties TiO2/SiO2/Si systems
induced by noble gas ion irradiation will be investigated using RBS method.
The mixing process at the TiO2/SiO2 interface is described by shifting of
borders associated to elements in RBS spectra. Mixing amount and direction
are determined by changes in thickness of TiO2 and TiO2/SiO2 transition layers.
The mixing behavior will be investigated as a function of energy and mass of
the incident ions for different thicknesses of TiO2 and SiO2 thin films.
3.1. Characterization of samples and the mixing process.
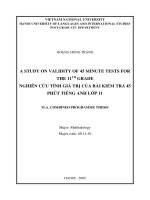
Regarding modification of the irradiated TiO2/SiO2/Si structures, the RBS
spectra of the thinner-layer samples (group 1) irradiated with Kr+ ions of 100,
150, 200, and 250 keV as well as that of the virgin one were investigated. The
presence of O and Ti at the near surface layer of the investigated TiO 2/SiO2/Si
samples is indicated in Fig.3.1 by vertical arrows pointing to the high-energy
edges of the corresponding peaks (also known as kinetic borders) at 530 and
1100 keV, respectively. In Fig.3.1, the presence of Si in the substrate and SiO2
layers is marked by inclined arrows at the energy edges of 770 and 830 keV,
respectively. The band at the energy between 370 and 530 keV indicates the
He+ ions backscattered from O in both TiO2 and SiO2 layers. Whereas, the
presence of Kr atoms in the irradiated samples is noticed by an inclined arrow
9
pointing to the high-energy borders of the corresponding peaks at around 1225
keV. The implantation of Kr+ ions caused a decrease in concentrations of O and
Si, which is associated with a significant reduction in the yields of backscattered
He+ ions corresponding to O and Si nearly the energy of 485 and 800 keV,
respectively. Obviously, there was no Kr peak in the RBS spectrum of the nonirradiated TiO2/SiO2 sample. Meanwhile, the Kr peaks of irradiated samples had
a shift with growing ion energy. This shift can be attributed partially to the
variation of Kr distribution that contribute to changes in TiO 2, SiO2 layer
thicknesses as well as mixing amount between these materials.
Focusing on the atomic mixing process, which is responsible for the
broadening of the implanted TiO2/SiO2 transition layers, the measured RBS
spectra are kept to be examined in extensive detail. As the implanting ion energy
increases, a shift toward the higher energy region of the low-energy edges
indicating the appearance of Ti in the TiO2 layer was observed. This is an
indication for the expansion of the mixed layer toward the sample surface, i.e.,
the outward mixing. The influence of ion irradiation on mixing of TiO 2/SiO2
thus can be examined by surveying the full-width at half-maximum (FWHM)
of the corresponding Ti Gaussian peaks in RBS spectra. As shown in Fig.3.1,
these Ti peaks are well separated from the others, the surveyed FWHMs
therefore do not sustain the uncertainty due to peak superposition.
Energy [keV]
400
600
800
Kr+ => TiO2/SiO2/Si
Virgin
100 keV
150 keV
200 keV
250 keV
4
1.5x10
O
Yield [counts]
1000
Ti
Si Si substrate
1.0x10⁴
Si SiO2 layer
5.0x10³
0.0
300
1200
E He+ = 1500 keV
Kr
a = 600
q = 1700
400
500
600
700
800
900
1000 1100 1200 1300
Channel number
Fig.3.1. The RBS spectra that were collected from the thinner-layer
samples (group 1) un-implanted and implanted with Kr+ ions at different
energies.
10
It is worth to mention that a study on role of expanding SiO 2 layers in the
mixing of a Kr-implanted Al2O3/SiO2 system has been pointed out by Galuska.
However, in the present work, the variation of SiO2 layer thicknesses
simultaneously depends on the mixing processes occurring at both TiO 2/SiO2
and SiO2/Si interfaces. This situation is immensely complicated, and it has not
been discussed. In this thesis, the difference between the FWHM, denoted as
Δ(FWHM), of Ti peaks corresponding to the virgin TiO2/SiO2, and the samples
irradiated with Ne, Ar, Kr and Xe at energies of 100, 150, 200, and 250 keV are
examined. This is the first approach to evaluate the dependence of the mixing
degree at the TiO2/SiO2 interface on the implanting ion energy.
3.2. Dependence of mixing degree on energy of incident ions.
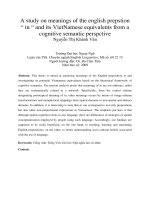
Figure 3.2 shows the variation of Δ(FWHM) for Ti peaks in the RBS spectra
collected from the samples before and after implantation with Ne +, Ar+, Kr+,
and Xe+ ions as the function of ion energy. In general, FWHM of Ti peaks of
the implanted samples decreases compared to that of the virgin one. Decreasing
in FWHM indicates a reduction in concentration of Ti at the bottom of TiO 2
layers. It was noticed that sputtering phenomenon could be ignored due to their
paltry amount, thus lessening in Ti concentration are caused only by the atoms
that moved towards the Si substrate (inward displacement). This leads to
narrowing of the TiO2 layers and thus a broadening of the TiO2/SiO2 transition
layer towards surface of the samples (outward mixing). With growing ion
energy, FWHM reduced for the samples implanted by the Ne+, Ar+, and Kr+
ions. In the energy range of 100 – 250 keV, FWHM drops from -15.6% to 18.9%; -13.0 % to -14.1 % and -1.7% to -6.8% for samples implanted by Ne+,
Ar+, and Kr+ ions, respectively. However, FWHM rises from -29.23% to 24.10% for Xe+ ion irradiation.
2
0
D(WFHM)
-2
-4
-6
Ne
Ar
Kr
Xe
-8
-10
-12
0
50
100
150
200
250
Energy of irradiating ion [keV]
Fig.3.2. The variation of Δ(FWHM) of Ti peaks from RBS spectra as a
function of Ne+, Ar+, Kr+, and Xe+ ions energy.
11
In a mixing study of A.M. Ibrahim for Bi/Sb system, surveying variation
of Δ(FWHM) values shown that the mixing proceeds faster as the energy
increases to 80 keV, then reduces slowly with ion energy. The enhancement in
mixing amount indicated expending of the over-layer towards the substrate due
to the inward displacement. In the present study, however, a decrease in the
FWHM of implanted samples compare with that of the virgin one associated
with outward mixing. For TiO2/SiO2 system, the atomic transportation becomes
complex because of the existence of oxygen in the mixed area from both
materials. Moreover, due to existence of initial transition layers between TiO 2
and SiO2, the thickness of the mixed areas after ion irradiation will be modified
in both inward and outward directions. Accordingly, the variation of the TiO2
layer thickness, represented by the Δ(FWHM), does not completely quantify
the mixing process.
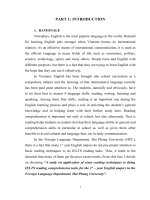
To better inspect the variation of the mixing degree concerning inward
displacement as a function of irradiating ion energy, we calculated the relative
thickness 𝑟𝑡 , which is defined by
𝑟𝑡 = (𝑡𝑖𝑚 − 𝑡𝑣𝑖𝑟 )⁄𝑡𝑣𝑖𝑟
where 𝑡𝑣𝑖𝑟 and 𝑡𝑖𝑚 are the thickness of the layers before and after implantation,
respectively. It recalls that 𝑡𝑣𝑖𝑟 and 𝑡𝑖𝑚 were determined based on the
experimental RBS profiles. The role of the ion energy in the mixing amount
was examined by surveying 𝑟𝑡 at different energies from 100 to 250 keV. An
increase in relative thickness with ion irradiation energy is seen in Fig.3.3 for
all ions species. Generally, this indicates that the energy transferred to recoil
atoms in the transition layer by incident ions is proportional to their initial
energy. Because higher-energy ions displaced atoms travel longer through the
samples, the transition layer thickness expands. This effect agrees with
Sigmund’s conclusion that the noticeable increase in mixing rates occurs at a
fixed depth with increasing irradiating ion energy. However, for oxide/oxide
systems, other contributions in mixing process should be discussed in more
detailed.
12
Relative thickness rt [a.u]
1.5
Ne
Ar
Kr
Xe
1.0
0.5
0.0
0
50
100
150
200
250
Energy of irradiating ion [keV]
Fig.3.3. The variation of the relative thickness 𝑟𝑡 as a function of ion energy
(RBS calculation).
The energy transferred to recoil atoms could be considered as nuclear
energy loss of ions. Using SRIM simulation, both nuclear and electronic energy
loss (𝑆𝑛 and 𝑆𝑒 ) were obtained for interpretation (Table 1). In the low energy
range (100-250 keV), nuclear energy loss shown to be dominant i.e., ions lose
their energy almost via interaction with nuclei more than that of electrons. With
the rising of energy, 𝑆𝑛 tends to decrease slowly for Ne+ and Ar+ ions leading to
fewer effects on the mixed layers compared with that of Kr + and Xe+, whose
energy to recoils increase strongly with growing of ion energy. It suggests that
changes in mixing amount not only depend on ion energy loss, this is the reason
why mixing amount is not simple function of ion energy. For better understand,
the mixing behavior concerning to target damages will be inspected below.
From the RBS experiments, it has been observed that the thickness of the
TiO2/SiO2 transition layers is inversely proportional to the Δ(FWHM) of the Ti
peak in the RBS spectrum. Based on the depth profiles of elements determined
by RBS, the thickness of the mixed layers after irradiation increases 7% for 100Kev Ne to 149% for 250 KeV Xe compared with that of the virgin sample. This
percentage associated with the layer thickness from 1 to 28.8 nm. In the
meantime, decreasing of ∆(𝐹𝑊𝐻𝑀) varies from 1.7% for 100 keV Kr to 29.2%
for 100 keV Xe associating with 0.3 to 4.1 nm in layer thickness. Contribution
of decreasing FWHM to mixing thus seem to be not significant in comparison
to rising relative thickness of transition layers. The cascade mixing process is
responsible for broadening of mixed are, occurs towards both the substrate and
the surface of the samples. Nevertheless, the expansion toward the substrate,
namely the inward displacement of Ti atoms into the SiO2 layer, is dominant.
The mixing degree is not proportional to the damage amount, whereas the ion
energy transfers to the target atoms create deeper damage plays a crucial role in
broadening the TiO2/SiO2 mixed area.
13
Table 1. The interaction parameters calculated at TiO2/SiO2 mixed area for the samples in
group 1 implanted by ions at different energies, using SRIM simulation.
Ion
Ne
Ar
Kr
Xe
Energy
[keV]
Ion
range
[nm]
100
150
200
250
100
150
200
250
100
150
200
250
100
150
200
250
2027.3
3395.3
4232.1
5417.7
975.5
1664.0
2237.8
2811.6
552.0
795.6
1036.0
1398.6
454.3
617.9
741.5
988.7
Number
of ion
across
transition
layer
[ions/cm2]
1.4E+14
5.9E+13
3.5E+13
2.5E+13
9.9E+14
2.9E+14
1.2E+14
6.1E+13
2.2E+15
9.6E+14
4.8E+14
2.3E+14
8.1E+15
3.2E+15
1.2E+15
5.0E+14
Energy loss
[keV/ion]
Displacement
per ion
41.1
34.0
31.9
30.3
157.2
122.8
102.6
88.6
259.2
271.7
276.1
246.7
548.2
610.3
573.0
532.4
Vacancy per
ion
40.0
33.1
31.1
29.5
153.3
119.8
100.1
86.4
253.4
265.0
269.3
240.4
534.3
595.3
558.8
519.1
Nuclear
(Sn)
Electronic
(Se)
3.0
2.3
2.2
2.0
10.8
9.3
8.1
7.3
17.0
18.0
20.6
19.6
23.5
33.2
37.4
38.9
3.0
4.9
6.0
7.2
4.8
6.5
7.5
8.2
2.3
3.2
4.3
4.1
1.9
3.4
4.6
5.6
3.3. Study on mixing of TiO2/SiO2 systems with different thicknesses.
In order to investigate influence of layer thickness on mixing amount, the
thicker-layer TiO2/SiO2 systems (group 2) were measured. Due to the structural
differences of the samples implanted with Xe ions in 2 groups compared to the
rest, these samples were not used for the studied purpose. Mixing process thus
only investigated by the samples implanted with Ne+, Ar+ and Kr+ ions. The
mixing amount will be compared by mean of the new concept of defect level –
displacement per atom (DPA) according to the variation in incident ion energy.
However, the first survey is based on the experimental and simulation
parameters obtained by RBS and SRIM as given.
The variation in relative thickness of TiO2/SiO2 mixed layers as a function
of ion energy for the samples in groups 1 and 2 are shown in Figs.3.4a and b,
respectively. Generally, thickness of the transition layers for 2 groups increased
linearly with the ion energy. In case the samples implanted by the same ion
species, faster rising 𝑟𝑡 was observed for the samples in the group 1. Varying of
𝑟𝑡 values were approximated using the fitting line as a linear function: 𝑟𝑡 (𝐸 ) =
𝑎 × 𝐸 + 𝑏. Where the parameters 𝑎 and 𝑏 are known as the slope and 𝑟𝑡 intercept of the equation respectively, E indicates to the energy of implanted
ions. Table 1 shows slope values of the linear fitting function for increasing of
𝑟𝑡 for all investigated samples. It is clear that faster increasing in transition layer
thickness of samples in group 2 corresponds to the higher slope parameters of
14
fitting lines. In other word, mixing rate is greater for the thinner initial TiO 2
layers. It should be kept in mind that difference in thickness of TiO 2 and SiO2
layers leads to deviation of initial transition area for the samples between two
groups. An average deviation about 15 nm was found based on RBS depth
profile. Thus, although 𝑟𝑡 is a good representation mixing amount for the
samples in individual of two groups, it does not show the correlation between
them.
0.6
Ne
Ar
Kr
0.5
0.4
relative thickness rt [a.u]
relative thickness rt [a.u]
0.6
0.3
0.2
0.1
0.5
Ne
Ar
Kr
0.4
0.3
0.2
0.1
0.0
0.0
0
50
100
150
200
0
250
50
100
150
200
250
incident ion energy [keV]
incident ion energy [keV]
Fig.3.4. Variation of relative thickness 𝑟𝑡 as a function of ion energy for the
samples in group 1 (a) and group 2 (b).
Table 2. The slope values of the linear fitting function for increasing of 𝑟𝑡 for
the samples in group 1 and 2.
Ions
Ne
Ar
Kr
Slope 𝒂
Group 1
7.9E-4 ± 1.1E-4
9.6E-4 ± 0.7E-4
22.0E-4 ± 3.0E-4
Group 2
7.8E-4 ± 0.7E-4
4.3E-4 ± 0.8E-4
17.0E-4 ± 3.0E-4
Indeed, while the slope values for thinner-layer samples (group 1) are
higher, the simulation parameters suggest the contrary. The total loss energy,
number of ion across transition layer, and defects density show higher values
for samples of group 2 due to thicker initial transition layer. Moreover, the
measured defects (in unit atom/cm3) only explains the difference in term of
defect density for layers of same thickness. Therefore, for a better comparison
the parameter displacement per atoms (DPA), which refers damage level of the
sample structure, was calculated for a thickness of 20 nm under bottom of the
TiO2 layer for both groups.
Table 3 shows the DPA of Ar, Kr and Ne ions at different energies for the
samples in both groups. Where the values in the table were calculated for a
thickness of 20 nm under bottom of the TiO2 layer for both groups. It is clear
15
that DPA for group 2 is higher than groups 1 in all cases. Within interaction of
ions with atoms, when an ion transferred to the PKA high enough energy, E >>
𝐸𝑑 , the PKA will be able to continue the PKA process to displace other atoms
of the crystal, creating secondary recoil atom displacement. The lattice atom in
collision receives energy that is less than the displacement threshold energy, the
atom can be knocked out of its position in the crystal but will not be displaced.
DPA thus refers displacements that produced by PKA directly. The DPA values
for group 2 larger than group 1 means that there are more displaced atoms
produced by PKA in transition area for thicker-TiO2 samples. This shows
greater reactivity level of atoms with ions under the thicker TiO2 layer creating
more defects, lead to higher mixing amount as a consequence.
Table 3. DPA calculated for a thickness of 20 nm under bottom of the TiO2
layer for the samples implanted by Ar, Kr, Ne at different energies.
Energy
[keV]
100
150
200
250
Ar
G2
100.9
85.1
71.0
62.2
Kr
G1
82.6
70.1
59.8
53.4
G2
181.4
201.4
204.4
190.9
Ne
G1
170.2
171.6
164.0
145.4
G2
30.7
23.5
19.2
15.3
G1
26.3
19.0
15.9
14.1
It was noticed that with thicker TiO2 layers, the ions travel longer distances
and collide with more atoms along the inward path. Thus, the ions lose more
energy in the TiO2 layer of samples in group 2. The larger energy loss of ions
could make a misleading that the remaining energy create less damage in
transition area for thicker-layer samples. However, the DPA at the 20-nm
mixed layers show greater values for group 2 than that of group 1. That means,
despite lower energies, ions produced more damages at mixed layers. This
effect could be taken into account by the main role of correlation between ion
range, number of interacting ions and transition area position Table 4).
Therefore, for the investigated TiO2 thickness below 30 nm, higher DPA refers
to more damage as well as mixing for thicker layers. Although the simulation
parameters are insufficient to compare the mixing in this case, a combination
with calculated DPAs allowed to interpret variation of TiO2/SiO2 mixed layers
with deviation in layer thickness in terms of target damage and atomic
transportation.
16
Table 4. The interaction parameters calculated using SRIM simulation at
TiO2/SiO2 mixed area for the samples in group 2 implanted by ions at different
energies.
Ion
Ne
Ar
Kr
Xe
Energy
[keV]
Ion
range
[nm]
100
2027.3
150
Number of
ion across
transition
layer
[ions/cm2]
Displacement
per ion
Vacancy
per ion
5.9E+14
92.8
3395.3
1.9E+14
200
4232.1
250
Energy loss
[keV/ion]
Nuclear
(Sn)
Electronic
(Se)
90.9
6.4
7.7
70.5
69.1
5.0
9.3
1.0E+14
68.1
66.7
4.8
11.8
5417.7
7.4E+13
70.3
68.8
4.8
15.5
100
975.5
4.2E+15
310.7
304.0
21.1
7.7
150
1664.0
1.2E+15
248.0
243.0
18.9
11.2
200
2237.8
4.5E+14
204.5
200.2
16.4
13.4
250
2811.6
2.2E+14
175.2
171.6
14.6
14.8
100
552.0
1.6E+16
641.3
625.3
30.8
3.3
150
795.6
6.9E+15
731.8
716.0
45.5
6.6
200
1036.0
2.9E+15
681.5
667.0
49.2
9.0
250
1398.6
1.3E+15
614.1
600.9
48.6
9.4
100
454.3
1.3E+16
394.6
383.1
18.4
1.0
150
617.9
6.4E+15
523.7
513.3
29.2
2.5
200
741.5
2.7E+15
525.1
515.3
36.4
3.9
250
988.7
1.3E+15
501.0
491.0
39.6
4.9
CHAPTER 4
INFLUENCE OF ION ENERGY ON CHEMICAL AND OPTICAL
PROPERTIES OF THE TIO2/SIO2/SI SYSTEMS
4.1. Influence of the ion energy on chemical composition of TiO2 near
surface layers, and its effect to mixing of TiO2/SiO2 systems.
The results that obtained from XPS for the layer about 10 nm, thus could
be considered similarly for whole of TiO2 film. Generally, it is useful for
surveys of unknown contamination. It was found that higher valence oxidation
state species has electrons bound with higher energy compared with more
reduced state but in atoms with same formal valence state, the energy bonds
increases with electronegativity of neighbouring atoms. Using the XPS
method, the chemical compositions of the near surface layers of TiO 2/SiO2
bilayers were investigated. Fig.4.1 shows the XPS spectra of Ti 2p (Ti 2p3/2
17
and Ti 2p1/2) electrons in the region from 450.0 eV to 462.0 eV. The spectra
were collected on the samples that were before and after implantation with Ne+
ions at different energies 100, 150, 200, 250 keV. It is known that the bands in
this region can be assigned to Ti 2p electrons. They refer to Ti atoms and the
chemical compounds TiO, Ti2O3 and TiO2. The local maxima in these bands
are 453.86 eV, 455.34 eV 457.13 eV and 458.66 eV, they were related to the
bands of Ti 2p3/2 Ti, TiO, Ti2O3 and TiO2 respectively (Fig.4.1a).
Intensity [conunts]
350
Total
Ti
TiO
Ti2O3
a) Virgin sample
300
250
TiO2
200
Background
Measured
150
100
452
456
460
464
Binding energy [eV]
350
250
200
b1) 100-keV Ne+
Intensity [conunts]
Intensity [counts]
300
350
Total
Ti
TiO
Ti2O3
TiO2
Background
Measured
150
300
250
TiO2
200
Background
Measured
150
100
100
448
452
456
460
452
456
460
Binding energy [eV]
Binding energy [eV]
300
250
200
Total
Ti
TiO
Ti2O3
350
b3) 200-keV Ne
TiO2
Background
Measured
150
100
448
b4) 250-keV Ne+
+
Intensity [conunts]
Intensity [conunts]
350
b2) 150-keV Ne+
Total
Ti
TiO
Ti2O3
300
250
464
Total
Ti
TiO
Ti2O3
TiO2
Background
Measured
200
150
100
452
456
460
Binding energy [eV]
452
464
456
460
Binding energy [eV]
464
Fig.4.1. XPS spectra of Ti 2p bands for the samples that were before (a) and
after implanted with Ne+ ions at different energies of 100 (b1), 150 (b2), 200
(b3) and 250 (b4) keV
18