DEVELOPMENT AND VALIDATION OF HPLC - PDA METHOD FOR THE SIMULTANEOUS DETERMINATION OF AURAMINE O AND RHODAMINE B IN FOODSTUFFS - Full 10 điểm
Bạn đang xem bản rút gọn của tài liệu. Xem và tải ngay bản đầy đủ của tài liệu tại đây (622.28 KB, 13 trang )
TRƯỜNG ĐẠI HỌC SƯ PHẠM TP HỒ CHÍ MINH HO CHI MINH CITY UNIVERSITY OF EDUCATION
TẠP CHÍ KHOA HỌC JOURNAL OF SCIENCE
ISSN: KHOA HỌC TỰ NHIÊN VÀ CÔNG NGHỆ NATURAL SCIENCES AND TECHNOLOGY
1859-3100 Tập 16, Số 6 (2019): 16-28 Vol. 16, No. 6 (2019): 16-28
Email: ; Website:
DEVELOPMENT AND VALIDATION OF HPLC-PDA METHOD
FOR THE SIMULTANEOUS DETERMINATION OF AURAMINE O
AND RHODAMINE B IN FOODSTUFFS
Phan Thi Ngoc Trinh1, Nguyen Thanh Thoi1, Huynh Thi Nhan1,
Nguyen Ngoc Hung1, Nguyen Thi Tuyet Nhung1*, Le Thi Hong Van2, Le Van Huan2
1 Faculty of chemistry – Ho Chi Minh City University of Education
2 Saigon Pharmaceutical Sciences and Technologies Center,
University of Medicine and Pharmacy at Ho Chi Minh City
* Corresponding author: Nguyen Thi Tuyet Nhung – Email:
Received: 18/3/2019; Revised: 11/4/2019; Accepted:15/6/2019
ABSTRACT
HPLC-PDA method was used to determine two basic dyes, Auramine O and Rhodamine B in
food samples. The limits of detection and quantification of Auramine O (AO) and Rhodamine B
(RB) were both 0.02 mg/L and 0.05 mg/L, respectively. The recoveries of AO and RB in matrices
ranged from 83.00% to 105.91% with the concentration 0.5 µg/g, 1.0 µg/g and 1.5 µg/g. This is a
simple and accurate method which can be applied to quantify of dyes in foodstuffs.
Keywords: Auramine O, Rhodamine B, HPLC-PDA, foodstuffs.
1. Introduction
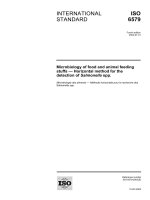
Auramine O (C17H22N3Cl, 303.84 gram/mol, yellow powder, pKa 9.8, 10.7 (Sabnis
R.W, 2010)) and Rhodamine B (C28H31N2O3Cl, 479.01 gram/mol, green powder, pKa 3.7
(Peng Wang, Mingming Cheng, Zhonghai Zhang, 2014)) are synthetic azo–cationic dyes
with the chemical structures shown in Fig 1. RB functions as a water tracer fluorescent and
is commonly used as a colorant in textiles, paper industry (Adejumoke A. Inyinbor,
Folahan A. Adekolab and Gabriel A. Olatunji, 2015) while AO is commonly used to dye
wood products, leather, ink, and textile fabrics (Sabnis R.W, 2010). According to the
International Agency of Research on Cancer, RB is associated with eye, skin, and
respiratory tract irritation and AO is possibly carcinogenic to humans (Agents classified by
the IARC Monographs, 2019). For that reason, the presence of AO and RB in foodstuffs
may cause adverse effects on human’s health. Ingestion of these dyes over time causes
respiratory tract ailments as well as acute and chronic poisoning. Therefore, both of them
are not listed as food additives allowed for use in Vietnam and other countries (Vietnamese
Ministry of Health, 2001, 2018). However, because of their easy coloring, high stability,
and low cost, AO and RB are still being used illegally in animal feed, food, and cosmetics
as beauty color as well as to ensure the uniform appearance of foodstuffs.
16
TẠP CHÍ KHOA HỌC - Trường ĐHSP TPHCM Phan Thi Ngoc Trinh et al.
AO RB
Fig 1. Chemical structures of AO and RB
The color products have received the attention of many researchers in many
countries in the world. The study of Dong-yang Chen, Hao Zhang, Jia-li Feng, Dong Zeng, Li
Ding, Xian-jun Liu, Bang-rui Li (2017) has presented high performance liquid
chromatography coupled with diode array detector to detect 10 industrial dyes (basic
orange 2, basic orange 21, basic orange 22, acid orange II, auramine, basic rhodamine B,
and Sudan I–IV) in a great variety of matrices such as meat products (smoked sausages,
preserved ham, fresh meat, yellow-fin tuna), chili powder, and chili oil in China. While the
limit of detection has been in the range of 0.007–0.01 mg/kg, high recoveries (80.6–104%)
and good reproducibility (1.1–5.7%) have been obtained. Shruti Singh, Himani Shah, Ritika
Shah, and Krishna Shah (2017) have separated and determined Sudan and Rhodamine B dye
in chili and curry powder matrices by thin layer chromatography and spectrophotometry
method. Brazeau J. (2018) has detected 27 color compounds (including RB) in food by
liquid chromatography/ultraviolet visible. Using poly(sodium 4–styrenesulfonate)
modified MIL–101(Cr)–NH2 to enable effective adsorption and separation of AO, RB, and
pararosaniline from foodstuffs prior to high performance liquid chromatography analysis,
under optimized conditions, the recoveries of the three dyes in shrimp powder, chili
powder, tofu sheets, and tomato sauce have been in the range of 86.8–119.3% (Xue Wang,
Hui-Ling Duan, Shi-Yao Ma, Jun Wang, Han-Ying Zhan, & Zhi-Qi Zhang, 2018). Serum
samples have been deproteinized with acetonitrile and separated by UHPLC on a reverse-
phase C18, using a triple quadrupole tandem mass spectrometer in the selected reaction
monitoring mode at [M]+ ion m/z 443.39 → 399.28 for RB. Linear has resulted over a
concentration range of 0.5–100 ng/mL, with a lower limit of quantitation of 0.5 ng/mL
(Yung-Yi Cheng, Tung-Hu Tsai, 2016).
In Vietnam, some analytical studies have determined only AO or RB in matrices,
such as cosmetics (Le Thi Huong Hoa, Nguyen Thi Hoang Lien, Thai Nguyen Hung Thu,
Trinh Van Lau, 2011), chicken meat (Nguyen Thi Kim Thuong, Pham Tuan Anh, 2017).
Differential pulse adsorptive stripping voltammetry, UV-Vis, HPLC, and UPLC are
methods which have been commonly used. The standard TCVN 8670:2011 of the
Vietnamese Ministry of Science and Technology (2011) mentions the method of
17
TẠP CHÍ KHOA HỌC - Trường ĐHSP TPHCM Tập 16, Số 6 (2019): 16-28
quantifying only RB in foodstuffs. Some analytical laboratories have identified AO and
RB in food samples by liquid chromatography coupled mass spectrometry LC-MS/MS,
which is a sensitive method but requires expensive analytical instruments and a complex
sample preparation process. Therefore, the main purpose of this work is the simultaneous
analysis of two synthetic colors in foods by HPLC-PDA, which is a suitable method for
small and medium laboratories.
2. Materials and methods
2.1. Chemicals and reagents
AO (861030, purity ≥ 85%) and RB (R6626, purity ≥ 95%) were bought from Sigma.
Methanol (99.9%, Lapscan, Thailand), formic acid (98-100%; Scharlau, Scharlab S.L -
Spain), acetic acid (100%, Merck, Germany), and phosphoric acid (85%; Scharlau,
Scharlab S.L - Spain) were used for mobile phase HPLC. Ammonia solution in water
(25%, Merck, Germany), acetonitrile (99.9%, Merck, Germany), and sodium chloride
(99.99%, Suprapur) were used to extract AO and RB from foodstuffs.
2.2. Instruments
Perkin-Elmer Lambda 25 was used for scanning the absorption spectra of AO and RB.
Waters 2996 HPLC-PDA, a column C18 (Zorbax Eclipse XDB - C18, 5 m x 4.6
mm x 250 mm, Agilent), and a precolumn (Eclipse XDB - C18, Agilent) were used for
chromatographic analysis. This system is a manual accessory for high-sensitivity
determination of synthetic food colorants. The detection wavelengths of AO and RB were
435 nm and 555 nm, respectively.
Water Pro PS (Labconco) was used for preparing the aqueous mobile phase. The
mobile phase comprised of (A) methanol and (B) 0.03% phosphoric acid in water. The
gradient elution was conducted as follows: solvent A started at 30% and kept the balanced
ratio in 5 minutes, then increased to 80% in 11 minutes, finally decreased to 30% in 4
minutes with the flow rate of 1.0 mL/min at 35oC. The injection volume was 20 L.
An ultrasonic assistance (Elmasonic S 60 (H) - Elma Schmidbauer) and a centrifuge
machine (DNA concentrator - miVac, Genevac Ltd. Ipswich) were used for extraction of
AO and RB in samples.
2.3. Sample collection and preparation
Nine different samples of three kinds of food: pickled collard greens, chicken meat,
and bamboo shoots were purchased from Lotte Mart supermarket (District 10) and three
local markets, namely Tan Phuoc (District 11), Do Dac (District 2) and Nhat Tao (District
10) in Ho Chi Minh City, Vietnam. All samples were minced and homogenized, then kept
in clean, dry containers and stored in the refrigerator before being analyzed.
18
TẠP CHÍ KHOA HỌC - Trường ĐHSP TPHCM Phan Thi Ngoc Trinh et al.
2.4. Preparation of standard solutions
Stock standard solutions of AO and RB were prepared by dissolving each standard
compound in methanol in a volumetric flask at concentration of 1000 mg/L. The stock
standard solutions were further diluted with methanol to give 100 mg/L standard solutions
for the recovery tests. Calibration standards for AO and RB were prepared each day from
the certified standard stock solution in the range from 0.05 to 2.0 mg/L. All the standard
solutions were prepared in methanol.
2.5. Extraction procedure
Sample (0.5 g) was accurately weighed, added into a 50 mL centrifuge tube, then
mixed with acetonitrile:NH3 (0.5% v/v in water) at the ratio of 7:3. The sample was
thoroughly mixed well by a vortex shaker for 10 minutes and extracted under ultrasonic
assistance for 10 minutes at 40°C, then the mixture was centrifuged for 10 minutes and the
solution was transferred into a volumetric flask. The same treatment was performed three
times on the residual precipitates. All extraction solutions were combined and diluted to 25
mL with water, then filtered through a 0.22 μm filter of PTFE membrane before transferred
into glass vials for HPLC analysis.
3. Results and discussion
3.1. Optimization of HPLC-PDA condition
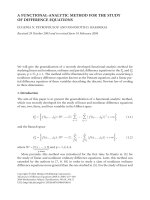
Visible spectrums of AO and RB in two solvents, methanol and acetonitrile, were
recorded in wavelength range of 400-600 nm on Perkin-Elmer Lambda 25. In Fig 2,
maximum absorbance at respective wavelengths 430 440 nm (AO) and 545 555 nm
(RB). With the same concentration of AO and RB in two solvents, the absorption signal
of RB in methanol was higher than the figure in acetonitrile, which was the main reason
for using methanol to dilute the stock standards. In this study, to achieve the best
analytical results, PDA operated and monitored the absorbance at 435 nm for AO and
555 nm for RB.
Fig 2. Molecular absorption spectra of AO and RB in methanol (a) and acetonitrile (b)
19
TẠP CHÍ KHOA HỌC - Trường ĐHSP TPHCM Tập 16, Số 6 (2019): 16-28
The mobile phase was optimized in these factors: pH, mobile phase composition, and
elution program because of their significant effects on the chromatographic separation
process.
Table 1. Mobile phase conditions
Mobile phase conditions Consequences
(1) Better elution, lower signal, tailing
Organic (1) ACN - CH3COOH peak (both AO, RB)
solvent (2) MeOH - CH3COOH (2) Better sensitivity but AO peak was
tailed
(1) MeOH - H3PO4 0,03% (pH 2.6) Good separation peak, resolution (Rs) >
pH 1.5, similarity of retention time, capacity,
and peak asymmetry factor
(2) MeOH - H3PO4 0,072% (pH 2.3)
Isocratic (1) MeOH - HCOOH (pH = 3) 40:60 (2)
elution ACN - HCOOH (pH = 3) 40:60
(3) ACN - acetate buffer (pH = 4,2)
80:20
Gradient 100 % MeOH Gradient 1 AO and RB weren’t separated in these
elution 80 Gradient 2 isocratic elution programs
(MeOH - 60
H3PO4 - Gradient 1: peak fronting for AO
0,03%) 40 minute chromatography, rising baseline and low
5 10 15 20 AO intensity.
20 - Gradient 2: narrow and symmetrical
0 peaks. HPLC chromatogram was shown
in Figure 3
Finally, the gradient mobile phase using methanol and 0.03% phosphoric acid
aqueous solution was chosen as the preferred mobile phase in the following experiments
due to its higher efficiency and reasonable analysis time.
20
TẠP CHÍ KHOA HỌC - Trường ĐHSP TPHCM Phan Thi Ngoc Trinh et al.
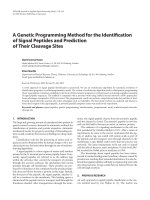
Fig 3. HPLC chromatogram of the standard solution at AO
(tR 14.48 min) and RB (tR 17.43 min) in 2.0 mg/L
3.2. Evaluation of range linearity, limit of detection (LOD) and limit of quantification
(LOQ)
From the data from the paper Ping Qi et al. (2016); Shruti Singh, Himani Shah,
Ritika Shah, and Krishna Shah (2017) and the prediction of small concentration of AO and
RB in food samples, the calibration curve was in range from 0.05 mg/L to 2.00 mg/L of
each dye concentration.
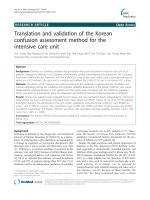
AO RB
y = 3022.8x - 62.647 6,000y = 2949.4x - 20.992
R² = 0.9999 R² = 0.9997
Signal (AU)6,000
Signal (AU)4,0004,000
2,000 2,000
0 0
0 0.5 1 1.5 2 0 0.5 1 1.5 2
Concentration (mg/L) Concentration (mg/L)
Fig 4. Calibration curves for AO and RB
Two calibration curves was linear in this range of concentration. The limits of
detection (LOD) and quantification (LOQ) of AO and RB were estimated by the signal-to-
noise S/N of each peak in the standard solutions. LOD and LOQ of these substances gained
0.02 mg/L and 0.05 mg/L, respectively.
3.3. Optimization extraction procedure
Accurately 5 g bamboo shoots sample was spiked 250 L mixture standard 100 mg/L.
The sample was kept in the refrigerator in 24 hours for optimizing the number of extraction.
Acetonitrile was used as an extraction solvent because AO and RB dissolved
completely in this solvent, which adopted to effectively remove the matrix-matched
components such as polar pigments, fatty acids, and protein in samples. The extraction
process was as follows: added 10 mL acetonitrile: NH3 (0.5% v/v in water) at the ratio of
7:3 to samples. The mixture was continued for 10 minutes in an ultrasonic bath, then was
21
TẠP CHÍ KHOA HỌC - Trường ĐHSP TPHCM Tập 16, Số 6 (2019): 16-28
centrifuged in 10 minutes. To optimize the sample preparation, the same treatment was
repeated three more times by using 5 mL of the solvent acetonitrile: NH3 each time. The
each time extract was transferred to a volumetric flask, and diluted with water to 25 mL.
The elution solution was filtered through a 0.22 μm filter of PTFE membrane and
transferred into glass vials for HPLC-PDA analysis.
Fig 5. Ratios of AO and RB in four times of extraction
As shown in Fig 5, the recovery ratio of AO and RB in bamboo shoots sample was
from 97.74% to 102.15% after three times of extraction. Therefore, the process extracted
three times using total 20 mL acetonitrile: NH3 (0.5% v/v in water), which was selected as
an optimum condition of extraction.
3.4. Method validation
To survey the repeatability of the measurement, a mixture standard of 2.0 mg/L AO
and 2.0 mg/L RB was measured 7 times by HPLC-PDA.
Table 2. Repeatability of signals
N Retention time (min) Peak area
AO RB AO RB
1 14.467 17.400 5664.660 5588.101
2 14.450 17.383 5753.625 5646.242
3 14.450 17.383 5787.972 5693.114
4 14.450 17.383 5761.298 5711.542
5 14.450 17.383 5812.427 5704.386
6 14.450 17.383 5802.885 5776.700
7 14.433 17.367 5800.698 5748.406
Mean
14.5 9.1x10⁻³ 17.4 8.8x10⁻³ 5769 47 5695 58
RSD% 0.63% 0.051% 0.82% 1.0%
22
TẠP CHÍ KHOA HỌC - Trường ĐHSP TPHCM Phan Thi Ngoc Trinh et al.
RSD of retention time and peak area were 0.63% and 0.82% (for AO); 0.051% and
1.0 % (for RB), respectively (n = 7). The method gained good precision. According to
AOAC, with RSD value ≤ 1.8%, the result by HPLC-PDA had good precision.
Method validation and quality control were ensured using blanks and spiked
samples.
Fig 6. HPLC chromatograms of spiked chicken meat sample (a) and chicken meat sample (b)
Fig 7. HPLC chromatograms of spiked bamboo shoots sample (a)
and bamboo shoots sample (b)
23
TẠP CHÍ KHOA HỌC - Trường ĐHSP TPHCM Tập 16, Số 6 (2019): 16-28
There was a similarity in retention time of noise peaks in spiked samples and
samples (Fig 6a, Fig 6b, Fig 7a, and Fig 7b). Meanwhile, using the peak purity test
function of PDA detector, peaks of AO and RB in spiked samples were 100% purity (Fig
6a and Fig 7a). Consequently, the analytical results showed that AO and RB could be
determined exactly in this method without the interferences of the food matrices.
Recoveries were determined as following: 5 g of a chicken meat sample spiked with
mixture standard, then the sample was kept in the refrigerator in 24 hours until analysis.
Table 3. Recoveries of AO and RB in the recovery samples
Concentration (µg/g) Peak area Recovery (%)
AO RB AO RB
888.191 1954.000 91.52 93.27
900.504 1949.214 92.79 93.04
868.357 1866.296 89.48 89.08
891.151 1982.437 91.83 94.63
0.5 883.218 1928.280 91.01 92.04
885.340 1869.000 91.23 89.21
857.136 1861.447 88.32 88.85
Mean 90.9 ± 1.4 91.4 ± 2.2
1918.208 4345.709 102.54 100.80
1894.076 4334.987 101.25 100.55
1883.574 4292.576 100.68 99.57
1981.334 4432.542 105.91 102.82
1.0 1926.163 4384.205 102.96 101.70
1903.961 4163.081 101.77 96.57
1812.305 4251.641 96.87 98.62
Mean 101.7 ± 2.5 100.1 ± 1.9
2656.685 5997.764 91.51 94.70
2650.758 5788.187 91.31 91.39
2409.565 5354.113 83.00 84.54
2477.072 5661.422 85.33 89.39
1.5 2496.536 5682.338 86.00 89.72
2525.13 5983.245 86.98 94.47
2716.479 6169.421 93.57 97.41
Mean 88.2 ± 3.6 91.7 ± 4.0
24
TẠP CHÍ KHOA HỌC - Trường ĐHSP TPHCM Phan Thi Ngoc Trinh et al.
The recoveries of AO and RB were determined by using this method and achieved in
range from 83.00% to 105.91%. Therefore, this analytical method could be applied to
determine AO and RB in foodstuffs.
3.5. Some analytical results
This given method was applied to monitor AO and RB in nine food samples
collected from some markets in Ho Chi Minh City.
Table 4. Information of food samples
Samples Name Location
M1 Nhat Tao market
Pickled collard greens M2 Tan Phuoc market
M3 Do Dac market
M4 Lotte Mart
Chicken meat M5 Tan Phuoc market
M6 Do Dac market
M7 Nhat Tao market
Bamboo shoots M8 Tan Phuoc market
M9 Do Dac market
The results showed that both AO and RB were absence in nine samples. The sample
M7 was sent to the analytical laboratory of Hoan Vu Scientific Technologies Company
Limited for control analysis by LC-MS/MS method. LOD of Hoan Vu laboratory’s method
for AO and RB were 0.005 mg/L and 0.05 mg/L, respectively. The result of LC-MS/MS
method was totally appropriate to the result in this study.
25
TẠP CHÍ KHOA HỌC - Trường ĐHSP TPHCM Tập 16, Số 6 (2019): 16-28
Fig 8. HPLC chromatograms of spiked pickled collard greens sample (a)
and pickled collard greens sample (b)
4. Conclusion
In this study, HPLC-PDA method was developed and validated for simultaneous
analysis of AO and RB in food samples. While the LOD and LOQ achieved by this method
were 0.02 mg/L and 0.05 mg/L for two dyes, the recoveries ranged from 83.00% to
105.91%. The method was applied to determine two dyes in nine samples (pickled collard
greens, chicken meat, and bamboo shoots) and the analytical results shows that these dyes
were absent from all monitored samples. This study showed that HPLC-PDA is a reliable
and fast tool for monitoring these dyes in foodstuffs in small and medium analytical
laboratories.
Conflict of Interest: Authors have no conflict of interest to declare.
REFERENCES
Adejumoke, A. Inyinbor, Folahan, A., Adekola,b & Gabriel A. Olatunji. (2015). Adsorption of
Rhodamine B Dye from Aqueous Solution on Irvingia gabonensis Biomass: Kinetics and
Thermodynamics Studies. 68, 115-125.
Agents classified by the IARC Monographs. (2019). International Agency for Research on Cancer,
1-123.
Brazeau, J. (2018). Identification and Quantitation of Water-Soluble Synthetic Colors in Foods by
Liquid Chromatography/Ultraviolet-Visible Method Development and Validation. ACS
Omega, 3, 6577-6586.
Dong-yang Chen, Hao Zhang, Jia-li Feng, Dong Zeng, Li Ding, Xian-jun Liu, & Bang-rui Li.
(2017). Research on the Determination of 10 Industrial Dyes in Foodstuffs. Journal of
Chromatographic Science, 55(10), 1021-1025.
26
TẠP CHÍ KHOA HỌC - Trường ĐHSP TPHCM Phan Thi Ngoc Trinh et al.
Le Thi Huong Hoa, Nguyen Thi Hoang Lien, Thai Nguyen Hung Thu, & Trinh Van Lau. (2011).
Method development of determination of illegal dye Rhodamine B in cosmetics. Vietnam
Pharmaceutical Journal, 51(10), 23-27.
Nguyen Thi Kim Thuong, Pham Tuan Anh. (2017, Sep-Oct). Study on determination Auramine O
in food samples by differential pulse adsorptive stripping voltammetry. Testing today -
Journal of Vietnam Asscociation of Testing Laboratories, (1), 6-10.
Peng Wang, Mingming Cheng, & Zhonghai Zhang. (2014). On different photodecomposition
behaviors of rhodamine B on laponite and montmorillonite clay under visible light
irradiation. Journal of Saudi Chemical Society, 18(4), 308-316.
Ping Qi, Zhi-an Liang, Yu wang, Jian Xiao, Jia Liu, Qing-qiong Zhou, Chun-hao Zheng, Li-ni Luo,
Zi-hao Lin, Fang Zhu, & Xue-wu Zhang. (2016). Mixed hemimicelles solid-phase extraction
based on sodium dodecyl sulfate-coated nano-magnets for selective adsorption and
enrichment of illegal cationic dyes in food matrices prior to high-performance liquid
chromatography-diode array detection detec. Journal of Chromatography A, 1437, 25-36.
Sabnis R.W. (2010). Synthesis and Industrial Applications. In Handbook of biological dyes and
stains (pp. 27-29). John Wiley & Sons, Inc., Publication.
Shruti Singh, Himani Shah, Ritika Shah, & Krishna Shah. (2017). Identification and Estimation of
Non-Permitted Food Colours (Sudan and Rhodamine-B Dye) In Chilli and Curry Powder by
Rapid Colour Test, Thin Layer Chromatography and Spectrophotometry. International
Journal of Current Microbiology and Applied Sciences, 6(7), 1970-1981.
Vietnamese Ministry of Health. (n.d.). Decision Issuing the "Regulation of the list of additives
permitted for use in food". In 3742/2001/QĐ-BYT.
Vietnamese Ministry of Heathy. (n.d.). The Circular issued the list of food, food additives, food
processing support substances and tools, packaging materials, containing food to be
identified as a commodity code according to the list of exported and imported goods to
Vietnam. In 05/2018/TT-BYT.
Vietnamese Ministry of Science and Technology. (n.d.). Foodstuffs - Determination of rhodamine
B by high performance liquid chromatography (HPLC). In TCVN 8670: 2011.
Xue Wang, Hui-Ling Duan, Shi-Yao Ma, Jun Wang, Han-Ying Zhan & Zhi-Qi Zhang. (2018).
Selective adsorption and separation of illegal cationic dyes from foodstuffs with anionic
polyelectrolyte functionalization of metal-organic frameworks. Food Additives &
Contaminants: Part A, 35(10), 1870-1880.
Yung-Yi Cheng, & Tung-Hu Tsai. (2016). A validated LC–MS/MS determination method for the
illegal food additive rhodamine B: Applications of a pharmacokinetic study in rats. Journal
of Pharmaceutical and Biomedical Analysis, 125, 394-399.
27
TẠP CHÍ KHOA HỌC - Trường ĐHSP TPHCM Tập 16, Số 6 (2019): 16-28
XÂY DỰNG VÀ ĐÁNH GIÁ PHƯƠNG PHÁP HPLC-PDA DÙNG ĐỂ XÁC ĐỊNH
ĐỒNG THỜI AURAMINE O VÀ RHODAMINE B TRONG THỰC PHẨM
Phan Thị Ngọc Trinh1, Nguyễn Thanh Thơi1, Huỳnh Thị Nhàn1,
Nguyễn Ngọc Hưng1, Nguyễn Thị Tuyết Nhung1*, Lê Thị Hồng Vân2, Lê Văn Huấn2
Khoa Hóa học – Trường Đại học Sư phạm Thành phố Hồ Chí Minh
Trung tâm Khoa học và Cơng nghệ Dược Sài Gịn – Trường Đại học Y Dược Thành phố Hồ Chí Minh
* Corresponding author: Nguyễn Thị Tuyết Nhung – Email:
Ngày nhận bài: 18-3-2019; ngày nhận bài sửa: 11-4-2019; ngày duyệt đăng: 15-6-2019
TÓM TẮT
Nghiên cứu này phát triển phương pháp HPLC-PDA với mục đích xác định hai thuốc nhuộm
Auramine O và Rhodamine B trong các mẫu thực phẩm. Giới hạn phát hiện và giới hạn định lượng
của Auramine O (AO) và Rhodamine B (RB) cùng có giá trị lần lượt là 0,02 mg/L và 0,05 mg/L. Hệ
số thu hồi của AO và RB trong nền mẫu thực phẩm có giá trị trong khoảng 83,00% đến 105,91% ở
các nồng độ chất phân tích 0,5 µg/g, 1,0 µg/g và 1,5 µg/g. Phương pháp phân tích được thực hiện
đơn giản, có kết quả chính xác và phù hợp để định lượng các thuốc nhuộm này trong thực phẩm.
Từ khóa: Auramine O, Rhodamine B, HPLC-PDA, thực phẩm.
28