COMPUTER ADAPTIVE TESTING SYSTEM FOR CONTINUOUS PROGRESS MONITORING OF MATH GROWTH FOR STUDENTS PREKINDERGARTEN THROUGH GRADE 8
Bạn đang xem bản rút gọn của tài liệu. Xem và tải ngay bản đầy đủ của tài liệu tại đây (2.79 MB, 44 trang )
Istation’s Indicators of Progress (ISIP)™
Math
Technical Report
Computer Adaptive Testing System for Continuous Progress Monitoring of Math
Growth for Students Prekindergarten through Grade 8
Copyright © 2018 Istation, Inc. All rights reserved
Table of Contents
Chapter 1: Introduction ......................................................... 1-1
The Need to Link Math Assessment to Instructional Planning ...................................... 1-2
Continuous Progress Monitoring ........................................................................ 1-3
Computer Adaptive Testing ............................................................................. 1-4
ISIP Math and ISIP Early Math Domains ................................................................ 1-5
ISIP Math and ISIP Early Math Items.................................................................... 1-8
The ISIP Math and ISIP Early Math Link to Instructional Planning.................................1-10
Chapter 2: IRT Calibration and the CAT Algorithm Grades Pre-K – 1..... 2-1
Data Analysis and Results ............................................................................... 2-3
CAT Algorithm............................................................................................. 2-5
Ability Estimation................................................................................ 2-6
Chapter 3: IRT Calibration and the CAT Algorithm Grades 2–8 ........... 3-1
Data Analysis and Results ............................................................................... 3-3
CAT Algorithm............................................................................................. 3-6
Ability Estimation................................................................................ 3-7
Chapter 4: Reliability and Validity of ISIP Math ............................. 4-1
Reliability.................................................................................................. 4-2
Validity Evidence ......................................................................................... 4-3
Full Validity Study ............................................................................... 4-7
ISIP Math and ISIP Early Math Technical Report (Rev. 2/18) i
Chapter 5: Determining Norms................................................. 5-1
Sample ..................................................................................................... 5-4
Computing Norms......................................................................................... 5-5
Instructional Tier Goals.................................................................................. 5-6
Chapter 6: References .......................................................... 6-1
ii ISIP Math and ISIP Early Math Technical Report (Rev. 2/18)
Chapter 1: Introduction
Istation’s Indicators of Progress for Math (ISIP™ Math for grades 2-8 and ISIP Early Math for
prekindergarten through 1st grade) are sophisticated, web-delivered, computer-adaptive
testing (CAT) systems that provide continuous progress monitoring (CPM) in the subject area
of mathematics.
Assessments are computer-based, and teachers can arrange for entire classrooms to take
assessments as part of scheduled computer lab time or individually as part of a workstation
rotation conducted in the classroom. Each assessment period requires approximately 30
minutes. Given adequate computer resources, it would be feasible to administer ISIP Math or
ISIP Early Math assessments to an entire classroom, an entire school, or even an entire district
in a single day. Classroom and individual student results are available in real time to
teachers, illustrating each student’s past and present performance on mathematical
concepts. Teachers are alerted when a particular student is not making adequate progress so
that the instructional program can be modified before a pattern of failure becomes
established.
ISIP Early Math is designed for students in prekindergarten through 1st grade. The ISIP Early
Math assessment is a computer-based universal screener designed to help teachers identify
students struggling to learn critical mathematics content. ISIP Early Math provides teachers
and other school personnel with easy-to-interpret, web-based reports that detail student
strengths and deficits, helping to inform teachers’ instructional decision-making. Using this
data allows teachers to more easily make informed decisions with regard to each student’s
response to targeted mathematics instruction and intervention strategies.
ISIP Math is designed in a testing format that is familiar to most students in grades 2–8. Each
item contains a question stem and four answer choices. As with ISIP Early Math, ISIP Math
provides teachers and other school personnel with easy-to-interpret, web-based reports that
detail student strengths and deficits.
Both ISIP Early Math and ISIP Math provide links to teaching resources and targeted
intervention strategies. Computer-adaptive assessments measure each student’s overall
proficiency and mathematical ability.
ISIP Math and ISIP Early Math Technical Report (Rev. 2/18) 1-1
The Need to Link Math Assessment to Instructional
Planning
It is well established that assessment-driven instruction is effective. Teachers who monitor
their students’ progress and use this data to inform instructional planning and decision-
making have higher student outcomes than those who do not (Conte and Hintze 2000; Fuchs
et al. 1992; Mathes et al. 1998). These teachers also have a more realistic idea of the
capabilities of their students than teachers who do not regularly use student data to inform
their decisions (Fuchs et al. 1984; Fuchs et al. 1991; Mathes et al. 1998).
However, before a teacher can identify students at risk of mathematics failure and
differentiate instruction, that teacher must first have information about the specific needs of
his or her students. To effectively link assessment with instruction, math assessments need
to:
identify students at risk of having difficulty in math (i.e., students that may need
extra instruction or intensive intervention if they are to progress toward grade-level
standards in math by year’s end);
monitor student progress for growth on a frequent, ongoing basis and identify students
falling behind;
provide information about students that will be helpful in planning instruction to meet
their needs; and
assess whether students have achieved grade-level mathematics standards by year’s
end.
In any model of instruction, for assessment data to affect instruction and student outcomes,
it must be relevant, reliable, and valid.
To be relevant, data must be available on a timely basis and target important skills
that are influenced by instruction.
To be reliable, there must be a reasonable degree of confidence in student scores.
To be valid, the skills assessed must provide information that is related to future
mathematical ability.
There are many reasons why a student score from a single point in time under one set of
conditions may be inaccurate: confusion, shyness, illness, mood or temperament,
communication or language barriers between student and examiner, scoring errors, or
inconsistencies in examiner scoring. However, by gathering assessments across multiple time
points, student performance is more likely to reflect actual ability. Using the computer also
reduces inaccuracies related to human administration errors.
1-2 ISIP Math and ISIP Early Math Technical Report (Rev. 2/18)
The collection of sufficient, reliable assessment data on a continuous basis can be an
overwhelming and daunting task for schools and teachers. Screening and inventory tools use a
benchmark or screen schema in which assessments are administered three times a year. More
frequent continuous progress monitoring is recommended for all low-performing students, but
administration is at the discretion of already overburdened schools and teachers.
These assessments, even in their handheld versions, require a significant amount of work to
administer individually to each student. The examiners who implement these assessments
must also receive extensive training in both the administration and scoring procedures to
uphold the reliability of the assessments and avoid scoring errors. Because these assessments
are so labor intensive, they are very expensive for school districts to implement and difficult
for teachers to use for ongoing progress monitoring and validation of test results. Moreover,
there is typically a delay between when an assessment is given to a student and when the
teacher is able to receive and review the results of the assessment, making its utility for
planning instruction less than ideal.
Continuous Progress Monitoring
ISIP Math and ISIP Early Math grow out of the model of continuous progress monitoring (CPM)
called Curriculum Based Measurement (CBM). This model of CPM is an assessment
methodology for obtaining measures of student achievement over time. This is done by
repeatedly sampling proficiency in the school’s curriculum at a student’s instructional level,
using parallel forms at each testing session (Deno 1985; Fuchs and Deno 1991; Fuchs et al.
1983). Parallel forms are designed to globally sample academic goals and standards reflecting
end-of-grade expectations. Students are then measured in terms of movement toward those
end-of-grade expectations. A major drawback to this type of assessment is that creating truly
parallel forms of any assessment is virtually impossible; thus, student scores from session to
session will reflect some inaccuracy as an artifact of the test itself.
Computer Application
The challenge with most CPM systems is that they have been cumbersome for teachers to
implement and use (Stecker and Whinnery 1991). Teachers have to administer tests to each
student individually and then graph the data by hand. The introduction of hand-held
technology has allowed for organizing and displaying student results more easily, but
information in this format is often not available on a timely basis. Even so, many teachers
find administering such assessments onerous. The result has been that CPM has not been as
widely embraced as originally hoped, especially within general education.
Computerized CPM applications, however, are a logical step toward increasing the likelihood
that continuous progress monitoring occurs more frequently with monthly or even weekly
ISIP Math and ISIP Early Math Technical Report (Rev. 2/18) 1-3
assessments. Computerized CPM applications using parallel forms have been developed and
used successfully in upper grades for reading, mathematics, and spelling (Fuchs et al. 1995).
Computerized applications save time and money. They eliminate burdensome test
administrations and scoring errors by calculating, compiling, and reporting scores. They
provide immediate access to student results that can be used to affect instruction. They
provide information organized in formats that automatically group students according to risk
and recommended instructional levels. Student results are instantly plotted on progress
charts with trend lines projecting year-end outcomes based upon growth patterns, eliminating
the need for the teacher to manually create monitoring booklets or analyze results.
Computer Adaptive Testing
With recent advances in computer adaptive testing (CAT) and computer technology, it is now
possible to create CPM assessments that adjust to the actual ability of each student. Thus,
CAT replaces the need to create parallel forms. Assessments built on CAT are sometimes
referred to as “tailored tests” because the computer selects items for students based on their
individual performance, thus tailoring the assessment to match the performance abilities of
each student.
There are many advantages to using a CAT model rather than the traditional parallel forms
model, as is used in many math instruments. For instance, it is virtually impossible to create
alternate forms of any truly parallel assessment. The reliability from form to form will always
be somewhat compromised. However, when using a CAT model, it is not necessary that each
assessment be of identical difficulty to the previous and future assessments.
In CAT models, each item within the testing battery is assessed to determine how well it
discriminates ability among students and how difficult it actually is through a process called
Item Response Theory (IRT). Once these parameters have been determined for each item, the
CAT algorithm can be programmed. Using this sophisticated computerized algorithm, the
computer adaptively selects items based on each student’s performance during the
assessment. Test questions range from easy to hard for each covered strand. To identify the
student’s overall ability and individual skill level, the difficulty of the test questions
presented changes with every response.
If a student answers questions correctly on the ISIP assessment, the program will present
questions that are more challenging until the student shows mastery or responds with an
incorrect answer. When a student answers a question incorrectly, ISIP will present less
difficult questions until the student begins answering correctly again. Through this process of
selecting items based on student performance, the computer is able to generate “probes”
that have higher reliability than those typically associated with alternate formats and that
1-4 ISIP Math and ISIP Early Math Technical Report (Rev. 2/18)
better reflect each student’s true ability. The ability score shows how a student is performing
compared to their previous performance and to other students at the same grade level.
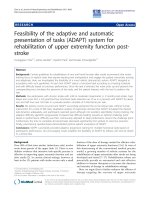
Then, either the
student answers
correctly and is given
a more difficult item.
First, the student This method
is presented with continues until the
item. student's weaknesses
are identified.
Or the student
answers incorrectly
and is given a less
difficult item.
ISIP Math and ISIP Early Math assessments are delivered at established intervals (usually
monthly) to the appropriate grade level for each student throughout a nine-month school
year. This provides opportunity for teachers to identify where students fall within grade-level
expectations and assists teachers in preparing for state standardized assessments which are
typically delivered only at grade-level standards.
ISIP Math and ISIP Early Math Domains
Designed for students in prekindergarten through 8th grade, ISIP Early Math and ISIP Math
provide teachers and other school personnel with easy-to-interpret, web-based reports that
detail student strengths and deficits and provide links to additional intervention resources.
Using this data allows teachers to more easily make informed decisions regarding each
student’s response to targeted math instruction and intervention strategies. Reports from the
ISIP assessment provide teachers with the information they need to know, including:
if students have deficits in math skills that could place them at risk for failure;
if instruction is having the desired effect of raising students’ math knowledge; and
if students are making progress in comprehending increasingly challenging material.
ISIP Math and ISIP Early Math Technical Report (Rev. 2/18) 1-5
ISIP Math and ISIP Early Math measures proficiency in the six primary domains of
mathematical reasoning and processes — number sense, operations, algebra, geometry,
measurement, and data analysis — as defined by the National Council of Teachers of
Mathematics (NCTM), and it also measures personal financial literacy (PFL) as determined by
the Texas Essential Knowledge and Skills (TEKS).
Number Sense
The fundamental basis of all mathematics is understanding numbers and having awareness of
the relationships among numbers. Students must be taught to recognize how numbers are
represented as well as number systems and counting sequences. Instruction in this essential
area is the most fundamental content standard.
Operations
Comprehension of mathematical operations, concepts, and relations is critical to developing
an understanding of number value and sequence. For example, what does it mean to add,
subtract, multiply, or divide? How do these functions impact value? The ability to estimate
and perform mental calculations as well as calculate answers on paper are both crucial
components to achieving success in math.
Algebra
Students must be able to comprehend statements of relations, mathematical symbols, and
rules for ordering and executing computations using them. The skills related to algebra that
all students must learn include, but are not limited to:
recognizing and comprehending numerical patterns, relationships, and functions;
applying mathematical constructs to explain quantitative relationships;
illustrating computational examples using algebraic symbols; and
evaluating variance in mathematical situations.
Geometry
The ultimate goal of geometry is to arm students with foundational skills to accomplish
everyday tasks such as describing shapes and angles, recognizing patterns and measurements,
and even reading a map. The geometry concepts that must be taught to encourage student
achievement in geometry include but are not limited to:
calculating area and perimeter of two-dimensional geometric shapes;
1-6 ISIP Math and ISIP Early Math Technical Report (Rev. 2/18)
analyzing volume, surface area, and other properties of three-dimensional geometric
shapes;
constructing equations and statements to describe geometric relationships;
characterizing spatial relationships and using coordinates to identify location; and
applying spatial reasoning, geometric modeling, and concepts of symmetry to
mathematical contexts.
Measurement
Measurement skills are unique in that students often inherently recognize their practical
significance. Comprehension of measurement also provides many opportunities to practice
and apply many other math skills, especially geometry and operations. Students must learn
about different systems of measurements (metric vs. customary), formulae for calculating
measurements (length/height, area/perimeter, weight/capacity/volume), application of
appropriate tools (ruler vs. protractor), and dimensions of time and money.
Data Analysis
Beyond number recognition and operational aptitude, students must be able to form and
evaluate numerical inferences and then formulate accurate mathematical conclusions. The
analytical math concepts that all students should learn include, but are not limited to:
reading, creating, and interpreting graphs and charts;
devising and answering formulaic expressions using collected and organized data;
analyzing data by recognizing appropriate statistical modes; and
comprehending and executing basic probability concepts.
ISIP Math and ISIP Early Math Technical Report (Rev. 2/18) 1-7
ISIP Math and ISIP Early Math Items
The unique item banks for ISIP Math assessments are designed to provide an accurate
computer-adaptive universal screening and progress-monitoring assessment system that can
support and inform teachers’ instructional decisions. By administering the grade-appropriate
assessments, teachers and administrators can then use the results to answer two questions:
1. Are students in the designated grade at risk of failing math?
2. What degree of instructional support will students require to be successful at math?
Because the assessments are designed to be administered at regular intervals, these decisions
can be applied throughout the course of the school year (Hill, S., Ketterlin-Geller, L.R., &
Gifford, D.B., 2012).
The ISIP Math and ISIP Early Math assess both proficiency in mathematical concepts and
students’ level of cognitive engagement.
Table 1-1. ISIP Skills and Domains. Conceptual
Strands of Proficiency for Cognitive Engagement Understanding
Strategic Competence Adaptive Reasoning Procedural Fluency
Probability and
Mathematical Domains Statistics
Ratios and
Number Sense Algebra Measurement Proportional
Data Analysis Relationships
Operations Geometry
The mathematical content (by domain) of the assessment is based on:
the Curriculum Focal Points (developed by National Council of Teachers of
Mathematics [NCTM] in 2006,
the mathematics content standards published by the Common Core State Standards
Initiative, and
state standards from California, Florida, New York, Texas, and Virginia.
The cognitive engagement dimension refers to the level of cognitive processing at which
students are expected to engage with an assessment item.
Levels of cognitive processing consists of five interdependent strands that promote
mathematical proficiency:
1-8 ISIP Math and ISIP Early Math Technical Report (Rev. 2/18)
1. conceptual understanding
2. procedural fluency
3. strategic competence
4. adaptive reasoning
5. productive disposition
The formative assessment item bank assesses student understanding of the content at varying
levels of cognitive engagement. The item bank incorporates four of the five strands.
Productive disposition is not assessed (Hill, S., Ketterlin-Geller, L.R., & Gifford, D.B., 2012).
To access the complete technical reports for the Universal Screener Instrument Development
for pre-K through 1st grade and the Universal Screener and Inventory Instruments Interface
Development for pre-K through 1st grade, refer to the external links provided at the end of
this report. To access the technical reports for the Universal Screener Instrument
Development for each grade level 2 through 8, refer to the external links provided at the end
of this report.
Teacher Friendly
ISIP Math and ISIP Early Math are teacher friendly. Each assessment is computer based,
requires little administrative effort, and requires no teacher/examiner testing or manual
scoring. Teachers simply monitor student performance during assessment periods to ensure
reliability and accuracy of results. In particular, teachers are alerted to observe any students
identified by ISIP Math or ISIP Early Math (depending on grade level) who are experiencing
difficulties as they complete the assessment. They subsequently review student results to
validate outcomes. For students whose skills may be a concern, based upon performance
level, teachers may easily validate student results by re-administering the entire ISIP Math or
ISIP Early Math as an On-Demand assessment.
Student Friendly
Both the ISIP Math and ISIP Early Math are student friendly. Each assessment session in ISIP
Early Math gives students the feeling of shopping in a grocery store called Mario’s Market. At
the beginning of the session, Mario appears onscreen and welcomes the student briefly before
the assessment begins. Assessment delivery is presented in a developmentally appropriate
format with respect to students’ reading skills, fine/gross motor skills, and hand-eye
coordination. Consideration of young students’ fine motor skills informs navigation design and
managing assessment interfaces that allow as much hands-on/manipulative-based interaction
as possible. The singular interface theme of Mario’s Market is used to minimize student
distractions and unnecessary cognitive load.
ISIP Math and ISIP Early Math Technical Report (Rev. 2/18) 1-9
Similarly, each assessment session in ISIP Math begins with an introduction from a familiar
Istation Math character, the Chief. The Chief briefly explains that the student’s mathematical
knowledge demonstrated on the assessment will help them become a secret agent. He
informs the student that once the assessment is complete, they will participate in math
missions with Donnie, Stix, and Angel to defeat villains and save the world. This ties together
the ISIP Math and the instruction in Istation Math. Additionally, it provides motivation for
students to do their best when completing the assessment.
The ISIP Math and ISIP Early Math and
Instructional Planning
ISIP Math and ISIP Early Math provide continuous assessment results that can be used in
recursive assessment instructional decision loops.
First, each assessment identifies students in need of support.
Second, validation of student results and recommended instructional levels can easily be
verified by re-administering assessments. If a student’s results seem inconsistent with other
ISIP Math data points, the teacher can use the On-Demand feature of the Istation website at
www.istation.com. By assigning additional assessments to individual students, results can be
compared and evaluated by the teacher. When the On-Demand feature is used, the
assessment will be automatically administered the next time a student logs in.
Third, the delivery of student results facilitates the evaluation of curriculum and instructional
plans. The technology behind ISIP Math and ISIP Early Math delivers real-time evaluation of
results, and reports on student progress are immediately available upon assessment
completion. Assessment reports automatically group students by level of support needed.
Data is provided in both graphic and detailed numerical format for every test administration
and for every level of a district’s reporting hierarchy. Reports provide summary information
for the current and prior assessment periods that can be used to evaluate curriculum, plan
instruction and support, and manage resources.
At each assessment period, ISIP Math and ISIP Early Math automatically alert teachers to
students in need of instructional support via the Priority Report. Students are grouped
according to instructional level. Links to relevant teacher directed lessons and other
instructional materials are provided for each instructional level. When student performance
on assessments is below the goal for several consecutive assessments, teachers are further
notified in order to raise teacher concern and signal the need to consider additional or
different forms of instruction.
1-10 ISIP Math and ISIP Early Math Technical Report (Rev. 2/18)
A complete history of Priority Report notifications, including the current year and all prior
years, is maintained for each student. On the report, teachers may acknowledge that
suggested interventions have been provided. A record of these interventions is maintained
with the student history as an intervention audit trail. This history can be used for special
education Individualized Education Plans (IEPs) and in Response to Intervention (RTI) or other
models of instruction to modify a student’s instructional plan.
In addition to the recommended activities, instructional coaches, intervention specialists, and
teachers have access to an entire library of teacher directed lessons and support materials at
www.istation.com. Districts and schools may also elect to enroll students in Istation’s
computer-based math intervention program, Istation Math. This program provides
individualized instruction based on a student’s results from ISIP Math or ISIP Early Math.
Student results from Istation Math are combined with ISIP Math or ISIP Early Math results to
provide a more accurate profile of a student’s strengths and weaknesses that can help inform
and enhance teacher planning.
All student information is automatically available, sorted by demographic classification and
by designated subgroups of students who may need to be monitored. As students progress in
the program, a year-to-year history of ISIP Math or ISIP Early Math results will be available.
Administrators, principals, and teachers may use these reports to evaluate and modify
curriculum, intervention strategies, the effectiveness of professional development, and
personnel performance.
ISIP Math and ISIP Early Math Technical Report (Rev. 2/18) 1-11
Chapter 2: IRT Calibration and the CAT
Algorithm Grades Pre-K – 1
The goals of this study were to determine the appropriate item response theory (IRT) model,
estimate item-level parameters, and tailor the computer adaptive testing (CAT) algorithms,
such as the exit criteria.
During the 2014-2015 school year, data were collected from schools across the country so that
ISIP™ Early Math (pre-K through 1st grade) would be available for schools in the 2015-2016
school year. All students in prekindergarten through 1st grade were invited to participate,
including students with disabilities and English language learners. There were no specific
demographic requirement for participants.
Tests were administered by computer to groups in a classroom or computer lab setting. There
were 397 items for prekindergarten, 401 items for kindergarten, and 395 items for 1st grade.
The items were divided into nine test forms per grade with linking items between forms. Each
test form lasted 20-25 minutes for prekindergarten students and 30-45 minutes for
kindergarteners and 1st grade students. Each grade level had its own item pool with no
linking items between those pools; prekindergarten test forms were only taken by students in
prekindergarten, kindergarten test forms were only taken by kindergarteners, and 1st grade
test forms were only taken by 1st grade students.
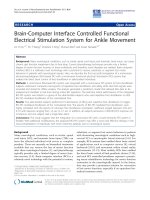
Approximately 5,000 students per grade level participated in this study. The majority of
students did not provide demographic information, but 1,006 prekindergartners, 556
kindergarteners, and 705 1st graders did provide such information. The information from
these students is reported in Table 2-1.
ISIP Math and ISIP Early Math Technical Report (Rev. 2/18) 2-1
Table 2-1. Student Demographics Grades Pre-K – 1.
Students Prekindergarten Kindergarten Grade 1
Frequency (%) Frequency (%) Frequency (%)
Gender 500 (49.7) 299 (53.8) 372 (52.8)
Male 506 (50.3) 257 (46.2) 333 (47.2)
Female
778 (77.3) 107 (19.2) 133 (18.9)
Ethnicity 3 (0.3) 4 (0.7) 5 (0.7)
African American 2 (0.2) 8 (1.4) 4 (0.6)
American Indian 12 (1.2) 7 (1.0)
Asian 102 (18.3)
Hispanic 172 (17.1) 298 (53.6) 277 (39.3)
White 39 (3.9) 279 (39.6)
Unknown 37 (6.7)
41 (4.1) 10 (1.4)
Receiving Special Ed 915 (91.0) 8 (1.4) 289 (41.0)
Services 145 (26.1)
10 (1.0) 106 (15.0)
Yes 1 (0.1) 74 (13.3) 175 (24.8)
No 79 (14.2)
10 (1.0) 6 (0.9)
Receiving Free/Reduced 1 (0.1) 1 (0.2) 274 (38.9)
Lunch 152 (27.3)
— 1 (0.1)
Yes — 1 (0.2) —
No —
Receiving ESL Services
Yes
No
Disability
Yes
No
2-2 ISIP Math and ISIP Early Math Technical Report (Rev. 2/18)
Data Analysis and Results
A two-parameter logistic IRT (Item Response Theory) model (2PL IRT) was posited. We defined
the binary response data, xij, with index i = 1, ... n for persons, and index j = 1, ... j for
items. The binary variable xij = 1 was used if the response from student i to item j was
correct, and the binary variable xij = 0 was used if the response was wrong. In the 2PL IRT
model, the probability of a correct response from examinee i to item j was defined as:
Pj (i ) exp a j (i bj )
1 exp a j (i bj )
The variable θi is examinee i’s ability parameter, bj is item j’s difficulty parameter, and aj is
item j’s discrimination parameter.
While the marginal maximum likelihood estimation (MMLE) approach by Bock and Aitkin
(1981) has many desirable features compared to earlier estimation procedures, such as
consistent estimates and manageable computation, there are some limitations. For example,
items must be eliminated if they are answered correctly by all of the examinees or if they are
answered incorrectly by all. Also, item discrimination estimates near zero can result in very
large absolute values of item difficulty estimates, which may fail the estimation process and
no ability estimates can be obtained. To overcome these limitations, we employed a full
Bayesian framework to fit the IRT models. More specifically, the likelihood function based on
the sample data is combined with the prior distributions assumed on the set of the unknown
parameters to produce the posterior distribution of the parameters; the inference is then
based on the posterior distribution.
There are two roles played by the prior distribution. First, if we have information from
experts or previous studies on the IRT parameters, such as a certain group of items being
more challenging, we can utilize the data from the prior studies to help produce more stable
estimates. On the other hand, if we know little about those parameters, we could use the
non-informative prior data alongside a large variance to reflect this uncertainty. Second, in
the Bayesian estimation, the primary effect of the prior distribution is to shrink the estimates
toward the mean of the prior. The shrinkage towards the prior mean helps prevent deviant
parameter estimates. Furthermore, with the Bayesian approach, there is no need to eliminate
any data.
As for the prior specification, we assumed that the j item difficulty parameters are
independent, as are the j item discrimination parameters and the n examinee ability
parameters. We initially assigned the subject ability parameters and item difficulty
parameters non-informative, two-stage, normal priors:
ISIP Math and ISIP Early Math Technical Report (Rev. 2/18) 2-3
θi ~ N(0,τθ,) i = 1, ... n
δj ~ N(0,τδ ,) j = 1, ... j
Variance parameters τθ and τδ each follow a conjugate inverse gamma prior to introduce more
flexibility (where a and b are fixed values):
τθ ~IG(aθ, bθ)
τθ ~IG(aδ, bδ)
The hyperparameters were assigned to produce vague priors. From Berger (1985), Bayesian
estimators are often robust to changes of hyperparameters when non-informative or vague
priors are used. We let aθ = aλ = 2 and bθ = bδ = 1, allowing the inverse gamma priors to have
infinite variances.
By definition, the item discrimination parameters are necessarily positive, so we assumed a
gamma prior:
λ ~ Gamma(aλ, bλ), j = 1, ... j.
The hyper-parameters were defined as aλ = bλ = 1.
The Gibbs sampler, a Bayesian parameter estimation technique, was employed to obtain item
parameter estimates by way of a BILOG program. The resulting analysis produced two
parameter estimates for each item: an item difficulty parameter and an item discrimination
parameter (which indicates how well an item discriminates between students with low math
ability and students with high math ability). Items that did not meet Istation criteria were
removed.
A huge sample size was used in this study. For prekindergarten, the responses per item
ranged from 684 to 2,535. For kindergarten, the responses per item ranged from 573 to 1,888.
For 1st grade, the responses per item ranged from 737 to 2,717.
Regarding the content of the items, multiple sub-contents are measured for each grade.
The prekindergarten item pool measured the following:
Counting Skills, Spatial Relations,
Number Sense, Measurement,
Number and Operations, Measurement Skills,
Counting and Cardinality, Data Analysis,
Adding To/Taking Away Skills, Mathematical Reasoning,
Geometry, Data Collection and Statistics,
2-4 ISIP Math and ISIP Early Math Technical Report (Rev. 2/18)
Algebra and Functions, Patterns and Seriation, and
Algebra, Patterns and Relationships.
The kindergarten item pool measured the following:
Counting and Cardinality, Measurement,
Probability and Statistics,
Number and Operations, Data Analysis,
Measurement and Data,
Number and Number Sense, Personal Financial Literacy, and
Algebra.
Operations and Algebraic Thinking,
Number and Operations in Base Ten,
Geometry,
Geometry and Measurement,
The 1st grade item pool measured the following: Number and Operations in Base Ten,
Number Sense, Algebraic Reasoning,
Operations and Algebraic Thinking, Geometry,
Algebra, Measurement and Data Analysis,
Measurement and Data, Measurement,
Patterns, Data analysis, and
Functions, Personal Financial Literacy.
Number and Operations,
Overall, most items were good quality in terms of item discriminations and item difficulties.
For prekindergarten, five items were removed and 392 calibrated item parameters remain in
the item pool. For kindergarten, 23 items were removed and 377 calibrated item parameters
remain in the item pool. For 1st grade, 35 items were removed and 360 calibrated item
parameters remain in the item pool.
CAT Algorithm
The Computerized Adaptive Testing (CAT) algorithm is an iterative approach to test taking.
Instead of giving a large, general pool of items to all test takers, a CAT test repeatedly
selects the optimal next item for the individual test taker, bracketing their ability estimate
until some stopping criteria is met.
The algorithm is as follows:
1. Assign an initial ability estimate to the test taker.
2. Ask the question that gives the most information based on the current ability
estimate.
ISIP Math and ISIP Early Math Technical Report (Rev. 2/18) 2-5
3. Re-estimate the ability level of the test taker based on their answer to the prior
question.
4. If stopping criteria is met, stop. Otherwise, return to step 2 and repeat.
This iterative approach is made possible by using IRT models. IRT models generally estimate a
single, latent trait (ability) of the test taker, and this trait is assumed to account for all
response behavior. These models provide response probabilities based on test taker ability
and item parameters. Using these item response probabilities, we can compute the amount of
information each item will yield for a given ability level. In this way, we can select the next
item in a way that maximizes information gain based on student ability rather than percent
correct or grade-level expectations.
Though the CAT algorithm is simple, it allows for endless variations on item selection criteria,
stopping criteria, and ability estimation methods. All of these elements play into the
predictive accuracy of a given implementation, and the best combination is dependent on the
specific characteristics of the test and the test takers.
In developing Istation’s CAT implementation, we explored many approaches. To assess the
various approaches, we ran CAT simulations using each approach on a large set of real student
responses to our items (1,000 students, 700 item responses each). To compute the “true”
ability of each student, we used Bayes expected a posteriori (EAP) estimation on all 700 item
responses for each student. We then compared the results of our CAT simulations against
these “true” scores and other criteria to determine which approach was most accurate.
Ability Estimation
From the beginning, we decided to take a Bayesian approach to ability estimation, with the
intent of incorporating prior knowledge about the student (from previous test sessions and
grade-based averages). In particular, we initially chose Bayes EAP with good results. We
briefly experimented with the maximum likelihood estimation (MLE) method as well but
abandoned it because the computation required more items to converge to a reliable ability
estimate.
To compute the prior integral required by EAP, we used Gauss-Hermite quadrature with 88
nodes from –7 to +7. This is certainly more than needed, but because we were able to save
runtime computation by pre-computing the quadrature points, we decided to err on the side
of accuracy.
For the Bayesian prior, we used a standard normal distribution centered on the student’s
ability score from the previous testing period (or the grade-level average for the first testing
period). We decided to use a standard normal prior rather than using σ from the previous
testing period in order to avoid overemphasizing possibly out-of-date information.
2-6 ISIP Math and ISIP Early Math Technical Report (Rev. 2/18)