Oil gas update 20200520 mbs en
Bạn đang xem bản rút gọn của tài liệu. Xem và tải ngay bản đầy đủ của tài liệu tại đây (643.5 KB, 10 trang )
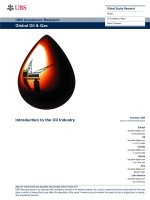
Oil & Gas Industry
“Weakening demand as the outbreak disrupts normal global economic activity”
Huynh The Chu
(+84) 335 699 989
Macro outlook Stock market outlook Key investment themes Stock picks
Oil and gas industry
Global Market:
WTI price plummeted to -37 USD/bbl on April 20, 2020, which is unprecedent in the history despite the effort from OPEC+, leading by Saudi
Arabia and Russia with G20 to stabilize the worldwide oil price amidst of market turmoil. Thus, oil price was free falling 25% as the Covid-19
pandemic is wide spreading.
Global demand directly takes a hit when the outbreak started from China early this year then spread like wildfire within 2-4 months. Rapid
escalation in Covid-19 spread has forced the economic powerhouses like the US, Europe and Japan to lock down. Demand in March declines
10% from same period 2019 and 12% from the end of 2019, equivalent of 10-12 barrels each month. In April and May, there’s likely to be a
deeper dip of over 25% or 25-26 barrels a month.
The effort OPEC+ to stabilize the market by cutting production on April 9th to 9.7 mbpd, effective in May-June, 2020 and revert to 5.7 mbpd
until the end of April 2022. Moreover, G20 also agreed to stabilize oil market and consider to further cut 15 mbpd.
Vietnam Market
The impact of Covid-19 and a decline in oil price early March, upstream activities are grappling, creating a domino effect to oilfield service
companies like PetroVietnam Drilling & Well Services Corporation (PVD) and PetroVietnam Technical Services Corporation (PVS). Both service
charge and the workload are under pressure due to limited exploration activities.
As for mid- and downstream, companies such as PetroVietnam Gas JSC (GAS), Viet Nam National Petroleum Group (PLX), Binh Son Refining
and Petrochemical Joint-Stock Company (BSR), and PetroVietnam Oil Corporation (PVOIL) are all suffering from a deep plunge of 30-40% of
oil price, especially aviation fuel drops 60-70%.
Macro outlook Stock market outlook Key investment themes Sector Outlook
Oil and gas industry Global supply- demand before OPEC+ production cut
agreement April 9th 2020
Global market
105.0 15.4 18.0
Global demand is experiencing the impact of the Covid-19 outbreak starting from China then spreading across 100.0 12.5 16.0
the world within the past 2-4 months. Rapid escalation in the spread has forced the economic powerhouses 14.0
like the US, Europe and Japan to lock down. Demand in March declines 10% from same period 2019 and 12% 95.0 9.6 12.0
from the end of 2019, equivalent of 10-12 barrels each month. In April and May, there’s likely to be a deeper 90.0 10.0
dip of over 25% or 25-26 barrels a month. 85.0 6.1 8.0
80.0 6.0
Weakening demand as the outbreak disrupts normal global economic activity 75.0 3.0 4.4 4.0
70.0 2.0
According to EIA’s April report, worldwide oil consumption in March was 89.4 mbpd, dropping 10.01 mbpd compared to the 0.8 0.9 2.2 -
same period in March 2019 and 12.7 mbpd in Dec.2019. The gap between Supply and Demand increase 9.6 mbpd. (2.0)
0.4 (4.0)
EIA suggests April and 2Q20 demand will continue to decline to respectively 83.5 mbpd and 88 mbpd. Whereas, supply
remains high (before new cut deal) at respectively 99.1 and 99.4 mbpd. Thus, supply surplus reaches its peak in April at 15.4 (0.6) (0.0) (0.3) (0.6)
mbpd and 11.4 mbpd for the 2nd quarter. (1.7) (1.6)(2.5)
Annual consumption is projected to reach 95.51 mbpd, dropping 5.2% or 5.24 mbpd from 2019. T1 T2 T3 T4 T5 T6 T7 T8 T9 T10 T11 T12
Meanwhile, International Energy Agency (IEA) warns of crashing demand in April, dropping 29 mbpd, to hit the lowest level 16 17 18 19 2020
since 1995. FY20, IEA estimates refinery intake to decline 9.3 mbpd to 91 mbpd.
Supply-Demand (RHS) Supply Demand
Crude demand in China is sharply declining since February 2020 to 11.3 mbpd and 11.2 mbpd in March, down 21.6% from
January and 22.4%-22.9% yoy. EIA forecast a recovery in April demand to 12.9 mbpd and 15.5 mbpd by the end of the year. Oil consumption by country
OECD’s crude intake dipped to 41.8 mbpd (-10.6% yoy) in March and could reach the bottom in April to 36.4 mbpd (-22.6
yoy) Since the beginning of 2020, March and April demand has erased 11.8% and 23.2%. OECD’s demand could recover in 60.0
May and reach 46.8 mbpd in Dec 2020.
50.0 42 47 47 48 47 46 46 42 45 46 46 47 47 47 45
40.0 36 38
30.0 20 20 21 21 20 20 19 16 17 19 20 20 20 20 20 20 20
20.0
10.0 13 14 14 15 14 11 11 13 13 14 14 14 15 14 15 15 15
-
T1 T2 T3 T4 T5 T6 T7 T8 T9 T10 T11 T12
16 17 18 19 2020 T1.2021
OECD USA China
Source: EIA, MBS research
Macro outlook Stock market outlook Key investment themes Sector Outlook
Oil and gas industry Global supply- demand after OPEC+ production cut
agreement April 9th 2020
Global market
110.0 15.4 20.0
The effort OPEC+ to stabilize the market by cutting production on April 9th to 9.7 mbpd, effective in 100.0 15.0
May-June, 2020 and revert to 5.7 mbpd until the end of April 2022. Moreover, G20 also agreed to 9.6 10.0
stabilize oil market and consider to further cut 15 mbpd. 90.0 5.0
80.0 0.8 0.9 3.0 4.4 2.8 -
According to EIA, supply in March 2020 reached 99.02 mbpd, dropping 1.05 mbpd from February and 1.24 mbpd 70.0 (5.0)
from March 2019. Average output in the 1st quarter slightly declined 0.19 mbpd yoy to 100.11mbpd. (0.6) (0.0) (10.0)
(15.0)
USA’s crude production remained at 12.72 mbpd in March, up 0.83 mbpd yoy. In 1Q20, monthly output reached (3.6)(5.5) (5.3)
12.73 mbpd. EIA forecasts that the USA will produce 12.39 mbpd in April and slightly drop to 12 mbpd each month (8.0)(9.4)(8.3)(9.3)(10.2)
for the rest of the year. Average monthly output is expected to be 11.75 mbpd, or 96.15% of 2019 average.
T1 T2 T3 T4 T5 T6 T7 T8 T9 T10 T11 T12
OPEC’s crude production reached 27.7 mbpd in March, slightly dropping 0.23 mbpd from February and 1.9 mbpd
yoy. EIA suggests that monthly average by the end of the year will continue to increase, averaging 28.65 mbpd or 16 17 18 19 2020
97.9% of 2019 average (estimated before new cut on April 9th).
Supply - Demand (After Agreement, RHS)
On April 9th, 2020, OPEC+ has reached a new cut deal that will take effect in May 2020. OPEC+ agrees to cut 9.7 Supply after OPEC+ Agreement April 9th
mbpd in May and June, 7.7 mbpd by the end of 2020 and 5.7 mbpd starting from 2021. On top of that, G20 has Demand
joined to stabilize the market and agreed to further cut 20 mbpd. Supply
Accordingly, May and June supply will reach roughly 90 mbpd whereas demand remains unchanged at 87-93.5 US Weekly Ending Stocks of Crude oil and Petroleum products
mbpd. Thus, there’s a surplus of 3.6 mbpd and will surge to 10.2 mbpd by the end of the year.
1,000
IEA projects oil production will sharply fall as a result of April 9th agreement and other countries will increase their
proven oil reserves. Along with recovery in oil demand once the Covid-19 outbreak is contained, within late half of 900 863
2020, demand is expected to surpass supply.
800
mil barrel
May-16
Jul-16
Sep-16
Nov-16
Jan-17
Mar-17
May-17
Jul-17
Sep-17
Nov-17
Jan-18
Mar-18
May-18
Jul-18
Sep-18
Nov-18
Jan-19
Mar-19
May-19
Jul-19
Sep-19
Nov-19
Jan-20
Mar-20
700
600 638
500 532
400
300
US Ending Stocks of SPR Crude Oil
US Ending Stocks of Crude Oil excluding SPR
US Ending stock Petroleum products
Source: EIA, OPEC+, MBS research
Macro outlook Stock market outlook Key investment themes Sector Outlook
Oil and gas industry Oil Price Movement
Global market WTI Brent
Oil price movement in first 4 months of 2020 100 4/2/2016 4/2/2017 4/2/2018 4/2/2019 4/2/2020
80
WTI price plummeted to -37 USD/bbl on April 20, 2020, which is unprecedent in the history despite 60 Oil Price Forecast
the effort from OPEC+, leading by Saudi Arabia and Russia with G20 to stabilize the worldwide oil 40
price amidst of market turmoil. Thus, oil price was free falling 25% as the Covid-19 pandemic is wide 20 WTI Oil price Brent Oil price
spreading. 0
-240/2/2015 Past data Forecast
Price has plummeted since early March after the OPEC+ panel on March 6th came into no agreement -40
to further cut 1.5 mbpd. Oil was trading at 18-year lowest price on March 31st. -60USD/bbl
Jul
On April 9th, OPEC+ agreed to cut 9.7 mbpd in May and June 2020, 7.7 mbpd in July until the end of 80 Aug
2020 and 5.7 mbpd in 2021. Furthermore, G20 joined a hand to stabilize the market by further 70 Sep
cutting 15 mbpd. 60 Oct
50 Nov
Despite that, while the cut deal hasn’t taken effect, supply will remain at 98-99 mbpd whereas global 40 Dec
demand dips 15% in March and is projected to drop 25$ in April and May, which widens the gap 30 Jan
between supply and demand and shortage of storage for oil. Investors are dumping WTI May 20 Feb
futures contracts expiring on April 21st, thus further plummeting oil price to -37 USD/bbl. 10 Mar
Apr
Analysts suggest that oil price plunge is inevitable despite OPEC+’s new cut deal “The agreement is 0 May
simply not enough as oil demand destruction could reach 30 mbpd, 3x OPEC+ cut”. Jun
Jul
EIA estimates WTI and Brent to drop respectively to 20 USD/bbl and 22.5 USD/bbl in April then Aug
recover in December to 31 USD/bbl and 33 USD/bbl. Though, these are estimates before April 9th Sep
agreement. Oct
Nov
Dec
Jan
Feb
Mar
Apr
May
Jun
Jul
Aug
Sep
Oct
Nov
Dec
2019 2020 2021
Source: Bloomberg, EIA, TTNC MBS
Macro outlook Stock market outlook Key investment themes
Sector Outlook
Oil and gas industry Vietnam Oil & Gas Production and Reserve Expand
Vietnam market Mil Tons
Oil price sharply dropped to 30 USD/bbl in March 2020, putting pressure to oil companies, especially the 60.0 2.0
upstream sector that involves exploration and drilling.
50.0 1.8
According to PVN, for each $1 drop in oil price, its retail revenue drops $225,000/ barrel. At the price of
30-25 USD/bbl, PVN records a loss of VND 3 billion in FY20 revenue. In case of oil price free falling, 1.6
revenue and profit will continue to plunge.
40.0 1.4
Upstream activities are grappling, creating a domino effect to oilfield service companies like
PetroVietnam Drilling & Well Services Corporation (PVD) and PetroVietnam Technical Services 1.2
Corporation (PVS). Both service charge and the workload are under pressure due to limited exploration
activities. 30.0 1.0
Exploration, Drilling and Manufacturing. 20.0 0.8
• Exploration activities in the past few years have been limited as oil price is dropping since 2015 with no sign of 0.6
recovery. The dip in oil price this year even exacerbates the problem due to limited capital resources, dwindling
proven oil reserves, thus companies resort to expand to areas with low potential. Escalated tension in the East Sea 10.0 0.4
is another hurdle. According to PVN, investment for exploration in 2014 was 2.5-3 billion a year but since then, it
has dropped to USD 500 million within 2015-2019. Investment for exploration activities is under constraint. Output 0.2
is dwindling as large oil reserves such as Bach Ho field and Cuu Long basin are running out whereas smaller
reserves require substantial investment. - -
• Several investors have shown sign of reluctance and prolong progress of few projects in 2020 such as Jardin 2010 2011 2012 2013 2014 2015 2016 2017 2018 2019
decided to suspend Nam Du- U Minh project. At the same time, other foreign-owned projects like Blue Whale of
Exxon Mobil are cut down and capital flows are extended. Reserve Expanded Crude Oil Production
Natural Gas Production Reserve/Production (RHS)
Annual investment for oil exploration (bn USD)
3
2.5
2
1.5
2.5
1
0.5 0.5
2016-2019
0
2010-2015
Macro outlook Stock market outlook Key investment themes Source: MOIT, MBS Research
Sector Outlook
Oil and gas industry 12 Vietnam's Natural Gas Production
10
Vietnam market 200
8 150
Dip in oil price takes a toll on domestic LNG projects but it also 6 100
pushes the importation of LNG in response to rising electricity- 4 50
generating demand 2 0
0 Billion m3
Focus on LNG extraction to ensure electricity production and 1994
increase output in 2022. Project 1995
LNG Hai Linh 1996
LNG Nam Con Son Phrase 2: completion of pipe systems from Sao LNG Thi Vai 1997
Vang- Dai Nguyet gas field (2021) and Su Tu Trang field (2022) LNG Son My 1998
LNG Bac Lieu 1999
Thi Vai TNG terminal with phrase 1 capacity of 1 mn ton/ year, LNG Cai Mep Ha 2000
completed by 2022 to provide for Nhon Trach power plant 3&4. 2001
2002
In the long term, PVN will allocate resource to LNG extraction projects 2003
in Ma Lay- Tho Chu, including Lot B O Mon, Nam Du- U Minh where 2004
has a large reserve for long-term development plan. 2005
2006
2007
2008
2009
2010
2011
2012
2013
2014
2015
2016
2017
2018
2019
2020KH
2020F
Annual Production (LHS) Cumulative Production (RHS)
Investor Capacity Status
Hai Linh Ltd.,
PVN-PVGAS 220 nghìn tấn/năm Pending
PVN-PVGAS GĐ1 triêu tấn/năm- Hoàn thành 3-6tr Capital raising
Delta Offshore Energy Pte tấn/năm
Pending
Tập đoàn T&T và GEN X Energy 150-174 million m3 Approved
9 mn ton/ year Reviewing
LNG Van Phong Petrolimex Reviewing
LNG Long Son EVN-GENCO3 Phrase 1: 3.5 mn ton- Phrase 2: 6.5 Reviewing
LNG Ca Na Gulf Energy Development mn ton/year Reviewing
6 mn ton/year
LNG Vung Ang Siemens Ensure LNG for a 1.500 MW- Reviewing
electricity plant
Stock market outlook
Source: MOIT, MBS Research
Macro outlook Key investment themes Sector Outlook
Oil and gas industry Gasoline Production- Consumption and Import-Export
Vietnam market Thousand tons 20,000
18,000
Refinery and distribution: 16,000
14,000
Due to the Covid-19 pandemic and decline in oil price, oil refinery and 12,000
distribution are both affected. Demand is weakening as production and mobility 10,000
are restricted.
8,000
We view downstream companies such as GAS, PLX, BSR, and PVOIL are under 6,000
pressure of the Covid-19 and the free fall of oil price. The outbreak within the 4,000
last 2 months has driven price down 30-40%, especially aviation fuel 2,000
experienced 60-70% decline and may continue to prolong.
-
Processing activities
2010 2011 2012 2013 2014 2015 2016 2017 2018 2019
Decline in oil price and weakening demand due social distancing to cope with the Covid-19 have
slowed down refinery activities. Deteriorating consumption, low inventory turnover, and wide spread Production Import Consumption
between sale price and material price render refinery companies to take on large losses in 1Q20.
Distribution
Distribution channels are disrupted. Petrolimex and PVOIL, 2 largest distributor, that make up for
70% of market share, are struggling and reporting enormous loss.
Macro outlook Stock market outlook Key investment themes Source: MOIT, MBS research
Sector Outlook
Oil and gas industry
Vietnam market – Financial result
PVN’s financial results
Item Unit 2017 2018 Plan 2019 Result Plan 2020 % annual Plan
10-15 Q1 result
Addition to oil reserve Mn ton 4.00 12.00 10.62
Oil output Mn ton 15.50 14.00 10-15 13.38 9.74 NA NA
Gas output Mn ton 10.00 11.82
Oil refinery output Mn ton 9.90 11.80 12.40 13.11 21.60 2.83 26.6%
Electricity output Bn kwh 6.80 21.00 1.56
Fertilize output Mn ton 20.58 9.70 10.21 641.0 2.32 23.8%
Revenue Trillion VND 1.65 1.63 11.35 11.49 32.3
Pre-tax profit Trillion VND 267.2 320.9 21.60 22.60 27.5 3.42 28.9%
Net income Trillion VND 46.9 82.1
Attributable to budget Trillion VND 37.2 50.6 5.33 24.7%
97.5 38.6
121.3 1.58 1.58 0.44 28.2%
383.2 396.9 165.0 25.7%
31.3 43.8 NA NA
24.7 35.2 NA NA
87.5 108.0 20.8 25.3%
*: - 2020 Plan was created based on Crude Brent of USD 60 per barrel Source: PVN, MBS Research
- FY17-19 revenue was in consolidated financial statement
Sector Outlook
Macro outlook Stock market outlook Key investment themes
Oil and gas industry
Vietnam market – Financial result
Oil companies’ financial result
Financial result until 1Q20 2019 result 2020 target 1Q20 result 2020 Forecast Impact of drop in oil
price
Ticker Unit
Mark cap Pre-tax Pre-tax Pre-tax Pre-tax Short term Mid-long
7.5.2020 Revenue profit profit profit profit
Total asset Debt Revenue Revenue Revenue 3-6M term >9M
GAS Bn VND 65,453 13,490 131,488 75,310 15,068 66,164 8,294 17,094 2,968 61,644 11,617 Neutral Positive
PLX Bn VND 55,079 33,119 49,233 189,656 5,648 n/a n/a 38,478 -1702 152,600 3,600 Negative Positive
BSR Bn VND 47,629 15,923 18,603 102,824 3,054 80,686 1,364 17,991 -2,345 63,797 No loss Negative Neutral
PVS Bn VND 25,428 12,467 5,736 17,233 948 15,000 800 3,241 177 16,561 1,032 Neutral Positive
PVD Bn VND 21,338 7,154 4,030 4,368 189 4,680 100 1,675 26 6,026 325 Positive Negative
PVT Bn VND 11,214 5,379 2,843 7,758 1,016 6,200 550 1,578 120 6,850 700 Negative Neutral
DPM Bn VND 11,438 3,171 5,440 7,757 467 9,237 512 1,711 129 8,600 650 Positive Neutral
DCM Bn VND 10,194 4,010 4,240 7,177 463 5,940 55 1,393 100 6,200 260 Positive Neutral
OIL Bn VND 21,552 11,223 8,381 79,872 412 n/a n/a 17,684 -531 68,000 No loss Negative Neutral
PVB Bn VND 856 411 324 383 52 621 58 377 60 600 60 Positive Negative
Source: companies’ financial statements, MBS Research
Macro outlook Stock market outlook Key investment themes Sector Outlook