Electricity Infrastructures in the Global Marketplace_2 docx
Bạn đang xem bản rút gọn của tài liệu. Xem và tải ngay bản đầy đủ của tài liệu tại đây (27.71 MB, 420 trang )
Status of Power Markets and Power Exchanges in Asia and Australia 383
tween the large power generation plants and the areas where the consumers are located.
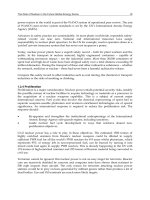
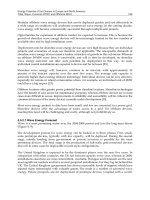
Figure 9.21 represent the load curve for day and the load curve for month in South Korea.
Table 9.17 shows the current status of KEPCO’s transmission grid facilities at the end of
2001. Table 9.18 represents a mid-to-long term forecast in demand and supply. Table 9.19
shows a power capacity of 6 generating companies in South Korea, 2002. (The bellow data
had obtained from KEPCO in Korea) Figure 9.22 represents a load demand and a generating
facility capacity for districts.
9.8.1.2 Power system and seasonal load patterns in North Korea
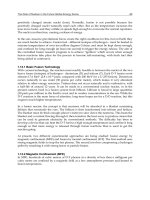
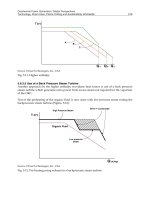
Figure 9.23 represents the load curve for day and the load curve for month with the assumed materi-
al in North Korea. As shown in bellow Figure, the pattern of a curve has a flat and small variation.
(a) Daily load curve
(b) Monthly load curve
Figure 9.21 South Korea load curves for day and for month.
0:00
2:00
4:00
6:00
8:00
10:00
12:00
14:00
16:00
18:00
20:00
22:00
24:00:00
45.000
40.000
35.000
30.000
25.000
20.000
15.000
10.000
5.000
0
45.000
40.000
35.000
30.000
25.000
20.000
15.000
10.000
5.000
1 2 3 4 5 6 7 8 9 10 11 12
(At the end of 2001)
Transmission Facilities Substation Facilities
Circuit length (C-km)
Support
(ea)
Number of
substation
(ea)
Transformer
capacity
(MVA)
Ovehead Underground Total
765 kV 662 - 662 666 1 1,110
345 kV 7,234 111 7,345 9,914 65 63,577
180 kV(HVDC) 30 202 232 553 - -
154 kV 16,111 1,465 17,576 24,581 449 78,119
66 kV 1,531 9 1,540 7,112 25 1,225
22 kV - - - - 9 248
Total 24,037 1,778 25,815 42,826 540 144,279
Table 9.17 Current status of KEPCO’s transmission grid facilities
Year
Peak Demand
[MW]
Installed Capacity [MW, as of year end] (%)
Capacity
Margin [%]
Nuclear Coal LNG Oil Hydro Total
2001
(Record)
43,130
13,720
(27.0)
15,530
(30.5)
12,870
(25.3)
4,870
(9.6)
3,880
(7.6)
50,860
(100)
15.1
2005 51,860
17,720
(28.6)
18,170
(29.3)
16,810
(27.2)
4,670
(7.6)
4,490
(7.3)
61,850
(100)
16.8
2010 60,620
23,120
(29.2)
24,270
(30.7)
20,440
(25.9)
4,820
(6.1)
6,390
(8.1)
79,020
(100)
25.1
Table 9.18 Mid-to-long term forecast in demand and supply
Company
Base
(MW)
Middle
(MW)
Peak
(MW)
Total
(MW)
KOSEPCO 3,565 500 1,500 5,565
KOMIPO 3,400 0 3,337 6,737
KOWEPO 3,066 1,400 2,880 7,346
KOSPO 3,000 400 2,200 5,600
KEWESPO 2,900 1,800 2,800 7,500
KHNP 15,715 0 528 16,243
OTHERS 0 58 4,186 4,244
TOTAL 31,646 4,158 17,431 53,235
% 59.5 7.8 32.7 100
Table 9.19 Power capacity for generation companies in South Korea, 2002
Electricity Infrastructures in the Global Marketplace384
Figure 9.22 Demand and facility capacity by regions
At present, the data about transmission system of North Korea are insufficient and are not
arranged well. There are only a little data from Russia, UN, CIA, the Korean Board of Unifi-
cation, etc. Accordingly, the previous researches of interconnection in the Korean Peninsula
have just focused on the analyses of the present data and scenarios. This study assumes that
the power system in North Korea is divided into 5 areas. The power system in North Korea
is smaller than that in South Korea. Most of the hydroelectric power plants are located in the
hilly region of the northern areas in North Korea and most of the thermoelectric power
plants are located in the metropolitan area. Moreover, power capacity in North Korea has
been estimated to be approximately 7,000MW. Currently, it is known that transmission line voltage is
composed of 110kV and 220kV.
* The information in this Figure was obtained from KEPCO.
(a) Daily load curve
(b) Monthly load curve
Figure 9.23 North Korea load curves for day and month (Assumed Material)
9.8.1.3 Power system and seasonal load patterns in Far East Russia
The above data had been obtained from SEI in Russia. Table 9.20 represents a present seasonal data
of power in Russia (2001). Table 9.21 is a present seasonal data of power in East Siberia (2001). Table
9.22 shows a present seasonal data of power in Russian Far East (2001).
0:00
2:00
4:00
6:00
8:00
10:00
12:00
14:00
16:00
18:00
20:00
22:00
12000
10000
8000
6000
4000
2000
1 2 3 4 5 6 7 8 9 10 11 12
12000
10000
8000
6000
4000
2000
Status of Power Markets and Power Exchanges in Asia and Australia 385
Figure 9.22 Demand and facility capacity by regions
At present, the data about transmission system of North Korea are insufficient and are not
arranged well. There are only a little data from Russia, UN, CIA, the Korean Board of Unifi-
cation, etc. Accordingly, the previous researches of interconnection in the Korean Peninsula
have just focused on the analyses of the present data and scenarios. This study assumes that
the power system in North Korea is divided into 5 areas. The power system in North Korea
is smaller than that in South Korea. Most of the hydroelectric power plants are located in the
hilly region of the northern areas in North Korea and most of the thermoelectric power
plants are located in the metropolitan area. Moreover, power capacity in North Korea has
been estimated to be approximately 7,000MW. Currently, it is known that transmission line voltage is
composed of 110kV and 220kV.
* The information in this Figure was obtained from KEPCO.
(a) Daily load curve
(b) Monthly load curve
Figure 9.23 North Korea load curves for day and month (Assumed Material)
9.8.1.3 Power system and seasonal load patterns in Far East Russia
The above data had been obtained from SEI in Russia. Table 9.20 represents a present seasonal data
of power in Russia (2001). Table 9.21 is a present seasonal data of power in East Siberia (2001). Table
9.22 shows a present seasonal data of power in Russian Far East (2001).
0:00
2:00
4:00
6:00
8:00
10:00
12:00
14:00
16:00
18:00
20:00
22:00
12000
10000
8000
6000
4000
2000
1 2 3 4 5 6 7 8 9 10 11 12
12000
10000
8000
6000
4000
2000
Electricity Infrastructures in the Global Marketplace386
Type
Present seasonal data
Year
Spring
Summer
Autumn
Winter
Hydro
Hydro
45.3 48.0 41.7 40.9 175.9
Pumped-storage power
Nuclear 33.3 27.7 36.8 39.1 136.9
Thermal 140.9 105.2 146.5 185.9
578.5
Including
Conventional steam
turbine
56.9 46.2 64.4 80.7 248.3
Co-generation
83.4 58.6 81.6 104.5
328.0
Renewable energy - - - - -
Total 219.5 180.9 225.0 265.9
891.3
Table 9.20 Present seasonal data of power in Russia (2001, TWh)
Type
Present seasonal Data
Year
Spring Summer Autumn
Winter
Hydro
Hydro
22.0 26.4 24.2 22.3 94.9
Pumped-storage power
Nuclear - - - - -
Thermal 9.9 3.9 8.7 14.3 36.8
Including Conventional steam turbine
5.1 1.0 4.1 8.4 18.6
Co-generation
4.8 2.9 4.6 5.9 18.2
Renewable energy - - - - -
Total 31.9 30.3 32.9 36.6 131.7
Table 9.21 Present seasonal data of power in East Siberia (2001, TWh)
Unified Power System (UPS) of Russian East provides with the electric power the most in-
habited and industrially developed regions of the Russian Far East. UPS of Russian East
consist of seven large regional electric power systems: Amur, Far East, Kamchatka, Maga-
dan, Sakhalin, Khabarovsk and Yakutsk. Now the Amur, Khabarovsk and Far East electric
power systems are united on parallel operation, in parallel with them the southern part of
the Yakut electric power system is working also. The maximum of electric loading in UPS
falls at winter and makes about 5.8 GW (based on the data for 2001). The minimum of elec-
tric loadings makes approximately half from a maximum and falls at the summer period.
The maximum of in UPS was in 1990 and made approximately 30 billion kWh. In 2000 value
of electrical energy consumption has made approximately 24 billion kWh, in 2001 this value
has made 25.5 billion kWh. It was planned, that by 2005 consumption will make about 28.7
billion kWh by 2010 - 32 billion kWh, and by 2025 will make about 50 billion kWh.
Type
Present seasonal Data
Year
Spring Summer
Autumn
Winter
Hydro
Hydro
1.13 0.98 0.97 1.77 4.85
Pumped-storage power
Nuclear - - - - -
Thermal 5.29 3.57 5.04 6.75 20.65
Including Conventional steam turbine 1.54 1.27 1.52 1.72 6.05
Co-generation 3.75 2.30 3.52 5.03 14.60
Renewable energy - - - - -
Total 6.42 4.55 6.01 8.52 25.50
Table 9.22 Present seasonal data of power in Russian Far East (2001, TWh)
The current consumption is distributed non-uniformly. More than 40 % of the electric power is
consumed in the Far East electric power system. The rest of 60% are distributed between the
Khabarovsk, Amur and Yakut electric power systems. Backbone electrical network of the UPS
consist of 220 and 500 kV transmission lines. General extent of 500 kV lines makes about 2000 km
The total installed capacity of power stations (nuclear, thermal and hydro) make about 11 GW
59
.
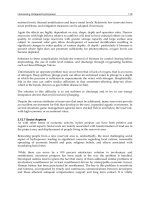
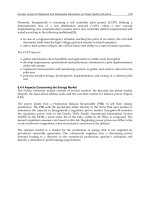
Figure 9.24 represents the HVDC interconnection lines in Siberia and Far East Russia
50
.
9.8.1.4 Power system status in North East China
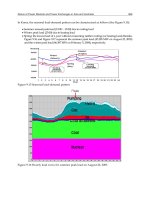
Figure 9.25 represents the seven regions and power consumption map in China. This Figure was
obtained from EPRI in China.
Figure 9.24 HVDC Interconnection Lines in Siberia and Far East Russia
This map shows an overview of the different regional grid systems within China, showing
year 2002 generating capacities and outputs in each region, as well as indicating intercon-
nections between regional grids. In China, Liaoning’s power network covering the 147,500
square kilometers of land is a modern power network with long history and full of vigor.
S
iberia
7 GW 7 G
W
2 GW
Bratsk
7 G
W
Uchur
2 GW
5 GW
9 GW
8 GW
11 GW
3 GW
11 GW
Russian Far
East
Khabarovsk
3 GW
To China,
South Korea
and Japan
5 GW
Tu
g
ur
8 GW
To
Korea
Status of Power Markets and Power Exchanges in Asia and Australia 387
Type
Present seasonal data
Year
Spring
Summer
Autumn
Winter
Hydro
Hydro
45.3 48.0 41.7 40.9 175.9
Pumped-storage power
Nuclear 33.3 27.7 36.8 39.1 136.9
Thermal 140.9 105.2 146.5 185.9
578.5
Including
Conventional steam
turbine
56.9 46.2 64.4 80.7 248.3
Co-generation
83.4 58.6 81.6 104.5
328.0
Renewable energy - - - - -
Total 219.5 180.9 225.0 265.9
891.3
Table 9.20 Present seasonal data of power in Russia (2001, TWh)
Type
Present seasonal Data
Year
Spring Summer Autumn
Winter
Hydro
Hydro
22.0 26.4 24.2 22.3 94.9
Pumped-storage power
Nuclear - - - - -
Thermal 9.9 3.9 8.7 14.3 36.8
Including Conventional steam turbine
5.1 1.0 4.1 8.4 18.6
Co-generation
4.8 2.9 4.6 5.9 18.2
Renewable energy - - - - -
Total 31.9 30.3 32.9 36.6 131.7
Table 9.21 Present seasonal data of power in East Siberia (2001, TWh)
Unified Power System (UPS) of Russian East provides with the electric power the most in-
habited and industrially developed regions of the Russian Far East. UPS of Russian East
consist of seven large regional electric power systems: Amur, Far East, Kamchatka, Maga-
dan, Sakhalin, Khabarovsk and Yakutsk. Now the Amur, Khabarovsk and Far East electric
power systems are united on parallel operation, in parallel with them the southern part of
the Yakut electric power system is working also. The maximum of electric loading in UPS
falls at winter and makes about 5.8 GW (based on the data for 2001). The minimum of elec-
tric loadings makes approximately half from a maximum and falls at the summer period.
The maximum of in UPS was in 1990 and made approximately 30 billion kWh. In 2000 value
of electrical energy consumption has made approximately 24 billion kWh, in 2001 this value
has made 25.5 billion kWh. It was planned, that by 2005 consumption will make about 28.7
billion kWh by 2010 - 32 billion kWh, and by 2025 will make about 50 billion kWh.
Type
Present seasonal Data
Year
Spring Summer
Autumn
Winter
Hydro
Hydro
1.13 0.98 0.97 1.77 4.85
Pumped-storage power
Nuclear - - - - -
Thermal 5.29 3.57 5.04 6.75 20.65
Including Conventional steam turbine 1.54 1.27 1.52 1.72 6.05
Co-generation 3.75 2.30 3.52 5.03 14.60
Renewable energy - - - - -
Total 6.42 4.55 6.01 8.52 25.50
Table 9.22 Present seasonal data of power in Russian Far East (2001, TWh)
The current consumption is distributed non-uniformly. More than 40 % of the electric power is
consumed in the Far East electric power system. The rest of 60% are distributed between the
Khabarovsk, Amur and Yakut electric power systems. Backbone electrical network of the UPS
consist of 220 and 500 kV transmission lines. General extent of 500 kV lines makes about 2000 km
The total installed capacity of power stations (nuclear, thermal and hydro) make about 11 GW
59
.
Figure 9.24 represents the HVDC interconnection lines in Siberia and Far East Russia
50
.
9.8.1.4 Power system status in North East China
Figure 9.25 represents the seven regions and power consumption map in China. This Figure was
obtained from EPRI in China.
Figure 9.24 HVDC Interconnection Lines in Siberia and Far East Russia
This map shows an overview of the different regional grid systems within China, showing
year 2002 generating capacities and outputs in each region, as well as indicating intercon-
nections between regional grids. In China, Liaoning’s power network covering the 147,500
square kilometers of land is a modern power network with long history and full of vigor.
S
iberia
7 GW 7 G
W
2 GW
Bratsk
7 G
W
Uchur
2 GW
5 GW
9 GW
8 GW
11 GW
3 GW
11 GW
Russian Far
East
Khabarovsk
3 GW
To China,
South Korea
and Japan
5 GW
Tu
g
ur
8 GW
To
Korea
Electricity Infrastructures in the Global Marketplace388
Liaoning province is the power load center in Northeast China. It has one 500kV line and six
220kV lines to connect with the power network in Jilin province. It also has two 500kV lines
and one 220kV line to connect with eastern part of an Inner Mongolia. By the end of 2000,
the total installed capacity in Liaoning province was 15,185MW (hydro power: 1,156MW;
thermal power: 12,559MW). The total installed capacity of the wholly-owned and holding
power generation plants of Liaoning Electric Power Co., Ltd. is 2,854MW (hydro power:
456MW; thermal power: 2,398MW) and takes up 18.8% of the total installed capacity of the
whole province. The independent power generation company has a total installed capacity
of 10,861MW (hydro power: 488MW; thermal power: 10,373MW) and takes up 71.5%. The
local self-supply power plants have a total installed capacity of 3,006MW, taking up 19.8%.
The installed capacity of the plant at Sino-Korean boundary river is 545MW, taking up 3.6%.
Figure 9.25 Regional power consumption map in China
9.8.1.5 Power System Status and Seasonal Load Patterns of Kyushu in Japan
Japan’s power system is divided into 9 regional companies serving the areas of Hokkaido,
Tohoku, Tokyo, Chubu, Hokuriku, Kansai, Shikoku, Chugoku, and Kyushu, and transmis-
sion consists of 500kV, 220kV, 110kV, and DC 250kV lines. Figure 9.26 shows a cascade
power flow map in Japan. The information in this Figure was obtained from
65
.
Figure 9.26 Cascade power flow map in Japan
The frequency used is 60Hz in the western part and 50Hz in the eastern part of the country.
According to statistics published in 2001, the total generating capacity of the nine power
companies is 33,765MW due to hydropower, 118,112MW due to thermal power, and
42,300MW due to nuclear power. The total capacity is therefore 194,177MW.
Kyushu’s infrastructure is composed of nuclear, thermal, hydro, and geothermal power ge-
nerating plants. In Kyushu region of Japan, 2001, summer peak has 16,743[MW], and winter
peak has 12,961[MW]. The nuclear power plants are located both in the southwest coastal
region and at the furthermost tip of Kyushu’s northwest coast. The thermal power plants are
located mainly on Kyushu’s northeast and the northwest coasts. The hydro power plants are
randomly distributed within the north and south central regions. The geothermal power
plants are located in the north and south central regions. Among these regions, Kyushu has
a total land area of 42,163 km
2
and is located in the southernmost part of Japan. The generat-
ing capacity of Kyushu’s Electric Power Company is approximately 30,200MW. The back-
bone of its transmission system consists of 500kV, 220kV, and some 110kV lines.
9.8.2 Assumed Possible Interconnection Scenarios in North East Asia
Several cases of maps are drawn according to the assumed scenario in Figure 9.27, which
has possible scenarios among Russia, China, North Korea, South Korea and Japan.
Status of Power Markets and Power Exchanges in Asia and Australia 389
Liaoning province is the power load center in Northeast China. It has one 500kV line and six
220kV lines to connect with the power network in Jilin province. It also has two 500kV lines
and one 220kV line to connect with eastern part of an Inner Mongolia. By the end of 2000,
the total installed capacity in Liaoning province was 15,185MW (hydro power: 1,156MW;
thermal power: 12,559MW). The total installed capacity of the wholly-owned and holding
power generation plants of Liaoning Electric Power Co., Ltd. is 2,854MW (hydro power:
456MW; thermal power: 2,398MW) and takes up 18.8% of the total installed capacity of the
whole province. The independent power generation company has a total installed capacity
of 10,861MW (hydro power: 488MW; thermal power: 10,373MW) and takes up 71.5%. The
local self-supply power plants have a total installed capacity of 3,006MW, taking up 19.8%.
The installed capacity of the plant at Sino-Korean boundary river is 545MW, taking up 3.6%.
Figure 9.25 Regional power consumption map in China
9.8.1.5 Power System Status and Seasonal Load Patterns of Kyushu in Japan
Japan’s power system is divided into 9 regional companies serving the areas of Hokkaido,
Tohoku, Tokyo, Chubu, Hokuriku, Kansai, Shikoku, Chugoku, and Kyushu, and transmis-
sion consists of 500kV, 220kV, 110kV, and DC 250kV lines. Figure 9.26 shows a cascade
power flow map in Japan. The information in this Figure was obtained from
65
.
Figure 9.26 Cascade power flow map in Japan
The frequency used is 60Hz in the western part and 50Hz in the eastern part of the country.
According to statistics published in 2001, the total generating capacity of the nine power
companies is 33,765MW due to hydropower, 118,112MW due to thermal power, and
42,300MW due to nuclear power. The total capacity is therefore 194,177MW.
Kyushu’s infrastructure is composed of nuclear, thermal, hydro, and geothermal power ge-
nerating plants. In Kyushu region of Japan, 2001, summer peak has 16,743[MW], and winter
peak has 12,961[MW]. The nuclear power plants are located both in the southwest coastal
region and at the furthermost tip of Kyushu’s northwest coast. The thermal power plants are
located mainly on Kyushu’s northeast and the northwest coasts. The hydro power plants are
randomly distributed within the north and south central regions. The geothermal power
plants are located in the north and south central regions. Among these regions, Kyushu has
a total land area of 42,163 km
2
and is located in the southernmost part of Japan. The generat-
ing capacity of Kyushu’s Electric Power Company is approximately 30,200MW. The back-
bone of its transmission system consists of 500kV, 220kV, and some 110kV lines.
9.8.2 Assumed Possible Interconnection Scenarios in North East Asia
Several cases of maps are drawn according to the assumed scenario in Figure 9.27, which
has possible scenarios among Russia, China, North Korea, South Korea and Japan.
Electricity Infrastructures in the Global Marketplace390
(a) Separation for North Korea and South. (b) North Korea-South Korea
(c) North Korea-South Korea-Japan. (d) Russia-North Korea-South Korea-Japan
(e) Russia-Mongo-China-South Korea-Japan. (f) China-North Korea-South Korea-Japan
(g) Russia-Mongo-China-South Korea-Japan. (h) Russia-Mongo-China-South Korea-Japan
Figure 9.27 Possible scenarios among Russia, China, North Korea, South Korea and Japan
9.8.3 Assumed Seasonal Power exchange Quantity for Power Flow Calculation
Table 9.23 represents the assumed peak load data for summer and winter in South Korea,
2005. To simulation the PSS/E package, the load was decreased with 2,000MW in summer
season and decreased with 1,000MW in winter season. Table 9.24 has the assumed peak data
for summer and winter in North Korea, 2005. All the load and supply patterns were as-
sumed with constant quantity. Table 9.25 is the assumed peak data for summer and winter
at Kyushu in Japan, 2001. Table 9.26 has the assumed export power for summer and winter
in Far East Russia. Table 9.27 represents the assumed export power for summer and winter
in North East China.
Thus, the purpose of this Section was to execute a power flow analysis considering seasonal
load patterns for the increase or for the decrease of a reserve power for the future power
shortages faced by the metropolitan areas or by the southeastern area of the South Korea in
North-East Asia. Several cases were considered as follows:
● Securing South Korea’s power reserve by a power interchange considering seasonal effects
in North East Asia countries.
● Drawing possible scenarios and power flow maps for relieving the power shortages faced
by the metropolitan areas and southeastern area in Korean Peninsula.
● Considering seasonal load patterns and studying power flow for the interconnection with
2,000MW in Far-East Russia or in Northeast China, and 1,000MW in Japan to utilizing re-
mote power sources.
The preliminary considerations above consist only of a scenario-based power flow analysis
included with seasonal load patterns; however, the results of this research may be referred
to the government for use in the establishment of a future construction plan for the power
system in South Korea. Moreover, these may be expecting to improve political and economi-
cal relationships in North East Asia countries.
Seasons Generation [MW] Load [MW] Receive Power [MW]
Summer peak 51857.8 51,090.4 2,000+1,000
Winter peak 41,857.8 41,090.4 1,000+500
Table 9.23 Assumed peak data for summer and winter in South Korea, 2005
Seasons Generation [MW] Load [MW] Transmission P [MW]
Summer peak 9,000 9,000 -
Winter peak 9,000 9,000 -
Table 9.24 Assumed peak data for summer and winter in North Korea, 2005
Seasons
Generation
[MW]
Load
[MW]
Transmission Power
(Japan → Korea)
Summer peak 17,743 16,743 1,000
Winter peak 13,461 12,961 500
Table 9.25 Assumed peak data for summer and winter at Kyushu in Japan, 2001
Status of Power Markets and Power Exchanges in Asia and Australia 391
(a) Separation for North Korea and South. (b) North Korea-South Korea
(c) North Korea-South Korea-Japan. (d) Russia-North Korea-South Korea-Japan
(e) Russia-Mongo-China-South Korea-Japan. (f) China-North Korea-South Korea-Japan
(g) Russia-Mongo-China-South Korea-Japan. (h) Russia-Mongo-China-South Korea-Japan
Figure 9.27 Possible scenarios among Russia, China, North Korea, South Korea and Japan
9.8.3 Assumed Seasonal Power exchange Quantity for Power Flow Calculation
Table 9.23 represents the assumed peak load data for summer and winter in South Korea,
2005. To simulation the PSS/E package, the load was decreased with 2,000MW in summer
season and decreased with 1,000MW in winter season. Table 9.24 has the assumed peak data
for summer and winter in North Korea, 2005. All the load and supply patterns were as-
sumed with constant quantity. Table 9.25 is the assumed peak data for summer and winter
at Kyushu in Japan, 2001. Table 9.26 has the assumed export power for summer and winter
in Far East Russia. Table 9.27 represents the assumed export power for summer and winter
in North East China.
Thus, the purpose of this Section was to execute a power flow analysis considering seasonal
load patterns for the increase or for the decrease of a reserve power for the future power
shortages faced by the metropolitan areas or by the southeastern area of the South Korea in
North-East Asia. Several cases were considered as follows:
● Securing South Korea’s power reserve by a power interchange considering seasonal effects
in North East Asia countries.
● Drawing possible scenarios and power flow maps for relieving the power shortages faced
by the metropolitan areas and southeastern area in Korean Peninsula.
● Considering seasonal load patterns and studying power flow for the interconnection with
2,000MW in Far-East Russia or in Northeast China, and 1,000MW in Japan to utilizing re-
mote power sources.
The preliminary considerations above consist only of a scenario-based power flow analysis
included with seasonal load patterns; however, the results of this research may be referred
to the government for use in the establishment of a future construction plan for the power
system in South Korea. Moreover, these may be expecting to improve political and economi-
cal relationships in North East Asia countries.
Seasons Generation [MW] Load [MW] Receive Power [MW]
Summer peak 51857.8 51,090.4 2,000+1,000
Winter peak 41,857.8 41,090.4 1,000+500
Table 9.23 Assumed peak data for summer and winter in South Korea, 2005
Seasons Generation [MW] Load [MW] Transmission P [MW]
Summer peak 9,000 9,000 -
Winter peak 9,000 9,000 -
Table 9.24 Assumed peak data for summer and winter in North Korea, 2005
Seasons
Generation
[MW]
Load
[MW]
Transmission Power
(Japan → Korea)
Summer peak 17,743 16,743 1,000
Winter peak 13,461 12,961 500
Table 9.25 Assumed peak data for summer and winter at Kyushu in Japan, 2001
Electricity Infrastructures in the Global Marketplace392
Seasons
Generation
[MW]
Load
[MW]
Transmission Power
(Russia → Korea)
Summer peak 2,000 0 2,000
Winter peak 1,000 0 1,000
Table 9.26 Assumed export power for summer and winter in Far East Russia
Seasons
Generation
[MW]
Load
[MW]
Transmission Power
(China → Korea)
Summer peak 2,000 0 2,000
Winter peak 1,000 0 1,000
Table 9.27 Assumed export power for summer and winter in North east China
9.9 Acknowledgements
This Chapter has been prepared by Nikolai I. Voropai, Professor, Corresponding Member of
RAS, Director of Energy Systems Institute, Irkutsk, Russia. Contributors include colleagues
at the Institute and Members of the IEEE PES W.G. on Asian and Australian Electricity
Infrastructure.
9.10 References
[1]. Open Access in Inter-State Transmission, Central Electricity Regulatory Commission, New
Delhi, India, Nov. 2003.
[2]. Electricity Act 2003, Ministry of Power, Government of India, New Delhi, India, June
2003.
[3]. Mukhopadhyay, S., “Interconnection of Power Grids in South Asia”, Proc. 2003 IEEE PES
General Meeting, Toronto, Ontario, Canada.
[4]. Mukhopadhyay, S., “Power Generation and Transmission Planning in India – Metho-
dology, Problems and Investments”, Proc. 2004 IEEE PES General Meeting, Denver,
Colorado, USA.
[5]. National Electricity Code Administrator website. www.neca.com.au
[6]. Ershevich, V.V., Antimenko, Yu.A., “Efficiency of the Unified Electric Power System
Operation on the Territory of the Former USSR”, Izv. RAN. Energetika, 1993, No. 1
(in Russian).
[7]. Voropai, N.I., Ershevich, V.V., Rudenko, Yu.N., Development of the International Intercon-
nections – the Way to Creation of the Global Power System, Irkutsk: SEI SB RAS, 1995,
Vol. 10 (in Russian).
[8]. Belyev, L.S., Voizekhovskaya, G.V., Saveliev, V.A., A System Approach to Power System
Development Management, Novosibirsk: Nauka, 1980 (in Russian).
[9]. Belyaev, L.S., Kononov, Yu.D., Makarov, A.A., “Methods and Models for Optimization
of Energy Systems Development”, Soviet Experience Review of Energy Models., Lax-
enburg: IIASA, 1976, No. 3.
[10]. Voropai, N.I., Trufanov, V.V., Selifanov, V.V., Sheveleva, G.I., “Modeling of Power
Systems Expansion and Estimation of System Efficiency of Their Integration in the
Liberalized Environment”, Proc. CIGRE 2004 Session, Rep. C1-103.
[11].
[12].
[13].
[14].
[15].
[16].
[17].
[18]. Schweppe, F. C., et al, Spot Pricing of Electricity, Kluwer Academic Publisher, 1988.
[19]. Chao, H. P., Huntington, H. G., Designing Competitive Electricity Markets, Kluwer Aca-
demic Publisher, 1998.
[20]. Ilic, M., Galiana, F., Fink, L., Power Systems Restructuring, Engineering and Economics,
Kluwer Academic Publisher, 1998.
[21]. Cameron, L., “Transmission Investment: Obstacles to a Market Approach”, The Electric-
ity Journal, 2001, Vol. 14, No. 2.
[22]. Kahn, E. P., “Numerical Techniques for Analyzing Market Power in Electricity”,The
Electricity Journal, 1998,Vol. 11, No. 6.
[23]. Oren, S.S., Ross, A.M., “Economic Congestion Relief Across Multiple Regions Requires
Tradable Physical Flow-Gate Rights”, IEEE Trans. on PWRS, 2002, Vol. 17, No. 1.
[24]. Wu, F. F., Ni, Y., Wei, P., “Power Transfer Allocation for Open Access Using Graph
Theory: Fundamentals and Applications in Systems without Loopflow”, IEEE
Trans. on PWRS, 2000,Vol. 15, No. 3.
[25]. State Power Information Network, http:// www.sp.com.cn
[26]. Electric Power Info Net of China,
[27]. Association of the Chinese Electric Power Enterprises, . org.cn
[28]. Electric Power News Net of China,
[29]. East China Power Market Steering Committee Office, “East China Power Market Pilot
Work Documents”, No. 18-19, 2004.
[30]. Gan, D., Bourcier, D. V., "Locational Market Power Screen and Congestion Manage-
ment: Experience and Suggestions", IEEE Transactions on Power Systems, 2002, Vol.
17, No. 1.
[31]. Mas-Colell, A., Whinston, M. D., Green, J. R., Microeconomic Theory, Oxford University
Press, Oxford, UK, 1995.
[32]. Federal Energy Regulation Council (FERC), “Working Paper on Standardized Trans-
mission Service and Wholesale Electricity Market Design”, March 16, 2002. http://
www.ferc.fed.gov
[33]. LECG, LLC, Kema Consulting, Inc, “Feasibility Study for a Combined Day-Ahead
Electricity Market in the Northeast”, 2nd Draft Report, Albany, April 26, 2001.
[34]. Hunt, S. , Shuttleworth, G., Competition and Choice in Electricity, New York, Wiley, 1997.
[35].
[36]. Hur, D., "Determination of Transmission Transfer Capability Using Distributed Con-
tingency-Constrained Optimal Power Flow and P-V Analysis," Ph.D. dissertation,
School of Elect. Eng., Seoul Nat. Univ., Korea, 2004.
[37]. Hur, D., Park, J. K, Kim, B. H., "Application of Distributed Optimal Power Flow to
Power System Security Assessment," Electr. Power Components Syst., 2003, Vol. 31,
No.1.
Status of Power Markets and Power Exchanges in Asia and Australia 393
Seasons
Generation
[MW]
Load
[MW]
Transmission Power
(Russia → Korea)
Summer peak 2,000 0 2,000
Winter peak 1,000 0 1,000
Table 9.26 Assumed export power for summer and winter in Far East Russia
Seasons
Generation
[MW]
Load
[MW]
Transmission Power
(China → Korea)
Summer peak 2,000 0 2,000
Winter peak 1,000 0 1,000
Table 9.27 Assumed export power for summer and winter in North east China
9.9 Acknowledgements
This Chapter has been prepared by Nikolai I. Voropai, Professor, Corresponding Member of
RAS, Director of Energy Systems Institute, Irkutsk, Russia. Contributors include colleagues
at the Institute and Members of the IEEE PES W.G. on Asian and Australian Electricity
Infrastructure.
9.10 References
[1]. Open Access in Inter-State Transmission, Central Electricity Regulatory Commission, New
Delhi, India, Nov. 2003.
[2]. Electricity Act 2003, Ministry of Power, Government of India, New Delhi, India, June
2003.
[3]. Mukhopadhyay, S., “Interconnection of Power Grids in South Asia”, Proc. 2003 IEEE PES
General Meeting, Toronto, Ontario, Canada.
[4]. Mukhopadhyay, S., “Power Generation and Transmission Planning in India – Metho-
dology, Problems and Investments”, Proc. 2004 IEEE PES General Meeting, Denver,
Colorado, USA.
[5]. National Electricity Code Administrator website. www.neca.com.au
[6]. Ershevich, V.V., Antimenko, Yu.A., “Efficiency of the Unified Electric Power System
Operation on the Territory of the Former USSR”, Izv. RAN. Energetika, 1993, No. 1
(in Russian).
[7]. Voropai, N.I., Ershevich, V.V., Rudenko, Yu.N., Development of the International Intercon-
nections – the Way to Creation of the Global Power System, Irkutsk: SEI SB RAS, 1995,
Vol. 10 (in Russian).
[8]. Belyev, L.S., Voizekhovskaya, G.V., Saveliev, V.A., A System Approach to Power System
Development Management, Novosibirsk: Nauka, 1980 (in Russian).
[9]. Belyaev, L.S., Kononov, Yu.D., Makarov, A.A., “Methods and Models for Optimization
of Energy Systems Development”, Soviet Experience Review of Energy Models., Lax-
enburg: IIASA, 1976, No. 3.
[10]. Voropai, N.I., Trufanov, V.V., Selifanov, V.V., Sheveleva, G.I., “Modeling of Power
Systems Expansion and Estimation of System Efficiency of Their Integration in the
Liberalized Environment”, Proc. CIGRE 2004 Session, Rep. C1-103.
[11].
[12].
[13].
[14].
[15].
[16].
[17].
[18]. Schweppe, F. C., et al, Spot Pricing of Electricity, Kluwer Academic Publisher, 1988.
[19]. Chao, H. P., Huntington, H. G., Designing Competitive Electricity Markets, Kluwer Aca-
demic Publisher, 1998.
[20]. Ilic, M., Galiana, F., Fink, L., Power Systems Restructuring, Engineering and Economics,
Kluwer Academic Publisher, 1998.
[21]. Cameron, L., “Transmission Investment: Obstacles to a Market Approach”, The Electric-
ity Journal, 2001, Vol. 14, No. 2.
[22]. Kahn, E. P., “Numerical Techniques for Analyzing Market Power in Electricity”,The
Electricity Journal, 1998,Vol. 11, No. 6.
[23]. Oren, S.S., Ross, A.M., “Economic Congestion Relief Across Multiple Regions Requires
Tradable Physical Flow-Gate Rights”, IEEE Trans. on PWRS, 2002, Vol. 17, No. 1.
[24]. Wu, F. F., Ni, Y., Wei, P., “Power Transfer Allocation for Open Access Using Graph
Theory: Fundamentals and Applications in Systems without Loopflow”, IEEE
Trans. on PWRS, 2000,Vol. 15, No. 3.
[25]. State Power Information Network, http:// www.sp.com.cn
[26]. Electric Power Info Net of China,
[27]. Association of the Chinese Electric Power Enterprises, . org.cn
[28]. Electric Power News Net of China,
[29]. East China Power Market Steering Committee Office, “East China Power Market Pilot
Work Documents”, No. 18-19, 2004.
[30]. Gan, D., Bourcier, D. V., "Locational Market Power Screen and Congestion Manage-
ment: Experience and Suggestions", IEEE Transactions on Power Systems, 2002, Vol.
17, No. 1.
[31]. Mas-Colell, A., Whinston, M. D., Green, J. R., Microeconomic Theory, Oxford University
Press, Oxford, UK, 1995.
[32]. Federal Energy Regulation Council (FERC), “Working Paper on Standardized Trans-
mission Service and Wholesale Electricity Market Design”, March 16, 2002. http://
www.ferc.fed.gov
[33]. LECG, LLC, Kema Consulting, Inc, “Feasibility Study for a Combined Day-Ahead
Electricity Market in the Northeast”, 2nd Draft Report, Albany, April 26, 2001.
[34]. Hunt, S. , Shuttleworth, G., Competition and Choice in Electricity, New York, Wiley, 1997.
[35].
[36]. Hur, D., "Determination of Transmission Transfer Capability Using Distributed Con-
tingency-Constrained Optimal Power Flow and P-V Analysis," Ph.D. dissertation,
School of Elect. Eng., Seoul Nat. Univ., Korea, 2004.
[37]. Hur, D., Park, J. K, Kim, B. H., "Application of Distributed Optimal Power Flow to
Power System Security Assessment," Electr. Power Components Syst., 2003, Vol. 31,
No.1.
Electricity Infrastructures in the Global Marketplace394
[38]. Hur, D., Park, J. K., Kim, B. H., "An Efficient Methodology for Security Assessment of
Power Systems based on Distributed Optimal Power Flow," Eur. Trans. Elect. Power,
2003, Vol. 13, No. 3.
[39]. Network Planning in a Deregulated Environment, CIGRE WG 37-30, Feb. 2003.
[40]. Park, D.et al, “1
st
Report for Infrastructure on NEAREST Project”, KERI, Tech. Report.
Nov. 2003.
[41]. Park, D., Podkovalnikov S., “Analysis of Scenarios for Potential Power System Inter-
connections in Northeast Asia”, AEC Conference, September 2004.
[42]. Belyaev, L., Podkovalnikov, S., “An Approach to and Results of Effectiveness Assess-
ment of Inter-Tie RFE – DPRK – ROK>”, AEC Conf., Irkutsk, Russia, September 21-
22, 2000.
[43]. “A Preliminary Study of the Power System Interconnections in Northeast Asia Coun-
tries”, KERI, KEPCO, Tech. Rep, 2000.
[44]. Podkovalnikov, S., “East Siberia and Rusian Far East Estimated Prospective Export
Potentials”, KERI-ESI Tech. Report, Nov. 2004.
[45]. Yoon, J., et al, “Maximum Exchange Power Between Russia and Republic of Korea”,
AEC – 2005 Conf., Irkutsk, Russia, September 13-17, 2004.
[46]. Yoon, J., et al, “Economic Analysis Methodology of Power System Interconnections
Considering Conventional Economic Benefits and Environmental Effects”, ICEE
Conf., July 20-24, 2002, Xian, China.
[47]. Voropai, N.I., Kononov, Y.D. and Saneev, B.G., “Prerequisites and Directions of Energy
Integration in North-Eastern Asia”, Proceeding of International Conference, Irkutsk,
Russia, September 22-26, 1998.
[48]. Park, D. W., Hwang, C., Na, K. Y, Kim, I. S., “The Status Quo and Prospects of Korea
Power System”, Proc. of Int. Conf., Irkutsk, Russia, September 22-26, 1998.
[49]. Long, W. F., Stovall ,J. P., “Comparison of Costs and Benefits for DC and AC Transmis-
sion”, CIGRE Symposium on DC and AC Transmission Interaction and Comparisons,
Boston, USA, June 13-17, 1987.
[50]. Belyaev, L. S., Chudinova, L. Yu., Koshchceev, L. A., Podkovalnikov, S. V., Savelyev,
V. A., Voropai, N. I., “The High Direct Current Bus Siberia-Russian Far East“, Proc.
of Int. Conf. ECNEA-2002 (3rd), Irkutsk, Russia, September 9-13, 2002.
[51]. Samorodov, G., Krasilnikova, T., Zilberman, S., Iatsenko, R., Kobylin, V., Drujinin, A.,
“Consideration on Technical-Economic and Reliability Performance of the Trans-
mission System from South-Yakutia Hydro Power Complex to Korea“, Proc. of Int.
Conf. ECNEA-2002 (3rd), Irkutsk, Russia, September 9-13, 2002.
[52]. Shin ,J. R, Kim, B. S., Choi ,Y. J., “Power System Linkage between South and North in
Korean Peninsula: A Proposal with Supposed Situation“, Proc. of ICEE 2001, Xian,
China, July 23-27, 2001.
[53]. Jang ,Y. J., Lee, S. S., Park ,J. K., Kim, K. H., “Scenarios based Power Flow Analysis for
the Interconnection of Power Systems between South and North Korea“, Proc. of
ICEE 2001, Xian, China, July 23-27, 2001.
[54]. Nahm, J. I., “Electric Power Supply in Korea & The KEDO Project“, Tech. Report, 2002.
[55]. Lee ,S. S., Jang, G. S., Park, J. K., Honma,T., Minakawa ,T., “Scenario and Power Flow
Analysis for 765kV Interconnection between South and North Korea“, Proc. of ICEE
2002, Jeju, Korea, July 13-17, 2002.
[56]. Lee, S. S., Park, J. K., “765kV Interconnection Scenarios and Power Flow Analysis in
Korean Peninsula“, Proc. of Int. Conf. ECNEA-2002 (3rd), Irkutsk, Russia, September
9-13, 2002.
[57]. Lee, S. S., Park, J. K., Moon, S. I., "Power System Interconnection Scenario and Analysis
Between Korean Peninsula and Japan", IEEE 2003 General Meeting, Toronto, Cana-
da, July 2-6, 2003.
[58]. Lee, S. S., Park, J. K., Moon, S. I., Moon ,J. F., Kim J. C., Kim, S. K., Kim, H. Y., "North-
East Asia Interconnection Scenario Map, and Power Reserve Strategy in South Ko-
rea", IEEE 2004 General Meeting, Denver, USA, June 24-28, 2004.
[59]. Gerasimov, A. S., Koshcheev, L. A., “Russia – Korea Interstate Electrical Tie“, Proc. of
Int. Conf. ECNEA-2004 (4rd), Irkutsk, Russia, September 13-17, 2002.
[60]. 2001’ Report, (Korea Power Exchange, Tech Report, 2001.
[61]. 2000’ Annual Report, Liaoning Electric Power Co., LTD.
[62]. Manual of Central Load Dispatching Center, Kyushu Electric Power Co., Inc , 2001.
[63]. Annual Report of Central Dispatch Center of Russia, Technical Part, 2001 (in Russian).
[64]. Annual Report of Regional Dispatch Center of RFE, 2001(in Russian).
[65]. Takeshi, T., “Liberalization of Electricity Market in Japan”, Korea-Japan Symp., Seoul,
Korea, July 2-6, 2002.
[66]. KERI, IEA, APERC, Vostokenergo, International Symposium on NEAREST, Vladivos-
tok, Russia, August 24-27, 2004.
Status of Power Markets and Power Exchanges in Asia and Australia 395
[38]. Hur, D., Park, J. K., Kim, B. H., "An Efficient Methodology for Security Assessment of
Power Systems based on Distributed Optimal Power Flow," Eur. Trans. Elect. Power,
2003, Vol. 13, No. 3.
[39]. Network Planning in a Deregulated Environment, CIGRE WG 37-30, Feb. 2003.
[40]. Park, D.et al, “1
st
Report for Infrastructure on NEAREST Project”, KERI, Tech. Report.
Nov. 2003.
[41]. Park, D., Podkovalnikov S., “Analysis of Scenarios for Potential Power System Inter-
connections in Northeast Asia”, AEC Conference, September 2004.
[42]. Belyaev, L., Podkovalnikov, S., “An Approach to and Results of Effectiveness Assess-
ment of Inter-Tie RFE – DPRK – ROK>”, AEC Conf., Irkutsk, Russia, September 21-
22, 2000.
[43]. “A Preliminary Study of the Power System Interconnections in Northeast Asia Coun-
tries”, KERI, KEPCO, Tech. Rep, 2000.
[44]. Podkovalnikov, S., “East Siberia and Rusian Far East Estimated Prospective Export
Potentials”, KERI-ESI Tech. Report, Nov. 2004.
[45]. Yoon, J., et al, “Maximum Exchange Power Between Russia and Republic of Korea”,
AEC – 2005 Conf., Irkutsk, Russia, September 13-17, 2004.
[46]. Yoon, J., et al, “Economic Analysis Methodology of Power System Interconnections
Considering Conventional Economic Benefits and Environmental Effects”, ICEE
Conf., July 20-24, 2002, Xian, China.
[47]. Voropai, N.I., Kononov, Y.D. and Saneev, B.G., “Prerequisites and Directions of Energy
Integration in North-Eastern Asia”, Proceeding of International Conference, Irkutsk,
Russia, September 22-26, 1998.
[48]. Park, D. W., Hwang, C., Na, K. Y, Kim, I. S., “The Status Quo and Prospects of Korea
Power System”, Proc. of Int. Conf., Irkutsk, Russia, September 22-26, 1998.
[49]. Long, W. F., Stovall ,J. P., “Comparison of Costs and Benefits for DC and AC Transmis-
sion”, CIGRE Symposium on DC and AC Transmission Interaction and Comparisons,
Boston, USA, June 13-17, 1987.
[50]. Belyaev, L. S., Chudinova, L. Yu., Koshchceev, L. A., Podkovalnikov, S. V., Savelyev,
V. A., Voropai, N. I., “The High Direct Current Bus Siberia-Russian Far East“, Proc.
of Int. Conf. ECNEA-2002 (3rd), Irkutsk, Russia, September 9-13, 2002.
[51]. Samorodov, G., Krasilnikova, T., Zilberman, S., Iatsenko, R., Kobylin, V., Drujinin, A.,
“Consideration on Technical-Economic and Reliability Performance of the Trans-
mission System from South-Yakutia Hydro Power Complex to Korea“, Proc. of Int.
Conf. ECNEA-2002 (3rd), Irkutsk, Russia, September 9-13, 2002.
[52]. Shin ,J. R, Kim, B. S., Choi ,Y. J., “Power System Linkage between South and North in
Korean Peninsula: A Proposal with Supposed Situation“, Proc. of ICEE 2001, Xian,
China, July 23-27, 2001.
[53]. Jang ,Y. J., Lee, S. S., Park ,J. K., Kim, K. H., “Scenarios based Power Flow Analysis for
the Interconnection of Power Systems between South and North Korea“, Proc. of
ICEE 2001, Xian, China, July 23-27, 2001.
[54]. Nahm, J. I., “Electric Power Supply in Korea & The KEDO Project“, Tech. Report, 2002.
[55]. Lee ,S. S., Jang, G. S., Park, J. K., Honma,T., Minakawa ,T., “Scenario and Power Flow
Analysis for 765kV Interconnection between South and North Korea“, Proc. of ICEE
2002, Jeju, Korea, July 13-17, 2002.
[56]. Lee, S. S., Park, J. K., “765kV Interconnection Scenarios and Power Flow Analysis in
Korean Peninsula“, Proc. of Int. Conf. ECNEA-2002 (3rd), Irkutsk, Russia, September
9-13, 2002.
[57]. Lee, S. S., Park, J. K., Moon, S. I., "Power System Interconnection Scenario and Analysis
Between Korean Peninsula and Japan", IEEE 2003 General Meeting, Toronto, Cana-
da, July 2-6, 2003.
[58]. Lee, S. S., Park, J. K., Moon, S. I., Moon ,J. F., Kim J. C., Kim, S. K., Kim, H. Y., "North-
East Asia Interconnection Scenario Map, and Power Reserve Strategy in South Ko-
rea", IEEE 2004 General Meeting, Denver, USA, June 24-28, 2004.
[59]. Gerasimov, A. S., Koshcheev, L. A., “Russia – Korea Interstate Electrical Tie“, Proc. of
Int. Conf. ECNEA-2004 (4rd), Irkutsk, Russia, September 13-17, 2002.
[60]. 2001’ Report, (Korea Power Exchange, Tech Report, 2001.
[61]. 2000’ Annual Report, Liaoning Electric Power Co., LTD.
[62]. Manual of Central Load Dispatching Center, Kyushu Electric Power Co., Inc , 2001.
[63]. Annual Report of Central Dispatch Center of Russia, Technical Part, 2001 (in Russian).
[64]. Annual Report of Regional Dispatch Center of RFE, 2001(in Russian).
[65]. Takeshi, T., “Liberalization of Electricity Market in Japan”, Korea-Japan Symp., Seoul,
Korea, July 2-6, 2002.
[66]. KERI, IEA, APERC, Vostokenergo, International Symposium on NEAREST, Vladivos-
tok, Russia, August 24-27, 2004.
Electricity Infrastructures in the Global Marketplace396
Power Generation in Southern Africa: Energy Trading and the Southern African Power Pool 397
X
Power Generation in Southern Africa: Energy
Trading and the Southern African Power Pool
This Chapter reviews power generation and energy trading arrangements that exist in
southern Africa. The Chapter also considers the operations and workings of the Southern
African Power Pool. The Southern African Power Pool (SAPP) was created in April 1995
through the Southern African Development Community (SADC) treaty that was signed to
optimize the use of available energy resources amongst the countries in the region and
support one another during emergencies. At the time of creation, the SADC governments
agreed to allow their national power utilities to enter into the necessary agreements that
regulate the establishment and operation of the SAPP. SAPP membership was therefore
restricted to national power utilities of the SADC member states as stipulated in the Inter-
Governmental Memorandum of Understanding (IGMOU). In the Revised IGMOU of 23
February 2006, SAPP membership was extended to include other Electricity Supply
Enterprises within the SADC region.
10.1 Structure and Governing Documents
There are four legal documents covering the rights and obligations of the SAPP members
and participants:
(i.) Inter-governmental memorandum of understanding (IGMOU) that grants permission for
the utilities to participate in the SAPP and enter into contracts, and guarantees the
financial and technical performance of the power utilities. The original document
was signed in 1995 by SADC members, excluding the Democratic Republic of Congo
(DRC), Madagascar, Mauritius and Seychelles. All the SADC countries, with the
exception of Madagascar, Mauritius and Seychelles, signed the Revised IGMOU on
23 February 2006.
(ii.) Inter-utility memorandum of understanding (IUMOU) between participants, defining
ownership of assets and other rights, e.g. provision for change in status from
participating to operating member. The Revised IUMOU was signed by all the SAPP
member utilities on 25 April 2007 in Harare, Zimbabwe, with the exception of SNEL
of the DRC and TANESCO of Tanzania. TANESCO signed the Revised IUMOU in
February 2008 and SNEL in April 2008. The Revised IUMOU has defined a new
structure for the management and operations of the SAPP.
(iii.) Agreement between operating members (ABOM), which determines the interaction between
the utilities with respect to operating responsibilities under normal and emergency
conditions. Operating Members only, i.e., members whose transmission system is
interconnected to the SAPP grid signed this document. The document is currently under
review and when completed would be signed by all Operating Members.
10
Electricity Infrastructures in the Global Marketplace398
The SADC Government Ministers and Officials are responsible for policy matters normally
under their control within the national administrative and legislative mechanisms
regulating the relations between the Government and the national power utility.
The Chief Executives of the members and a representative from the SADC Secretariat form
the Executive Committee. The Executive Committee will refer matters such as requests for
membership by non-SADC countries and major policy issues that may arise to the SADC Ad
Hoc Committee of Energy Ministers. A country with more than one member utility would
need to designate one utility to represent it on the Executive Committee.
The Management Committee oversees and decides on the recommendations of the Sub-
Committees and the Coordination Center Board.
The Operating Sub- Committees consist of representatives from those power utilities already
interconnected and exchange power on a major scale (Operating Members), presently 9
countries (Botswana, South Africa, Zambia, Zimbabwe, Democratic Republic of Congo,
Lesotho, Mozambique, Namibia and Swaziland). The duties of the sub-committee include
the establishment and updating of methods and standards to measure technical
performance, operating procedures including operating reserve obligations
The Planning Sub-Committee establishes and updates common planning and reliability
standards, review integrated generation and transmission plans, evaluate software and
other planning tools, determine transfer capability between systems etc.
The Environmental Sub-Committee consists of appointed representatives from each Operating
Member. The committee develops Environmental Guidelines for SAPP; liaise with
Governments to keep abreast of world and regional matters relating to air quality, water
quality, land use and other environmental issues. Where Governments have in place related
Environmental Organizations, the Committee has to liaise with them to assist one another
on specific issues.
The Markets Sub-Committee is responsible for the design and continued development of the
electricity market in the region and determines criteria to authorize this trade.
All the Sub-Committees consist of a maximum of two representatives per Member who are of
sufficient seniority in their own organization to make all relevant decisions.
The Coordination Center reports to a Co-ordination Center Board consisting of a maximum of
two representatives of each National Power Utility (i.e. the signatories of the IUMOU).
10.1.1 SAPP Vision
The vision of the SAPP is to facilitate the development of competitive electricity market
where an end user within the SADC region ultimately has possibility of choosing the
preferred supplier of electrical energy. To promote the vision and change it into a reality,
SAPP is about to change from a cooperative pool to a competitive power market trading
both physical and financial contracts. The challenge for SAPP will be to manage all the
(iv.) Operating guidelines (OG), which defines the sharing of costs and functional
responsibilities for plant operation and maintenance including safety rules.
The basis for the SAPP as defined in the Revised IGMOU is the need for all participants to:
(a) Co-ordinate and co-operate in the planning and operation of their systems to
minimize costs while maintaining reliability, autonomy and self-sufficiency to
the degree they desire;
(b) Fully recover their costs and share equitably in the resulting benefits,
including reductions in required generating capacity, reductions in fuel costs
and improved use of hydroelectric energy; and
(c) Co-ordinate and co-operate in the planning, development and operation of a
regional electricity market based on the requirements of SADC Member States.
In order to carry out the vision of the SAPP, a Coordination Center was established in Harare,
Zimbabwe, in February 2000 to act as a focal point for all the SAPP activities. A Host Country
Agreement (HCA) was afterwards signed between the Government of Zimbabwe and SAPP on
13 March 2006 giving the SAPP Coordination Center a Diplomatic Status. Also a Memorandum
of Understanding between SAPP and the Regional Electricity Regulators Association (RERA) on
liaison and interaction between the two parties was entered into in April 2007.
The structure of the SAPP is shown in Figure 10.1.
Fig. 10.1 Reporting Structure of the SAPP
SADC – Directorate of
Infrastructure and
Services
Executive Committee
Management Committee
Planning
Sub-
Committee
CC
Board
Coordination Centre
Management
Operating
Sub-
C
ommittee
Environmental
Sub-Committee
Markets
Sub-
Committee
Power Generation in Southern Africa: Energy Trading and the Southern African Power Pool 399
The SADC Government Ministers and Officials are responsible for policy matters normally
under their control within the national administrative and legislative mechanisms
regulating the relations between the Government and the national power utility.
The Chief Executives of the members and a representative from the SADC Secretariat form
the Executive Committee. The Executive Committee will refer matters such as requests for
membership by non-SADC countries and major policy issues that may arise to the SADC Ad
Hoc Committee of Energy Ministers. A country with more than one member utility would
need to designate one utility to represent it on the Executive Committee.
The Management Committee oversees and decides on the recommendations of the Sub-
Committees and the Coordination Center Board.
The Operating Sub- Committees consist of representatives from those power utilities already
interconnected and exchange power on a major scale (Operating Members), presently 9
countries (Botswana, South Africa, Zambia, Zimbabwe, Democratic Republic of Congo,
Lesotho, Mozambique, Namibia and Swaziland). The duties of the sub-committee include
the establishment and updating of methods and standards to measure technical
performance, operating procedures including operating reserve obligations
The Planning Sub-Committee establishes and updates common planning and reliability
standards, review integrated generation and transmission plans, evaluate software and
other planning tools, determine transfer capability between systems etc.
The Environmental Sub-Committee consists of appointed representatives from each Operating
Member. The committee develops Environmental Guidelines for SAPP; liaise with
Governments to keep abreast of world and regional matters relating to air quality, water
quality, land use and other environmental issues. Where Governments have in place related
Environmental Organizations, the Committee has to liaise with them to assist one another
on specific issues.
The Markets Sub-Committee is responsible for the design and continued development of the
electricity market in the region and determines criteria to authorize this trade.
All the Sub-Committees consist of a maximum of two representatives per Member who are of
sufficient seniority in their own organization to make all relevant decisions.
The Coordination Center reports to a Co-ordination Center Board consisting of a maximum of
two representatives of each National Power Utility (i.e. the signatories of the IUMOU).
10.1.1 SAPP Vision
The vision of the SAPP is to facilitate the development of competitive electricity market
where an end user within the SADC region ultimately has possibility of choosing the
preferred supplier of electrical energy. To promote the vision and change it into a reality,
SAPP is about to change from a cooperative pool to a competitive power market trading
both physical and financial contracts. The challenge for SAPP will be to manage all the
(iv.) Operating guidelines (OG), which defines the sharing of costs and functional
responsibilities for plant operation and maintenance including safety rules.
The basis for the SAPP as defined in the Revised IGMOU is the need for all participants to:
(a) Co-ordinate and co-operate in the planning and operation of their systems to
minimize costs while maintaining reliability, autonomy and self-sufficiency to
the degree they desire;
(b) Fully recover their costs and share equitably in the resulting benefits,
including reductions in required generating capacity, reductions in fuel costs
and improved use of hydroelectric energy; and
(c) Co-ordinate and co-operate in the planning, development and operation of a
regional electricity market based on the requirements of SADC Member States.
In order to carry out the vision of the SAPP, a Coordination Center was established in Harare,
Zimbabwe, in February 2000 to act as a focal point for all the SAPP activities. A Host Country
Agreement (HCA) was afterwards signed between the Government of Zimbabwe and SAPP on
13 March 2006 giving the SAPP Coordination Center a Diplomatic Status. Also a Memorandum
of Understanding between SAPP and the Regional Electricity Regulators Association (RERA) on
liaison and interaction between the two parties was entered into in April 2007.
The structure of the SAPP is shown in Figure 10.1.
Fig. 10.1 Reporting Structure of the SAPP
SADC – Directorate of
Infrastructure and
Services
Executive Committee
Management Committee
Planning
Sub-
Committee
CC
Board
Coordination Centre
Management
Operating
Sub-
C
ommittee
Environmental
Sub-Committee
Markets
Sub-
Committee
Electricity Infrastructures in the Global Marketplace400
Coordinate the training of members of staff to improve the region’s knowledge of power
pool operations; and
Provide power pool statistics and maintaining a pool database for planning and
development.
A website was developed as a means for SAPP to communicate with the world and inform
interested persons of its activities. The Coordination Center also acts as a secretariat for the
various SAPP committees and its sub-committees.
The twelve members of SAPP fund the activities of the Coordination Center through an
annual subscription fund. The Coordination Center makes a budget and this is presented to
the Coordination Center Board for approval. The Coordination Center Board is made up of
senior managers of utility representatives and one of their functions is to oversee the
activities of the Coordination Center including the approval of the budget. This budget is
used to pay for staff salaries and other SAPP operational costs.
Internationally reputable auditors have been appointed to audit the SAPP Coordination
Center finances periodically. The audited financial report is then distributed to members
and is also published as part of the SAPP
10.1.5 SAPP Membership
The governance and membership of the SAPP was derived from the desire for economic co-
operation and integration, equitable sharing of resources and support of one another in
times of crisis under the SADC protocol. The environment under which the power pool now
operates, and the ongoing development of a competitive market, will significantly change
the basis for the operation of the SAPP. The Pool has therefore recently reviewed its
governance and membership in order to achieve a competitive market including giving
access for an increased number of participants.
F
ull Name o
f
Utilit
y
Status
Abbreviation
Countr
y
Botswana Power Corporation OP BPC Botswana
Electricidade de Moçambique OP EDM Mozambique
Electricity Supply Commission of Malawi
NP ESCOM Malawi
Empresa Nacional de Electricidade NP ENE Angola
Eskom OP Eskom RSA
Lesotho Electricity Corporation OP LEC Lesotho
NamPower OP NamPower Namibia
Societe Nationale d’Electricite OP SNEL DRC
Swaziland Electricity Board OP SEB Swaziland
Tanzania Electricity Supply Company Ltd NP TANESCO Tanzania
ZESCO Limited OP ZESCO Zambia
Zimbabwe Electricity Supply Authority OP ZESA Zimbabwe
OP = Operating member NP = Non-Operating member
Table 10.1 SAPP Membership
SAPP membership is as per the latest revision of the IUMOU open to national power
utilities and other Electricity Supply Enterprises (Power Utility, Independent Power
difficulties and uncertainties envisaged to emerge during the transition period from
administrating a corporative market to the geographical biggest competitive pool in the
World. At the same time as the transition is taking place, the SAPP has run out of generation
surplus capacity resulting in load shedding in a number of member countries.
10.1.2 SAPP Objectives
The SAPP objectives are:
To provide a forum for the development of a world class, robust, safe, efficient, reliable
and stable interconnected electrical system in the region.
Harmonise inter-utility relationships.
Co-ordinate the development of common regional standards on quality of supply;
measurement and monitoring of systems performance; enforcement of standards, and
facilitate the development of regional expertise through training programs and research.
10.1.3 SAPP Mission, Strategy and Values
Mission
The Mission of SAPP is to provide the least cost, environmentally friendly and affordable
energy and increase accessibility to rural communities.
The Strategy
In its operation the SAPP aims at being the most preferred region for investment for value
for money by energy intensive users.
The Values
Respect for others and develop mutual trust
Honesty, complete fairness and integrity in dealing with issues
Selfless discharge of duties
Full accountability to the organization and its stakeholders
Encourage openness and objectivity.
10.1.4 SAPP Coordination Center
The SAPP Coordination Center was established in Harare, Zimbabwe, at the beginning of the
year 2000. The Center represents a focal point of SAPP and a staff to further its vision and
technical challenges. In addition to the Manager, a total of seven (7) support staff in fields of
Finance, Information Technology, Environment and Secretarial are presently employed at the
Coordination Center. The functions of the SAPP Coordination Center are to:
Implement the SAPP objectives; provide a focal point for SAPP activities; facilitate the
implementation of a competitive electricity market in the SADC region;
Monitor the operations of SAPP transactions between the members;
Carry out technical studies on the power pool to evaluate the impact of future projects
on the operation of the pool;
Power Generation in Southern Africa: Energy Trading and the Southern African Power Pool 401
Coordinate the training of members of staff to improve the region’s knowledge of power
pool operations; and
Provide power pool statistics and maintaining a pool database for planning and
development.
A website was developed as a means for SAPP to communicate with the world and inform
interested persons of its activities. The Coordination Center also acts as a secretariat for the
various SAPP committees and its sub-committees.
The twelve members of SAPP fund the activities of the Coordination Center through an
annual subscription fund. The Coordination Center makes a budget and this is presented to
the Coordination Center Board for approval. The Coordination Center Board is made up of
senior managers of utility representatives and one of their functions is to oversee the
activities of the Coordination Center including the approval of the budget. This budget is
used to pay for staff salaries and other SAPP operational costs.
Internationally reputable auditors have been appointed to audit the SAPP Coordination
Center finances periodically. The audited financial report is then distributed to members
and is also published as part of the SAPP
10.1.5 SAPP Membership
The governance and membership of the SAPP was derived from the desire for economic co-
operation and integration, equitable sharing of resources and support of one another in
times of crisis under the SADC protocol. The environment under which the power pool now
operates, and the ongoing development of a competitive market, will significantly change
the basis for the operation of the SAPP. The Pool has therefore recently reviewed its
governance and membership in order to achieve a competitive market including giving
access for an increased number of participants.
F
ull Name o
f
Utilit
y
Status
Abbreviation
Countr
y
Botswana Power Corporation OP BPC Botswana
Electricidade de Moçambique OP EDM Mozambique
Electricity Supply Commission of Malawi
NP ESCOM Malawi
Empresa Nacional de Electricidade NP ENE Angola
Eskom OP Eskom RSA
Lesotho Electricity Corporation OP LEC Lesotho
NamPower OP NamPower Namibia
Societe Nationale d’Electricite OP SNEL DRC
Swaziland Electricity Board OP SEB Swaziland
Tanzania Electricity Supply Company Ltd NP TANESCO Tanzania
ZESCO Limited OP ZESCO Zambia
Zimbabwe Electricity Supply Authority OP ZESA Zimbabwe
OP = Operating member NP = Non-Operating member
Table 10.1 SAPP Membership
SAPP membership is as per the latest revision of the IUMOU open to national power
utilities and other Electricity Supply Enterprises (Power Utility, Independent Power
difficulties and uncertainties envisaged to emerge during the transition period from
administrating a corporative market to the geographical biggest competitive pool in the
World. At the same time as the transition is taking place, the SAPP has run out of generation
surplus capacity resulting in load shedding in a number of member countries.
10.1.2 SAPP Objectives
The SAPP objectives are:
To provide a forum for the development of a world class, robust, safe, efficient, reliable
and stable interconnected electrical system in the region.
Harmonise inter-utility relationships.
Co-ordinate the development of common regional standards on quality of supply;
measurement and monitoring of systems performance; enforcement of standards, and
facilitate the development of regional expertise through training programs and research.
10.1.3 SAPP Mission, Strategy and Values
Mission
The Mission of SAPP is to provide the least cost, environmentally friendly and affordable
energy and increase accessibility to rural communities.
The Strategy
In its operation the SAPP aims at being the most preferred region for investment for value
for money by energy intensive users.
The Values
Respect for others and develop mutual trust
Honesty, complete fairness and integrity in dealing with issues
Selfless discharge of duties
Full accountability to the organization and its stakeholders
Encourage openness and objectivity.
10.1.4 SAPP Coordination Center
The SAPP Coordination Center was established in Harare, Zimbabwe, at the beginning of the
year 2000. The Center represents a focal point of SAPP and a staff to further its vision and
technical challenges. In addition to the Manager, a total of seven (7) support staff in fields of
Finance, Information Technology, Environment and Secretarial are presently employed at the
Coordination Center. The functions of the SAPP Coordination Center are to:
Implement the SAPP objectives; provide a focal point for SAPP activities; facilitate the
implementation of a competitive electricity market in the SADC region;
Monitor the operations of SAPP transactions between the members;
Carry out technical studies on the power pool to evaluate the impact of future projects
on the operation of the pool;
Electricity Infrastructures in the Global Marketplace402
ahead market-trading platform that has been developed by NordPool. The SAPP
Executive Committee will determine the date for the market opening. The
recommendations of the Management Committee are to wait until governance issues are
resolved within the SAPP. It was expected that the opening would take place towards
the end of 2007.
In order to assure a proper development and operation of a competitive electricity
market, the SAPP has developed long-term transmission pricing policies and
implementation procedures and an ancillary services market. SAPP and Sida signed an
agreement in July 2004 covering financial assistance to provide the necessary
consultancy services for this and an English company, Power Planning Associates (PPA)
was assigned to carry out the task.
10.2.6 Completed transmission projects
The following transmission lines have been commissioned:
The 400kV Matimba (South Africa) – Insukamini (Zimbabwe) interconnector linking
Eskom of South Africa and ZESA of Zimbabwe in 1995.
BPC Phokoje substation was tapped into the Matimba line to allow Botswana’s tapping
into the SAPP grid at 400kV in 1998.
The 330kV Mozambique-Zimbabwe interconnector was commissioned in 1997.
The restoration of the 533kV DC lines between Cahora Bassa in Mozambique and Apollo
substation in South Africa was completed in 1998.
The 400kV line between Aggeneis in South Africa and Kookerboom in Namibia in 2001.
The 400kV line between Arnot in South Africa and Maputo in Mozambique in 2001.
The 400kV line between Camden in South Africa via Edwaleni in Swaziland to Maputo
in Mozambique in 2000.
The 220kV Livingstone (Zambia)-Katima Mulilo (Namibia) interconnector was
commissioned in 2006.
10.2.7 Establishment of Westcor
The establishment and launching of the Western Power Corridor (Westcor) in April 2002 to
develop the hydropower generation resources in the DRC, Angola and Namibia; and the
transmission links from the DRC via Angola, Namibia, Botswana to South Africa, including
a telecommunication network has been a great welcome to the region. A Project Office was
opened in May 2006 in Gaborone, Botswana.
10.2.8 Environmental Guidelines
The SAPP has completed and approved the following environmental guidelines:
Environmental Impact assessment (EIA) Guidelines for Transmission Lines
Environmental Impact assessment (EIA) Guidelines for Thermal Power Plants
Guidelines on the Management of Oil Spills
Guidelines for the Safe Control, Processing, Storing, Removing and Handling of
Asbestos Containing Material
Producer, Independent Transmission Company and/or Service Provider for the electricity
market), from SADC member countries. There are currently twelve SAPP members as
indicated in Table 10.1, nine operating members and three non-operating members.
10.2 Sapp Achievements
From the time that the SAPP was created in 1995, the following achievements have been
made:
10.2.1 Coordination Center
The official opening of the SAPP Co-ordination Center in Harare on the 18
th
of November
2002 was marked as a great success. The Guest of Honor was the Minister of Petroleum of
Angola: The Honorable, José Maria Botelho de Vasconcelos.
10.2.2 Documentation Review and SAPP Restructuring
The signing of the Revised Inter-Governmental Memorandum of Understanding (IGMOU)
by the Ministers responsible for energy in the SADC region in Gaborone, Botswana, on 23
February 2006, was the beginning of the restructuring of the SAPP. The Chief Executives of
the SAPP Member Utilities then signed the Revised Inter-Utility Memorandum of
Understanding (IUMOU) on 25 April 2007 in Harare, Zimbabwe. Therefore, other Electricity
Supply Enterprises (Power Utility, Independent Power Producer, Independent
Transmission Company and/or Service Provider for the electricity market), from SADC
member countries can now join the SAPP.
10.2.3 Cooperation with the Regional Electricity Regulatory Association (RERA)
The resolution of the SAPP-RERA relationship and the signing of the SAPP-RERA
Memorandum of Understanding on 25 April 2007 in Harare, Zimbabwe. This is a
cooperation agreement that will allow the two institutions to work together and cooperate
for the common good of the SADC region.
10.2.4 Transmission wheeling charges and losses
The SAPP adopted a scientific method for the determination of transmission wheeling
charges. The new transmission wheeling charges were implemented over a three-year
period starting from the 1
st
of January 2003. In the same year, the SAPP also approved the
enforcement of Article 11.3.3 of the Agreement between Operating Members on
transmission losses.
10.2.5 Development of a competitive electricity market
In April 2001, the SAPP started the short-term energy market (STEM) as a precursor to a
full competitive market. At the time of this publication, there are eight participants on
the STEM from an initial number of two at the start of the market in April 2001.
The development of the competitive electricity market started in January 2004 when an
Agreement between the Government of Norway and SAPP provided SAPP with a grant
to the amount of NOK 35 million for this purpose. The SAPP is currently testing the day-
Power Generation in Southern Africa: Energy Trading and the Southern African Power Pool 403
ahead market-trading platform that has been developed by NordPool. The SAPP
Executive Committee will determine the date for the market opening. The
recommendations of the Management Committee are to wait until governance issues are
resolved within the SAPP. It was expected that the opening would take place towards
the end of 2007.
In order to assure a proper development and operation of a competitive electricity
market, the SAPP has developed long-term transmission pricing policies and
implementation procedures and an ancillary services market. SAPP and Sida signed an
agreement in July 2004 covering financial assistance to provide the necessary
consultancy services for this and an English company, Power Planning Associates (PPA)
was assigned to carry out the task.
10.2.6 Completed transmission projects
The following transmission lines have been commissioned:
The 400kV Matimba (South Africa) – Insukamini (Zimbabwe) interconnector linking
Eskom of South Africa and ZESA of Zimbabwe in 1995.
BPC Phokoje substation was tapped into the Matimba line to allow Botswana’s tapping
into the SAPP grid at 400kV in 1998.
The 330kV Mozambique-Zimbabwe interconnector was commissioned in 1997.
The restoration of the 533kV DC lines between Cahora Bassa in Mozambique and Apollo
substation in South Africa was completed in 1998.
The 400kV line between Aggeneis in South Africa and Kookerboom in Namibia in 2001.
The 400kV line between Arnot in South Africa and Maputo in Mozambique in 2001.
The 400kV line between Camden in South Africa via Edwaleni in Swaziland to Maputo
in Mozambique in 2000.
The 220kV Livingstone (Zambia)-Katima Mulilo (Namibia) interconnector was
commissioned in 2006.
10.2.7 Establishment of Westcor
The establishment and launching of the Western Power Corridor (Westcor) in April 2002 to
develop the hydropower generation resources in the DRC, Angola and Namibia; and the
transmission links from the DRC via Angola, Namibia, Botswana to South Africa, including
a telecommunication network has been a great welcome to the region. A Project Office was
opened in May 2006 in Gaborone, Botswana.
10.2.8 Environmental Guidelines
The SAPP has completed and approved the following environmental guidelines:
Environmental Impact assessment (EIA) Guidelines for Transmission Lines
Environmental Impact assessment (EIA) Guidelines for Thermal Power Plants
Guidelines on the Management of Oil Spills
Guidelines for the Safe Control, Processing, Storing, Removing and Handling of
Asbestos Containing Material
Producer, Independent Transmission Company and/or Service Provider for the electricity
market), from SADC member countries. There are currently twelve SAPP members as
indicated in Table 10.1, nine operating members and three non-operating members.
10.2 Sapp Achievements
From the time that the SAPP was created in 1995, the following achievements have been
made:
10.2.1 Coordination Center
The official opening of the SAPP Co-ordination Center in Harare on the 18
th
of November
2002 was marked as a great success. The Guest of Honor was the Minister of Petroleum of
Angola: The Honorable, José Maria Botelho de Vasconcelos.
10.2.2 Documentation Review and SAPP Restructuring
The signing of the Revised Inter-Governmental Memorandum of Understanding (IGMOU)
by the Ministers responsible for energy in the SADC region in Gaborone, Botswana, on 23
February 2006, was the beginning of the restructuring of the SAPP. The Chief Executives of
the SAPP Member Utilities then signed the Revised Inter-Utility Memorandum of
Understanding (IUMOU) on 25 April 2007 in Harare, Zimbabwe. Therefore, other Electricity
Supply Enterprises (Power Utility, Independent Power Producer, Independent
Transmission Company and/or Service Provider for the electricity market), from SADC
member countries can now join the SAPP.
10.2.3 Cooperation with the Regional Electricity Regulatory Association (RERA)
The resolution of the SAPP-RERA relationship and the signing of the SAPP-RERA
Memorandum of Understanding on 25 April 2007 in Harare, Zimbabwe. This is a
cooperation agreement that will allow the two institutions to work together and cooperate
for the common good of the SADC region.
10.2.4 Transmission wheeling charges and losses
The SAPP adopted a scientific method for the determination of transmission wheeling
charges. The new transmission wheeling charges were implemented over a three-year
period starting from the 1
st
of January 2003. In the same year, the SAPP also approved the
enforcement of Article 11.3.3 of the Agreement between Operating Members on
transmission losses.
10.2.5 Development of a competitive electricity market
In April 2001, the SAPP started the short-term energy market (STEM) as a precursor to a
full competitive market. At the time of this publication, there are eight participants on
the STEM from an initial number of two at the start of the market in April 2001.
The development of the competitive electricity market started in January 2004 when an
Agreement between the Government of Norway and SAPP provided SAPP with a grant
to the amount of NOK 35 million for this purpose. The SAPP is currently testing the day-
Electricity Infrastructures in the Global Marketplace404
1606
5875
230
1045
868
793
2500
1800
700
770
280
210
950
100
200
96
150
1370
250
100
110
80
0 1000 2000 3000 4000 5000 6000
Eskom-BPC
Eskom-EDM
Eskom-LEC
Eskom-NamPower
Eskom-SEB
Eskom-ZESA
HCB-Eskom
HCB-ZESA
SNEL-Eskom
SNEL-ZESA
ZESCO-Eskom
Energy [GWh] Capacity [MW]
HCB hydro supply: 1,770MW, Eskom thermal supply: 1,706MW
Fig. 10.2 The 2005 Bilateral Contracts in SAPP
10.3.2 The Short-term Energy Market
The goal of standard market design is to establish an efficient and robustly competitive
wholesale electricity marketplace for the benefit of consumers. This could be done through
the development of consistent market mechanisms and efficient price signals for the
procurement and reliable transmission of electricity combined with the assurance of fair and
open access to the transmission system [3]. For the short-term energy market (STEM) design,
the following criteria were used [2,3,4]:
i.) Transmission rights
Long and short-term bilateral contracts between participants were given priority over
STEM contracts for transmission on the SAPP interconnectors. All the STEM contracts
are subject to the transfer constraints as verified by the SAPP Co-ordination Center.
ii.) Security requirements
Participants are required to lodge sufficient security deposit with the Co-ordination Center
before trading commences and separate security is required for each energy contract.
iii.) Settlement
Participants have the full obligation to pay for the energy traded and the associated
energy costs. The settlement amounts are based on the invoices and are payable into
the Co-ordination Center’s clearing account. It is the responsibility of the Participants
(buyers) to ensure that sufficient funds are paid into the clearing account for the Co-
ordination Center to effect payment to the respective Participants (sellers).
Guidelines for Management and Control of Electricity Infrastructure with regard to
Animal Interaction.
10.2.9 Other Completed Projects
The other completed projects include the following:
Completion of the SAPP Pool Plan in 2001. In 2006, the SAPP received a World Bank
grant to review the Pool Plan and the Revised Pool Plan was completed in November
2007.
In 2001, the SAPP received a World Bank grant to conduct a telecommunications study
on how best to link the three control areas. The recommendations of the study were to
use a VSAT solution in the short-term and fiber in the long-term. The SAPP has now
completed the implementation of a VSAT solution and the project has been
commissioned.
Frequency relaxation project was completed in 2003. The SAPP relaxed the operating
frequency from 50 +/-0.05 Hz to 50 +/-0.15 Hz. The new frequency bands were
implemented from January 2003.
10.3 Energy Trading
10.3.1 Bilateral Contracts
Based on the current SAPP Inter-Governmental Memorandum of Understanding, the
general arrangement for electricity trading in the SAPP is for the national power utilities to
engage into long-term and short-term bilateral contracts for the sourcing and consumption
of electrical energy. Thus, the intergovernmental agreements and the bilateral contracts
between the utilities form the basis and foundation for cross border electricity trading in the
SADC region. The routine activities that follow include scheduling, settlements, monitoring
of the quality of supply and detailed investigations are conducted into inadvertent energy
flows and major power system faults and disturbances [1].
The prices for the bi-lateral energy contracts are negotiated between the buyer and the seller.
The pricing structure for bilateral contracts is diverse with some contracts having capacity
and energy rates which take cognizance of the time of use, peak or off peak. Other contracts
have flat energy rates.
Bilateral agreements provide for the assurance of security of supply but are not flexible to
accommodate varying demand profiles and varying prices. To explore further the benefits
thereof, the sourcing and scheduling of electrical energy closer to the time of dispatch, the
SAPP developed the short-term energy market (STEM) as one option for sourcing and
securing supplies closer to real time dispatch. STEM has been designed to specifically mimic
a real time dispatch.
Figure 10.2 shows the bilateral agreements in force from 2005.
Power Generation in Southern Africa: Energy Trading and the Southern African Power Pool 405
1606
5875
230
1045
868
793
2500
1800
700
770
280
210
950
100
200
96
150
1370
250
100
110
80
0 1000 2000 3000 4000 5000 6000
Eskom-BPC
Eskom-EDM
Eskom-LEC
Eskom-NamPower
Eskom-SEB
Eskom-ZESA
HCB-Eskom
HCB-ZESA
SNEL-Eskom
SNEL-ZESA
ZESCO-Eskom
Energy [GWh] Capacity [MW]
HCB hydro supply: 1,770MW, Eskom thermal supply: 1,706MW
Fig. 10.2 The 2005 Bilateral Contracts in SAPP
10.3.2 The Short-term Energy Market
The goal of standard market design is to establish an efficient and robustly competitive
wholesale electricity marketplace for the benefit of consumers. This could be done through
the development of consistent market mechanisms and efficient price signals for the
procurement and reliable transmission of electricity combined with the assurance of fair and
open access to the transmission system [3]. For the short-term energy market (STEM) design,
the following criteria were used [2,3,4]:
i.) Transmission rights
Long and short-term bilateral contracts between participants were given priority over
STEM contracts for transmission on the SAPP interconnectors. All the STEM contracts
are subject to the transfer constraints as verified by the SAPP Co-ordination Center.
ii.) Security requirements
Participants are required to lodge sufficient security deposit with the Co-ordination Center
before trading commences and separate security is required for each energy contract.
iii.) Settlement
Participants have the full obligation to pay for the energy traded and the associated
energy costs. The settlement amounts are based on the invoices and are payable into
the Co-ordination Center’s clearing account. It is the responsibility of the Participants
(buyers) to ensure that sufficient funds are paid into the clearing account for the Co-
ordination Center to effect payment to the respective Participants (sellers).
Guidelines for Management and Control of Electricity Infrastructure with regard to
Animal Interaction.
10.2.9 Other Completed Projects
The other completed projects include the following:
Completion of the SAPP Pool Plan in 2001. In 2006, the SAPP received a World Bank
grant to review the Pool Plan and the Revised Pool Plan was completed in November
2007.
In 2001, the SAPP received a World Bank grant to conduct a telecommunications study
on how best to link the three control areas. The recommendations of the study were to
use a VSAT solution in the short-term and fiber in the long-term. The SAPP has now
completed the implementation of a VSAT solution and the project has been
commissioned.
Frequency relaxation project was completed in 2003. The SAPP relaxed the operating
frequency from 50 +/-0.05 Hz to 50 +/-0.15 Hz. The new frequency bands were
implemented from January 2003.
10.3 Energy Trading
10.3.1 Bilateral Contracts
Based on the current SAPP Inter-Governmental Memorandum of Understanding, the
general arrangement for electricity trading in the SAPP is for the national power utilities to
engage into long-term and short-term bilateral contracts for the sourcing and consumption
of electrical energy. Thus, the intergovernmental agreements and the bilateral contracts
between the utilities form the basis and foundation for cross border electricity trading in the
SADC region. The routine activities that follow include scheduling, settlements, monitoring
of the quality of supply and detailed investigations are conducted into inadvertent energy
flows and major power system faults and disturbances [1].
The prices for the bi-lateral energy contracts are negotiated between the buyer and the seller.
The pricing structure for bilateral contracts is diverse with some contracts having capacity
and energy rates which take cognizance of the time of use, peak or off peak. Other contracts
have flat energy rates.
Bilateral agreements provide for the assurance of security of supply but are not flexible to
accommodate varying demand profiles and varying prices. To explore further the benefits
thereof, the sourcing and scheduling of electrical energy closer to the time of dispatch, the
SAPP developed the short-term energy market (STEM) as one option for sourcing and
securing supplies closer to real time dispatch. STEM has been designed to specifically mimic
a real time dispatch.
Figure 10.2 shows the bilateral agreements in force from 2005.
Electricity Infrastructures in the Global Marketplace406
-
1,000
2,000
3,000
4,000
2005 2006
GWh
Supply Demand Energy Traded
Fig. 10.3 Energy Trading Summary
(1 April to 31 March of the following year)
-
700
1,400
2,100
2,800
3,500
2005 2006
Energy Traded [GWh]
Monetary Value [US$x1000]
Fig. 10.4 Energy trade versus monetary value
(1 April to 31 March of following year)
The development of the competitive electricity market started in January 2004 when an
Agreement between the Government of Norway and SAPP provided SAPP with a grant to
the amount of NOK 35 million for this purpose. The competitive market will replace STEM.
STEM was developed as a precursor to a full competitive market. The experience derived
from STEM operations has formed the basis for the development and implementation of a
full competitive electricity market for the SADC region [5,6].
iv.) Currency of trade
The choice of currency is either the United States Dollar or the South Africa Rand
dependent on the agreement between the buyer and the seller.
v.) Allocation method
The allocation of available quantities based on the available transmission capability is
by fair competitive bidding with equal sharing of available quantities to the buyers.
vi.) Firm contracts
Once contracted, the quantities and the prices are firm and fixed. There are currently
three energy contracts that have been promoted in the STEM as follows; monthly,
weekly and daily contracts. Daily contracts have been most consistent and have been
greatly used by participants.
Table 10.2 summarizes the daily trading routine in the STEM. It is important to note that the
period for submission of bids and offers close simultaneously.
At 08:30 HRS, a day before trading – The Center publishes the exchange rate
between the United States Dollar and the South African Rand.
Any time before 09:00 HRS, a day before trading - Participants submit bids
and offers to the Co-ordination Center for future daily contracts.
At 10:00 HRS, a day before trading - The market closes and the Co-ordination
Center matches bids and offers for any future trading day;
At 14:00 HRS, a day before trading - The Co-ordination Center publishes the
results to all Participants.
At 15:00 HRS, a day before trading – Participants may enter into post-STEM
contracts and inform the Coordination Center accordingly.
Table 10.2 Daily Trading Routine in the STEM
For the period from 1 April 2005 to 31 March 2006, corresponding to the SAPP Coordination
Center fiscal period, the power supply on the short-term energy market (STEM) was 423-
GWh and the corresponding demand was 3,700-GWh. The traded energy was 178-GWh at
an average cost of 0.96 USc/kWh. For a similar period from 1 April 2006 to 31 March 2007,
supply and demand figures were 377-GWh and 1,118-GWh, respectively. The energy traded
was 226-GWh at an average cost of 1.38 KWh/kWh. This period recorded an increase in the
cost of energy, but with a much lower power demand [see Figure 10.3].
The total energy sales for the period from 1 April 2005 to 31 March 2006 was US$2.2 million
and the corresponding sales for the period from 1 April 2006 to 31 March 2007 was US$3.1
million, Figure 10.4. Though the same quantity of energy was traded during both periods, it
is seen that the cost of energy in the 2006 period had increased due to reduced power supply
on the market.
Power Generation in Southern Africa: Energy Trading and the Southern African Power Pool 407
-
1,000
2,000
3,000
4,000
2005 2006
GWh
Supply Demand Energy Traded
Fig. 10.3 Energy Trading Summary
(1 April to 31 March of the following year)
-
700
1,400
2,100
2,800
3,500
2005 2006
Energy Traded [GWh]
Monetary Value [US$x1000]
Fig. 10.4 Energy trade versus monetary value
(1 April to 31 March of following year)
The development of the competitive electricity market started in January 2004 when an
Agreement between the Government of Norway and SAPP provided SAPP with a grant to
the amount of NOK 35 million for this purpose. The competitive market will replace STEM.
STEM was developed as a precursor to a full competitive market. The experience derived
from STEM operations has formed the basis for the development and implementation of a
full competitive electricity market for the SADC region [5,6].
iv.) Currency of trade
The choice of currency is either the United States Dollar or the South Africa Rand
dependent on the agreement between the buyer and the seller.
v.) Allocation method
The allocation of available quantities based on the available transmission capability is
by fair competitive bidding with equal sharing of available quantities to the buyers.
vi.) Firm contracts
Once contracted, the quantities and the prices are firm and fixed. There are currently
three energy contracts that have been promoted in the STEM as follows; monthly,
weekly and daily contracts. Daily contracts have been most consistent and have been
greatly used by participants.
Table 10.2 summarizes the daily trading routine in the STEM. It is important to note that the
period for submission of bids and offers close simultaneously.
At 08:30 HRS, a day before trading – The Center publishes the exchange rate
between the United States Dollar and the South African Rand.
Any time before 09:00 HRS, a day before trading - Participants submit bids
and offers to the Co-ordination Center for future daily contracts.
At 10:00 HRS, a day before trading - The market closes and the Co-ordination
Center matches bids and offers for any future trading day;
At 14:00 HRS, a day before trading - The Co-ordination Center publishes the
results to all Participants.
At 15:00 HRS, a day before trading – Participants may enter into post-STEM
contracts and inform the Coordination Center accordingly.
Table 10.2 Daily Trading Routine in the STEM
For the period from 1 April 2005 to 31 March 2006, corresponding to the SAPP Coordination
Center fiscal period, the power supply on the short-term energy market (STEM) was 423-
GWh and the corresponding demand was 3,700-GWh. The traded energy was 178-GWh at
an average cost of 0.96 USc/kWh. For a similar period from 1 April 2006 to 31 March 2007,
supply and demand figures were 377-GWh and 1,118-GWh, respectively. The energy traded
was 226-GWh at an average cost of 1.38 KWh/kWh. This period recorded an increase in the
cost of energy, but with a much lower power demand [see Figure 10.3].
The total energy sales for the period from 1 April 2005 to 31 March 2006 was US$2.2 million
and the corresponding sales for the period from 1 April 2006 to 31 March 2007 was US$3.1
million, Figure 10.4. Though the same quantity of energy was traded during both periods, it
is seen that the cost of energy in the 2006 period had increased due to reduced power supply
on the market.