Cutting edge nanotechnology_2 pot
Bạn đang xem bản rút gọn của tài liệu. Xem và tải ngay bản đầy đủ của tài liệu tại đây (20.87 MB, 140 trang )
IntersublevelRelaxationPropertiesofSelf-AssembledInAs/GaAsQuantumDoteterostructures 305
Intersublevel Relaxation Properties of Self-Assembled InAs/GaAs
QuantumDotHeterostructures
1Jiunn-ChyLeeandYa-FenWu
X
Intersublevel Relaxation Properties of Self-
Assembled InAs/GaAs Quantum Dot
Heterostructures
1
Jiunn-Chyi Lee and
2
Ya-Fen Wu
1
Electrical Engineering, Technology and Science Institute of Northern Taiwan
2
Electronic Engineering, Ming Chi University of Technology
Taiwan
1. Introduction
The requirement for high performance optoelectronic devices has spurred much
experimental effort directed toward understanding and exploiting the electronic and optical
properties of quantum dots (QDs). The relaxation dynamics in the zero-dimensional QD
systems is expected to differ qualitatively from higher-dimensional systems, since the
density of states is a series of δ-functions. The limited number of states available for carriers
impairs carrier relaxation toward the ground state (phonon bottleneck effect) (Benisty et al.,
1991; Benisty, 1995; Hai et al., 2006). In addition, the finite degeneracy of each QD state leads
already to state filling effects when few carriers populate the lowest dot states. Both effects
possibly result in intersublevel relaxation rates that are comparable to interband
recombination rates and have been used to explain observed photoluminescence (PL) from
excited states of QDs (Bissiri et al., 2001; Smith et al., 2001).
The temperature dependence of PL emissions has been the subject of extensive studies for
clarifying the mechanism of PL quenching processes in a randomly distributed dot structure
(Bafna et al., 2006; Duarte et al., 2003; Polimeni et al., 1999). The PL spectra of QDs typically
show peculiar temperature dependencies. A large temperature induced peak energy
decrease, which is eventually sigmoidal, and a reduction of the PL full width at half
maximum (FWHM) in mid-temperature range, have been reported (Dawson et al., 2005;
Polimeni et al., 1999). The phenomenon is commonly attributed to effectively redistributed
carriers in QDs through the channel of the wetting layer based on a model of the
temperature driven carrier dynamics which takes into account the QD size distribution,
random population, and carrier capture relaxation and retrapping (Nee et al., 2005; Nee et
al., 2006). The physics of carrier relaxing between intersublevels in various QD systems has
been extensively studied. However, the electron-phonon scattering effect on QD system is
neglected and only considered in the high-temperature range to explain the increase of
FWHM (Dawson et al., 2005; Nee et al., 2005; Nee et al., 2006), and the effect of dot size,
density, and uniformity on this mechanism is still not fully understood (Dawson et al., 2005;
Duarte et al., 2003).
14
CuttingEdgeNanotechnology306
In this chapter, we studied the phonon-assisted transferring of carriers in InAs QD system
via an analysis of PL data in the temperature range from 15 K to 280 K. Intersublevel
relaxation properties and thermally-induced activation of excitons in QD system are
simulated using a rate-equation model based on carrier relaxation and thermal emission in
the quantum dot system. The dot-size distribution, thermal escaping and retrapping, and
electron-phonon scattering, are all considered in the model. Correlation between carrier
redistribution and electron-phonon scattering effects is quantitatively discussed to explain
the different temperature-dependent behaviors of the PL spectra measured from samples
with different dot size distribution. Moreover, the phonon-bottleneck effect on temperature
dependent PL spectra is also discussed to illustrate the significance of phonon-assisted effect
on QD system. According to the simulation results, intersublevel relaxation lifetimes of QD
samples are estimated under different temperatures and the carrier transferring mechanisms
in the QD system are discussed in detail. The theoretical analysis confirms that the thermal
redistribution of carriers and the electron phonon scattering affect the temperature
dependent PL spectra simultaneously.
2. Sample Preparation
An easy way to fabricate zero-dimensional InAs QDs is to grow the InAs on GaAs in the S-K
mode (Sanguinetti et al, 2002; Schmidt et al., 1996).
In the S-K transformation, growth is
initially two-dimensional, until the film reaches a strain dependent critical thickness. Above
the critical deposition thickness of InAs on GaAs substrate, due to the 7% lattice mismatch
between GaAs and InAs, the two-dimensional growth changes into a three-dimensional one.
Coherent InAs islands with lateral extensions of 10-20 nm are spontaneously formed on top
of the two-dimensional layer, called the wetting layer. It was traditionally believed that
islands formed in S-K growth are dislocated. However, the experiment on InAs/GaAs (001)
has demonstrated the formation of three-dimensional coherently strained islands.
The self-assembled InAs QD samples used in the work were created by using a metal-
organic chemical vapor epitaxy system (MOCVD) system. The substrates were (100) 2°-tilted
toward (111)A Si-doped GaAs. The heterostructures included a 400 nm Si-doped GaAs
buffer layer, an InAs QD active region of 3 monolayers (MLs) and a 100 nm undoped GaAs
capping layer. The growth rate was 0.1 MLs and the V/III ratio during the growth of InAs
layer was 6.36 for samples A, B and 3 for sample C. The growth interruption (GI) introduced
during dot formation for samples A, B, and C were set to 6 s, 15 s and 15 s, respectively. In
order to investigate the average dot size distribution and shape, images of these samples
were taken by high-resolution transmission electron microscopy (HRTEM) operating at 200
keV. PL measurements were carried out under the excitation of a continuous-wave He-Cd
laser emitting at 325 nm, with the incident power intensity being 20 mW. The samples were
mounted in a closed cycle He cryostat, which allowed measurements in a temperature (T)
range from 15 K to 280 K. The luminescence was dispersed in a 0.5 meter monochromator,
and detected with a Ge photodiode using a standard lock-in technique.
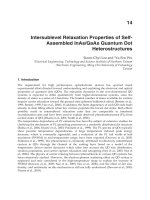
Figure 1 shows the plan-view TEM images for samples A, B and C. The quantitative data on
size distribution of the InAs QD samples have been obtained from the TEM images, the
average dot density of samples A, B and C are 2.4×10
10
cm
–2
, 1.2×10
10
cm
–2
and 1.4×10
10
cm
–2
,
respectively, and the average dot diameters of the three samples are 16 nm, 19 nm and 20
nm. Generally, the application of GI time results in the formation of larger sized QDs with a
regular size distribution (Tarasov et al., 2000), as can be seen from Fig. 1(a) and Fig. 1(b).
Besides, decreasing the V/III ratio during growth can increase the indium adatom surface
diffusivity in the wetting layer and hence increasing the two-dimensional island size in the
wetting layer. A layer composed of larger two-dimensional islands will have a more
uniform strain distribution and lead to a more uniform island distribution on top of the
wetting layer (Solomon et al., 1995). The highest uniformity was exhibited for sample C as
can be seen in Fig. 1(c).
Fig. 1. Plan-view TEM images of the InAs quantum dots of (a) sample A, (b) sample B, and
(c) sample C
3. Results and Discussions
3.1 Photoluminescence Characterization
The measured PL spectra at temperature T=15 K for the samples are shown in Fig. 2. All of
these spectra exhibit a pronounced double-like feature and can be decomposed into two
Gaussian peaks; we attribute these two main spectral features of the QDs to the ground state
and excited state emissions. Sample A possesses the largest ground state and excited state
transmission energies, i.e., 1.05 eV and 1.11 eV; and the values are 1.01 eV, 1.09 eV and 1.01
eV, 1.08 eV for sample B and sample C, respectively. Considering the quantum-size effect on
the peak energies, we believe that the excitons localized in smaller dots will contribute to
higher peak energies (Cheng et al., 1998). As a result, the highest peak energies of sample A
(GI=6s) is attributed to the smallest size of the QDs in the three samples. Similarly, the peak
energies for sample B and sample C are almost the same because their dot sizes are similar.
One remarkable feature in Fig. 2 is the obvious difference of the excited state peak intensities
among the samples. The strongest excited state peak intensity of sample A reveals that more
carriers exists in this state, and the much weaker excited state emissions in PL intensity of
sample C suggests that the carriers relax rapidly into the ground state. In other words, it has
shorter relaxation lifetimes than those of sample A and sample B. It indicates for sample C a
restricted phonon bottleneck effect (Benisty et al., 1991; Bockelmann et al. 1990). This can be
understood in terms of an improved confinement of InAs excitons and a lower defect
density in sample C due to having best uniformity among the three samples.
The values of FWHM of ground state and excited state emissions are 27.1 meV and 88.3 meV
for sample A, 26.8 meV and 79.6 meV for sample B, and for sample C they are 23.3 meV and
55.27 meV, respectively. The PL linewidth is mainly determined by the inhomogeneous
broadening of InAs islands resulted from size fluctuation of the dot size at low temperature
(Xu et al.,1996), the measured data for sample C are consistent with its better size uniformity.
IntersublevelRelaxationPropertiesofSelf-AssembledInAs/GaAsQuantumDoteterostructures 307
In this chapter, we studied the phonon-assisted transferring of carriers in InAs QD system
via an analysis of PL data in the temperature range from 15 K to 280 K. Intersublevel
relaxation properties and thermally-induced activation of excitons in QD system are
simulated using a rate-equation model based on carrier relaxation and thermal emission in
the quantum dot system. The dot-size distribution, thermal escaping and retrapping, and
electron-phonon scattering, are all considered in the model. Correlation between carrier
redistribution and electron-phonon scattering effects is quantitatively discussed to explain
the different temperature-dependent behaviors of the PL spectra measured from samples
with different dot size distribution. Moreover, the phonon-bottleneck effect on temperature
dependent PL spectra is also discussed to illustrate the significance of phonon-assisted effect
on QD system. According to the simulation results, intersublevel relaxation lifetimes of QD
samples are estimated under different temperatures and the carrier transferring mechanisms
in the QD system are discussed in detail. The theoretical analysis confirms that the thermal
redistribution of carriers and the electron phonon scattering affect the temperature
dependent PL spectra simultaneously.
2. Sample Preparation
An easy way to fabricate zero-dimensional InAs QDs is to grow the InAs on GaAs in the S-K
mode (Sanguinetti et al, 2002; Schmidt et al., 1996).
In the S-K transformation, growth is
initially two-dimensional, until the film reaches a strain dependent critical thickness. Above
the critical deposition thickness of InAs on GaAs substrate, due to the 7% lattice mismatch
between GaAs and InAs, the two-dimensional growth changes into a three-dimensional one.
Coherent InAs islands with lateral extensions of 10-20 nm are spontaneously formed on top
of the two-dimensional layer, called the wetting layer. It was traditionally believed that
islands formed in S-K growth are dislocated. However, the experiment on InAs/GaAs (001)
has demonstrated the formation of three-dimensional coherently strained islands.
The self-assembled InAs QD samples used in the work were created by using a metal-
organic chemical vapor epitaxy system (MOCVD) system. The substrates were (100) 2°-tilted
toward (111)A Si-doped GaAs. The heterostructures included a 400 nm Si-doped GaAs
buffer layer, an InAs QD active region of 3 monolayers (MLs) and a 100 nm undoped GaAs
capping layer. The growth rate was 0.1 MLs and the V/III ratio during the growth of InAs
layer was 6.36 for samples A, B and 3 for sample C. The growth interruption (GI) introduced
during dot formation for samples A, B, and C were set to 6 s, 15 s and 15 s, respectively. In
order to investigate the average dot size distribution and shape, images of these samples
were taken by high-resolution transmission electron microscopy (HRTEM) operating at 200
keV. PL measurements were carried out under the excitation of a continuous-wave He-Cd
laser emitting at 325 nm, with the incident power intensity being 20 mW. The samples were
mounted in a closed cycle He cryostat, which allowed measurements in a temperature (T)
range from 15 K to 280 K. The luminescence was dispersed in a 0.5 meter monochromator,
and detected with a Ge photodiode using a standard lock-in technique.
Figure 1 shows the plan-view TEM images for samples A, B and C. The quantitative data on
size distribution of the InAs QD samples have been obtained from the TEM images, the
average dot density of samples A, B and C are 2.4×10
10
cm
–2
, 1.2×10
10
cm
–2
and 1.4×10
10
cm
–2
,
respectively, and the average dot diameters of the three samples are 16 nm, 19 nm and 20
nm. Generally, the application of GI time results in the formation of larger sized QDs with a
regular size distribution (Tarasov et al., 2000), as can be seen from Fig. 1(a) and Fig. 1(b).
Besides, decreasing the V/III ratio during growth can increase the indium adatom surface
diffusivity in the wetting layer and hence increasing the two-dimensional island size in the
wetting layer. A layer composed of larger two-dimensional islands will have a more
uniform strain distribution and lead to a more uniform island distribution on top of the
wetting layer (Solomon et al., 1995). The highest uniformity was exhibited for sample C as
can be seen in Fig. 1(c).
Fig. 1. Plan-view TEM images of the InAs quantum dots of (a) sample A, (b) sample B, and
(c) sample C
3. Results and Discussions
3.1 Photoluminescence Characterization
The measured PL spectra at temperature T=15 K for the samples are shown in Fig. 2. All of
these spectra exhibit a pronounced double-like feature and can be decomposed into two
Gaussian peaks; we attribute these two main spectral features of the QDs to the ground state
and excited state emissions. Sample A possesses the largest ground state and excited state
transmission energies, i.e., 1.05 eV and 1.11 eV; and the values are 1.01 eV, 1.09 eV and 1.01
eV, 1.08 eV for sample B and sample C, respectively. Considering the quantum-size effect on
the peak energies, we believe that the excitons localized in smaller dots will contribute to
higher peak energies (Cheng et al., 1998). As a result, the highest peak energies of sample A
(GI=6s) is attributed to the smallest size of the QDs in the three samples. Similarly, the peak
energies for sample B and sample C are almost the same because their dot sizes are similar.
One remarkable feature in Fig. 2 is the obvious difference of the excited state peak intensities
among the samples. The strongest excited state peak intensity of sample A reveals that more
carriers exists in this state, and the much weaker excited state emissions in PL intensity of
sample C suggests that the carriers relax rapidly into the ground state. In other words, it has
shorter relaxation lifetimes than those of sample A and sample B. It indicates for sample C a
restricted phonon bottleneck effect (Benisty et al., 1991; Bockelmann et al. 1990). This can be
understood in terms of an improved confinement of InAs excitons and a lower defect
density in sample C due to having best uniformity among the three samples.
The values of FWHM of ground state and excited state emissions are 27.1 meV and 88.3 meV
for sample A, 26.8 meV and 79.6 meV for sample B, and for sample C they are 23.3 meV and
55.27 meV, respectively. The PL linewidth is mainly determined by the inhomogeneous
broadening of InAs islands resulted from size fluctuation of the dot size at low temperature
(Xu et al.,1996), the measured data for sample C are consistent with its better size uniformity.
CuttingEdgeNanotechnology308
Fig. 2. Normalized PL spectra of sample A, sample B, and sample C recorded at T=15 K. The
excitation energy is 20 mW
The two-dimensional contour plots in Fig. 3 display the measured temperature dependent
PL intensities. The distributions of emission energy from the QD systems are clearly seen
from the figures. Sample A has the widest emission band, luminescence from the excited
state is apparent. The narrowest energy spreading is the contour shown for sample C. The
PL intensity of excited state is too small to be observable and the PL spectra are concentrated
in a narrow linewidth. Since the observation of PL from excited states transition at low
Fig. 3. Two-dimensional contour plots of the PL intensities for sample A, sample B, and
sample C, measured in the temperature range from 15 to 280 K
0.94 1.02 1.10 1.18 1.26
0.0
0.2
0.4
0.6
0.8
1.0
PL Intensity (a.u.)
Energy (eV)
sample A
sample B
sample C
20 70 120 170 220 270
1.22
1.15
1.08
1.01
0.94
sample A
Energy (eV)
Temperature (K)
20 70 120 170 220 270
1.22
1.15
1.08
1.01
0.94
sample B
Energy (eV)
Temperature (K)
20 70 120 170 220 270
1.22
1.15
1.08
1.01
0.94
sample C
Energy (eV)
Temperature (K)
0
0.1250
0.2500
0.3750
0.5000
0.6250
0.7500
0.8750
1.000
excitation density is explained by the phonon bottleneck effect in the QD system, we
attribute the inconspicuous excited state emission of sample C to the partially relaxed
phonon bottleneck.
Figure 4(a) displays the temperature dependent FWHMs of PL spectra of the samples, both
the ground state and the excited state are included. Observing the FWHMs of sample A and
sample B, they stay constant up to 75 K and 100 K. As the temperature further increases,
anomalous reduction appeared within the temperature range from 100 K to 200 K. The
FWHMs decrease and the minimal FWHMs of excited state are found to be around 69 meV
at 200 K for both samples. When the temperature is higher than 200 K, the PL linewidths
start to increase with temperature. At low temperature, carriers are captured randomly into
the QDs. With increasing temperature, carriers are thermally activated outside the dots with
shallow energy minima into the wetting layer then retrapped into another dot. Carrier
hopping among dots favors a drift of carriers towards the dots with lower energy emissions
and leading to the decrease of FWHMs. As temperature exceeds 200 K, the FWHMs increase
with temperature because the electron-phonon scattering becomes important. Figure 4(b)
shows the PL excited state peak energy with increasing temperature, and the corresponding
values of InAs band gap using Varshni law with the InAs parameters are also shown. As can
be seen in the figure, the redshift of emission peaks for sample A and B are faster than that
of the InAs bulk band gap at T=100-200 K, coincided with the carrier hopping mechanism
described above.
Significantly different temperature dependent FWHMs are observed for sample C. The
broadening of the PL spectra exhibits no reduction as the temperature increases, but the
peak energy shifts with a slight sigmoid dependence on temperature. Thanks to the lowest
PL intensity of excited state, fewer carriers exist in the state, and the thermal redistribution
of carriers via wetting layer is indistinct. The slightly quick redshift of peak energy is
consistent with the weak redistribution effect, whereas the increase of linewidth with
temperature implies that the electron-phonon scattering is dominant in the PL spectra.
Therefore, to analyze the carriers transferring mechanisms, we investigate a model for
carrier dynamics in QD system under optical excitation which includes the thermal
redistribution effect and the electron-phonon scattering effect.
Fig. 4. Experimental values of the temperature dependent (a) FWHM and (b) peak energy of
the excited state of sample A, sample B, and sample C
0 50 100 150 200 250 300
55
65
75
85
95
105
115
FWHM (meV)
Temperature (K)
sample A
sample B
sample C
(a)
0 50 100 150 200 250 300
1.00
1.03
1.06
1.09
1.12
Temperature (K)
Peak Energy (eV)
sample A
sample B
sample C
(b)
InAs bulk
Temperature (K)
IntersublevelRelaxationPropertiesofSelf-AssembledInAs/GaAsQuantumDoteterostructures 309
Fig. 2. Normalized PL spectra of sample A, sample B, and sample C recorded at T=15 K. The
excitation energy is 20 mW
The two-dimensional contour plots in Fig. 3 display the measured temperature dependent
PL intensities. The distributions of emission energy from the QD systems are clearly seen
from the figures. Sample A has the widest emission band, luminescence from the excited
state is apparent. The narrowest energy spreading is the contour shown for sample C. The
PL intensity of excited state is too small to be observable and the PL spectra are concentrated
in a narrow linewidth. Since the observation of PL from excited states transition at low
Fig. 3. Two-dimensional contour plots of the PL intensities for sample A, sample B, and
sample C, measured in the temperature range from 15 to 280 K
0.94 1.02 1.10 1.18 1.26
0.0
0.2
0.4
0.6
0.8
1.0
PL Intensity (a.u.)
Energy (eV)
sample A
sample B
sample C
20 70 120 170 220 270
1.22
1.15
1.08
1.01
0.94
sample A
Energy (eV)
Temperature (K)
20 70 120 170 220 270
1.22
1.15
1.08
1.01
0.94
sample B
Energy (eV)
Temperature (K)
20 70 120 170 220 270
1.22
1.15
1.08
1.01
0.94
sample C
Energy (eV)
Temperature (K)
0
0.1250
0.2500
0.3750
0.5000
0.6250
0.7500
0.8750
1.000
excitation density is explained by the phonon bottleneck effect in the QD system, we
attribute the inconspicuous excited state emission of sample C to the partially relaxed
phonon bottleneck.
Figure 4(a) displays the temperature dependent FWHMs of PL spectra of the samples, both
the ground state and the excited state are included. Observing the FWHMs of sample A and
sample B, they stay constant up to 75 K and 100 K. As the temperature further increases,
anomalous reduction appeared within the temperature range from 100 K to 200 K. The
FWHMs decrease and the minimal FWHMs of excited state are found to be around 69 meV
at 200 K for both samples. When the temperature is higher than 200 K, the PL linewidths
start to increase with temperature. At low temperature, carriers are captured randomly into
the QDs. With increasing temperature, carriers are thermally activated outside the dots with
shallow energy minima into the wetting layer then retrapped into another dot. Carrier
hopping among dots favors a drift of carriers towards the dots with lower energy emissions
and leading to the decrease of FWHMs. As temperature exceeds 200 K, the FWHMs increase
with temperature because the electron-phonon scattering becomes important. Figure 4(b)
shows the PL excited state peak energy with increasing temperature, and the corresponding
values of InAs band gap using Varshni law with the InAs parameters are also shown. As can
be seen in the figure, the redshift of emission peaks for sample A and B are faster than that
of the InAs bulk band gap at T=100-200 K, coincided with the carrier hopping mechanism
described above.
Significantly different temperature dependent FWHMs are observed for sample C. The
broadening of the PL spectra exhibits no reduction as the temperature increases, but the
peak energy shifts with a slight sigmoid dependence on temperature. Thanks to the lowest
PL intensity of excited state, fewer carriers exist in the state, and the thermal redistribution
of carriers via wetting layer is indistinct. The slightly quick redshift of peak energy is
consistent with the weak redistribution effect, whereas the increase of linewidth with
temperature implies that the electron-phonon scattering is dominant in the PL spectra.
Therefore, to analyze the carriers transferring mechanisms, we investigate a model for
carrier dynamics in QD system under optical excitation which includes the thermal
redistribution effect and the electron-phonon scattering effect.
Fig. 4. Experimental values of the temperature dependent (a) FWHM and (b) peak energy of
the excited state of sample A, sample B, and sample C
0 50 100 150 200 250 300
55
65
75
85
95
105
115
FWHM (meV)
Temperature (K)
sample A
sample B
sample C
(a)
0 50 100 150 200 250 300
1.00
1.03
1.06
1.09
1.12
Temperature (K)
Peak Energy (eV)
sample A
sample B
sample C
(b)
InAs bulk
Temperature (K)
CuttingEdgeNanotechnology310
3.2 Theoretical Model
The possible optical transitions in a single QD consist of a series of δ function lines, whose
energy positions depend on the particular three-dimensionality confined levels. In a real QD
ensemble each individual dots are slightly different in size, shape, strain state, etc. The main
impact of size fluctuations is a variation in the energy position of electronic levels, and
subsequently to an inhomogeneous broadening of the ensemble properties. It is reasonable
to assume a Gaussian distribution for it (Chang et al., 1999).
To analyze the carrier dynamics of the QD system, we develop a theoretical model that takes
into account the QDs size distribution, the state filling effect, and all of the important carrier
transport processes, including the carrier capture and relaxation, thermal emission and
retrapping, and radiative and nonradiative recombination. Referring to the model of the QD
system described schematically in Fig. 5, four discrete levels of electron (labeled as i, i=1-4)
are considered in the system, namely, the ground state (E
1
), the excited state (E
2
), the
wetting layer (E
3
), and the GaAs barrier (E
4
). Since the process of quantum dot population is
intrinsically random, the density of states for both ground state [n
1
(E)] and excited state
[n
2
(E)] are assumed to be proportional to their Gaussian distributions, with parameters
chosen to match the peak energies and linewidths of the lowest temperature PL spectra (Lee
et al., 1997; Yang et al., 1997) and taking spin into consideration, then
( )
( ) ( )
[ ]
dieifi
nidEEnEndEEn ××∝+=
∫∫
2
,
(1)
where i=1, 2; n
if
and n
ie
are the filled and empty energy states of the i-th level, respectively,
and n
d
is the dot density of the sample.
The carrier dynamics taken into account in this model are described as follows. First, the
coupling among those four carrier reservoirs is treated as a relaxation ladder process from
each energy level to its lower level neighbor. Carriers are injected from the GaAs barrier into
the wetting layer at rate g, from where they are captured into the excited state of QDs within
a capture time τ
32
. Further on, carriers in the excited state relax to the ground state in a time
of τ
21
or radiatively recombine. The relaxation lifetime of one electron in the i-th level (τ
i,i-1
) is
proportional to the filling ratio of the (i−1)-th level (f
i−1
), and expressed as (Mukai et al., 1996)
Fig. 5. Schematic representation of the processes taken into account in the rate equation
model
GaAs barrier (E
4
)
wetting layer (E
3
)
n
3
ground state (E
1
)
n
1
(E)
excited state (E
2
)
n
2
(E)
g
τ
32
τ
23
τ
34
τ
rad
τ
rad
τ
nrad
τ
21
τ
12
( )
1
10,1,1
1
−
−−−
−×=
iiii,i
fττ
, i= 2, 3,
(2)
where τ
i,i-1,0
is the intrinsic relaxation lifetime.
Secondly, thermal emission of the carriers toward an adjacent higher energy level arises
when the temperature is sufficiently high. The coefficients corresponding to emitting from
the ground state to the excited state, the excited state to the wetting layer, and the wetting
layer to the GaAs barrier are given by τ
12
, τ
23
, and τ
34
, respectively. In QD systems, the
thermal emission and retrapping of carriers in the excited state via the wetting layer is a
typical explanation for the unusual decrease of PL linewidth in the mid-temperature range
(Lobo et al., 1999; Polimeni et al., 1999; Giorgi et al., 2001). We express the thermal emission
time of the i-th level as τ
i,i+1
, and
( )
[ ]
kTEEττ
iiiii,i
−×=
+++ 10,1,1
exp
, i=1, 2, 3,
(3)
where τ
i,i+1,0
is the intrinsic thermal emission lifetime of level i. Since the peak interval
between the ground state and the excited state is much larger than the value of kT, the
thermal emission from ground state to excited state is neglected in our model.
The third type of carrier dynamics considered in this system is the radiative recombination.
We have neglected any recombination from the second excited state of the dots, since no PL
is observed at energies possible for the second excited state, and assumed that only two
discrete electron levels exist inside a quantum dot, i.e., the ground state and the first excited
state. The radiative recombination lifetime τ
rad
is assumed to be the same for both of the
states in all of the QDs and is constant with respect to T.
The system under steady-state conditions is then characterized by the following equations:
(Lee et al., 2008; Sanguinetti et al., 1999; Wu et al., 2008)
( )
( )
( )
0
3
34
3
23
2
2
2
32
33
=−−+×−=
∫∫
nrad
f
e
τ
n
τ
n
dE
τ
En
dE
En
En
τ
n
g
dt
dn
,
(4)
( )
( )
( )
( )
( )
( )
( )
( )
( )
( )
( )
0
2
23
2
2
2
12
1
1
1
21
2
2
2
32
3
2
=−−×+×−×=
rad
ff
e
f
e
f
e
f
τ
En
τ
En
En
En
τ
En
En
En
τ
En
En
En
τ
n
dt
Edn
,
(5)
( ) ( )
( )
( )
( )
( )
( )
( )
0
1
2
2
12
1
1
1
21
21
=−×−×=
rad
f
e
f
e
ff
τ
En
En
En
τ
En
En
En
τ
En
dt
Edn
.
(6)
The last term in (4) is the nonradiative loss of excitons in wetting layer, and τ
nrad
is the
nonradiative recombination lifetime. The state filling effect is essentially significant in the
QD system because of the reduced density of states and should be taken into account. Prior
to the description of the simulation process, we must discuss the parameters used in the
model. To obtain τ
rad
used in our model, we estimate the intrinsic exciton lifetime in QDs
(τ
QD
) at low temperature in terms of the exciton lifetime in a corresponding quantum well
(τ
QW
) by (Malik et al., 2001)
IntersublevelRelaxationPropertiesofSelf-AssembledInAs/GaAsQuantumDoteterostructures 311
3.2 Theoretical Model
The possible optical transitions in a single QD consist of a series of δ function lines, whose
energy positions depend on the particular three-dimensionality confined levels. In a real QD
ensemble each individual dots are slightly different in size, shape, strain state, etc. The main
impact of size fluctuations is a variation in the energy position of electronic levels, and
subsequently to an inhomogeneous broadening of the ensemble properties. It is reasonable
to assume a Gaussian distribution for it (Chang et al., 1999).
To analyze the carrier dynamics of the QD system, we develop a theoretical model that takes
into account the QDs size distribution, the state filling effect, and all of the important carrier
transport processes, including the carrier capture and relaxation, thermal emission and
retrapping, and radiative and nonradiative recombination. Referring to the model of the QD
system described schematically in Fig. 5, four discrete levels of electron (labeled as i, i=1-4)
are considered in the system, namely, the ground state (E
1
), the excited state (E
2
), the
wetting layer (E
3
), and the GaAs barrier (E
4
). Since the process of quantum dot population is
intrinsically random, the density of states for both ground state [n
1
(E)] and excited state
[n
2
(E)] are assumed to be proportional to their Gaussian distributions, with parameters
chosen to match the peak energies and linewidths of the lowest temperature PL spectra (Lee
et al., 1997; Yang et al., 1997) and taking spin into consideration, then
( )
( ) ( )
[ ]
dieifi
nidEEnEndEEn ××∝+=
∫∫
2
,
(1)
where i=1, 2; n
if
and n
ie
are the filled and empty energy states of the i-th level, respectively,
and n
d
is the dot density of the sample.
The carrier dynamics taken into account in this model are described as follows. First, the
coupling among those four carrier reservoirs is treated as a relaxation ladder process from
each energy level to its lower level neighbor. Carriers are injected from the GaAs barrier into
the wetting layer at rate g, from where they are captured into the excited state of QDs within
a capture time τ
32
. Further on, carriers in the excited state relax to the ground state in a time
of τ
21
or radiatively recombine. The relaxation lifetime of one electron in the i-th level (τ
i,i-1
) is
proportional to the filling ratio of the (i−1)-th level (f
i−1
), and expressed as (Mukai et al., 1996)
Fig. 5. Schematic representation of the processes taken into account in the rate equation
model
GaAs barrier (E
4
)
wetting layer (E
3
)
n
3
ground state (E
1
)
n
1
(E)
excited state (E
2
)
n
2
(E)
g
τ
32
τ
23
τ
34
τ
rad
τ
rad
τ
nrad
τ
21
τ
12
( )
1
10,1,1
1
−
−−−
−×=
iiii,i
fττ
, i= 2, 3,
(2)
where τ
i,i-1,0
is the intrinsic relaxation lifetime.
Secondly, thermal emission of the carriers toward an adjacent higher energy level arises
when the temperature is sufficiently high. The coefficients corresponding to emitting from
the ground state to the excited state, the excited state to the wetting layer, and the wetting
layer to the GaAs barrier are given by τ
12
, τ
23
, and τ
34
, respectively. In QD systems, the
thermal emission and retrapping of carriers in the excited state via the wetting layer is a
typical explanation for the unusual decrease of PL linewidth in the mid-temperature range
(Lobo et al., 1999; Polimeni et al., 1999; Giorgi et al., 2001). We express the thermal emission
time of the i-th level as τ
i,i+1
, and
( )
[ ]
kTEEττ
iiiii,i
−×=
+++ 10,1,1
exp
, i=1, 2, 3,
(3)
where τ
i,i+1,0
is the intrinsic thermal emission lifetime of level i. Since the peak interval
between the ground state and the excited state is much larger than the value of kT, the
thermal emission from ground state to excited state is neglected in our model.
The third type of carrier dynamics considered in this system is the radiative recombination.
We have neglected any recombination from the second excited state of the dots, since no PL
is observed at energies possible for the second excited state, and assumed that only two
discrete electron levels exist inside a quantum dot, i.e., the ground state and the first excited
state. The radiative recombination lifetime τ
rad
is assumed to be the same for both of the
states in all of the QDs and is constant with respect to T.
The system under steady-state conditions is then characterized by the following equations:
(Lee et al., 2008; Sanguinetti et al., 1999; Wu et al., 2008)
( )
( )
( )
0
3
34
3
23
2
2
2
32
33
=−−+×−=
∫∫
nrad
f
e
τ
n
τ
n
dE
τ
En
dE
En
En
τ
n
g
dt
dn
,
(4)
( )
( )
( )
( )
( )
( )
( )
( )
( )
( )
( )
0
2
23
2
2
2
12
1
1
1
21
2
2
2
32
3
2
=−−×+×−×=
rad
ff
e
f
e
f
e
f
τ
En
τ
En
En
En
τ
En
En
En
τ
En
En
En
τ
n
dt
Edn
,
(5)
( ) ( )
( )
( )
( )
( )
( )
( )
0
1
2
2
12
1
1
1
21
21
=−×−×=
rad
f
e
f
e
ff
τ
En
En
En
τ
En
En
En
τ
En
dt
Edn
.
(6)
The last term in (4) is the nonradiative loss of excitons in wetting layer, and τ
nrad
is the
nonradiative recombination lifetime. The state filling effect is essentially significant in the
QD system because of the reduced density of states and should be taken into account. Prior
to the description of the simulation process, we must discuss the parameters used in the
model. To obtain τ
rad
used in our model, we estimate the intrinsic exciton lifetime in QDs
(τ
QD
) at low temperature in terms of the exciton lifetime in a corresponding quantum well
(τ
QW
) by (Malik et al., 2001)
CuttingEdgeNanotechnology312
2
2
3
=
ex
QWQD
k
η
ττ
.
(7)
Here k
ex
=2πn/λ
PL
is the reciprocal wavelength of the emitted light in the quantum dot
material, with the refractive index of InAs, and η is a measure of the lateral dot size. By
using values of η=(1/15) nm
−1
, n=3.6, λ
PL
=1181 nm, and an exciton lifetime τ
WL
of 25 ps, the
radiative recombination lifetime τ
rad
is calculated to be approximately 500 ps and assumed to
be independent from temperatures.
Rewrite (4), (5) and (6) at T=15 K where the thermal emission can be neglected:
( )
( )
0
3
2
2
32
33
=−×−=
∫
nrad
e
τ
n
dE
En
En
τ
n
g
dt
dn
,
(8)
( )
( )
( )
( )
( )
( )
( )
0
2
1
1
21
2
2
2
32
3
2
=−×−×=
rad
f
e
f
e
f
τ
En
En
En
τ
En
En
En
τ
n
dt
Edn
,
(9)
( )
( )
( )
( )
( )
0
1
1
1
21
21
=−×=
rad
f
e
ff
τ
En
En
En
τ
En
dt
Edn
.
(10)
The detected PL peak intensities of the ground and excited states are proportional to the
values of n
1
and n
2
, respectively, thus τ
21
is determined by using (10). Combining (9) and (10)
and using a value of 30 ps for the carrier capturing lifetime by QDs (Sanguinetti et al., 1999)
yields the value of τ
32
. Following a similar procedure, we get the value of g. Use these
calculated parameters, the rate-equation set (4)-(6) is solved numerically by fitting the
temperature dependent integrated PL intensities of the ground state and the excited state.
Once the carrier distribution functions n
1f
(E) and n
2f
(E) are determined, the PL spectra of
ground state (PL
1
) and excited state (PL
2
) can be expressed as
( ) ( )
radf
τEnβEPL
11
×=
,
(11)
( ) ( )
radf
τEnβEPL
22
×=
,
(12)
where β is a normalizing factor. From (11) and (12), the measured temperature dependent
PL spectra of the ground state and the excited state are reproduced. The parameters used in
our calculation are listed in Table 1.
Sample
g (s
−1
)
τ
32
(ps)
τ
21
(ps)
τ
23
(ps)
τ
34
(ps)
A
1×10
21
14
68
0.17
5.5×10
−6
B 33
C 10
Table 1. Parameters used in the calculations of PL peak intensities and relaxation lifetimes of
the samples
3.3 Electron-Phonon Scattering Effect
The total linewidth of PL emission in QD system can be decomposed into two components:
inhomogeneous and homogeneous. The nature of these two mechanisms is totally different.
Inhomogeneous broadening in the QD system arises from small fluctuations in the QDs
confining size, the alloy composition variations, and the shifts due to strain-field effects
(Seebeck et al., 2005; Zhao et al., 2002). The major contribution to the inhomogeneous
broadening comes from the size variation due to the large confining potentials and the small
volumes. We can express the inhomogeneous broadening lineshape as a Gaussian function
( )
( )
−−
=
2
2
0
0
2
exp
σ
EE
GEG
,
(13)
where G
0
and E
0
are the amplitude and peak energy position, respectively, and σ is the
standard deviation of the distribution.
Homogeneous broadening is mainly due to the exciton-phonon interaction. Both acoustic
and optical phonons are involved in the process (Ortner et al, 2004). The phonon
contribution of the linewidth is proportional to phonon population density. In acoustic
phonon case, such a density increases linearly with the temperature. On the other hand,
optical phonons have a relatively fixed frequency. The number of phonons thermally excited
follows Bose-Einstein statistics. The expression of the total homogeneous linewidth can be
written as following (Christen & Bimberg, 1990)
( )
[ ]
1exp −
+=
Tkω
γ
TγΓ
BLO
LO
AChomo
.
(14)
The first term represents the acoustic phonon contributions with proportionality constant
γ
AC
and the second term represents the optical phonon contributions. γ
LO
is the longitudinal
optical (LO) phonon broadening constant and ħω
LO
is the LO phonon energy. Since the
phonon interactions are the results of lattice vibration, the phonon broadening(denoted as
Γ
phonon
) takes the shape of Lorentzian function (Christen & Bimberg, 1990)
( )
( )
22
0
1
homo
phonon
ΓEE
EΓ
+−
=
,
(15)
where Γ
homo
is the homogeneous linewidth given by (14).
The electron-phonon interaction in QDs and the interaction with the wetting layer
continuum act as additional sources of lineshape broadening (Sanguinetti et al., 1999). In
order to include carrier-phonon interaction into the model, homogeneous energy
broadening has to be considered. In QD systems, all sharp excitonic transition lines at
different energies are homogeneously broadened by phonons at the same time. The total
transition at each energy point is the sum of the contributions of all energy points. Thus the
total lineshape of a transition involving both inhomogeneous and homogeneous broadening
is the convolution of the individual lineshapes. Based on the discussion, the total transition
lineshape of the energy state involving both thermal redistribution and phonon scattering of
IntersublevelRelaxationPropertiesofSelf-AssembledInAs/GaAsQuantumDoteterostructures 313
2
2
3
=
ex
QWQD
k
η
ττ
.
(7)
Here k
ex
=2πn/λ
PL
is the reciprocal wavelength of the emitted light in the quantum dot
material, with the refractive index of InAs, and η is a measure of the lateral dot size. By
using values of η=(1/15) nm
−1
, n=3.6, λ
PL
=1181 nm, and an exciton lifetime τ
WL
of 25 ps, the
radiative recombination lifetime τ
rad
is calculated to be approximately 500 ps and assumed to
be independent from temperatures.
Rewrite (4), (5) and (6) at T=15 K where the thermal emission can be neglected:
( )
( )
0
3
2
2
32
33
=−×−=
∫
nrad
e
τ
n
dE
En
En
τ
n
g
dt
dn
,
(8)
( )
( )
( )
( )
( )
( )
( )
0
2
1
1
21
2
2
2
32
3
2
=−×−×=
rad
f
e
f
e
f
τ
En
En
En
τ
En
En
En
τ
n
dt
Edn
,
(9)
( )
( )
( )
( )
( )
0
1
1
1
21
21
=−×=
rad
f
e
ff
τ
En
En
En
τ
En
dt
Edn
.
(10)
The detected PL peak intensities of the ground and excited states are proportional to the
values of n
1
and n
2
, respectively, thus τ
21
is determined by using (10). Combining (9) and (10)
and using a value of 30 ps for the carrier capturing lifetime by QDs (Sanguinetti et al., 1999)
yields the value of τ
32
. Following a similar procedure, we get the value of g. Use these
calculated parameters, the rate-equation set (4)-(6) is solved numerically by fitting the
temperature dependent integrated PL intensities of the ground state and the excited state.
Once the carrier distribution functions n
1f
(E) and n
2f
(E) are determined, the PL spectra of
ground state (PL
1
) and excited state (PL
2
) can be expressed as
( ) ( )
radf
τEnβEPL
11
×=
,
(11)
( ) ( )
radf
τEnβEPL
22
×=
,
(12)
where β is a normalizing factor. From (11) and (12), the measured temperature dependent
PL spectra of the ground state and the excited state are reproduced. The parameters used in
our calculation are listed in Table 1.
Sample
g (s
−1
)
τ
32
(ps)
τ
21
(ps)
τ
23
(ps)
τ
34
(ps)
A
1×10
21
14
68
0.17
5.5×10
−6
B 33
C 10
Table 1. Parameters used in the calculations of PL peak intensities and relaxation lifetimes of
the samples
3.3 Electron-Phonon Scattering Effect
The total linewidth of PL emission in QD system can be decomposed into two components:
inhomogeneous and homogeneous. The nature of these two mechanisms is totally different.
Inhomogeneous broadening in the QD system arises from small fluctuations in the QDs
confining size, the alloy composition variations, and the shifts due to strain-field effects
(Seebeck et al., 2005; Zhao et al., 2002). The major contribution to the inhomogeneous
broadening comes from the size variation due to the large confining potentials and the small
volumes. We can express the inhomogeneous broadening lineshape as a Gaussian function
( )
( )
−−
=
2
2
0
0
2
exp
σ
EE
GEG
,
(13)
where G
0
and E
0
are the amplitude and peak energy position, respectively, and σ is the
standard deviation of the distribution.
Homogeneous broadening is mainly due to the exciton-phonon interaction. Both acoustic
and optical phonons are involved in the process (Ortner et al, 2004). The phonon
contribution of the linewidth is proportional to phonon population density. In acoustic
phonon case, such a density increases linearly with the temperature. On the other hand,
optical phonons have a relatively fixed frequency. The number of phonons thermally excited
follows Bose-Einstein statistics. The expression of the total homogeneous linewidth can be
written as following (Christen & Bimberg, 1990)
( )
[ ]
1exp −
+=
Tkω
γ
TγΓ
BLO
LO
AChomo
.
(14)
The first term represents the acoustic phonon contributions with proportionality constant
γ
AC
and the second term represents the optical phonon contributions. γ
LO
is the longitudinal
optical (LO) phonon broadening constant and ħω
LO
is the LO phonon energy. Since the
phonon interactions are the results of lattice vibration, the phonon broadening(denoted as
Γ
phonon
) takes the shape of Lorentzian function (Christen & Bimberg, 1990)
( )
( )
22
0
1
homo
phonon
ΓEE
EΓ
+−
=
,
(15)
where Γ
homo
is the homogeneous linewidth given by (14).
The electron-phonon interaction in QDs and the interaction with the wetting layer
continuum act as additional sources of lineshape broadening (Sanguinetti et al., 1999). In
order to include carrier-phonon interaction into the model, homogeneous energy
broadening has to be considered. In QD systems, all sharp excitonic transition lines at
different energies are homogeneously broadened by phonons at the same time. The total
transition at each energy point is the sum of the contributions of all energy points. Thus the
total lineshape of a transition involving both inhomogeneous and homogeneous broadening
is the convolution of the individual lineshapes. Based on the discussion, the total transition
lineshape of the energy state involving both thermal redistribution and phonon scattering of
CuttingEdgeNanotechnology314
carriers is obtained by the convolution of state distribution function and the Lorentzian
function Γ
phonon
(E).
( ) ( ) ( )
EdEΓEEnEn
phononf
ph
f
′′′
−=
∫
1
1
,
(16)
( ) ( ) ( )
EdEΓEEnEn
phononf
ph
f
′′′
−=
∫
2
2
.
(17)
Calculations of the temperature dependent FWHMs for the samples, which combine
thermal redistribution and electron-phonon scattering effects, are shown in Fig. 6 with
adapted values of
γ
AC
=15 μeV/K,
γ
LO
=25 meV, and ħω
LO
=30 meV for InAs QDs (Gammon et
al., 1995; Zhao et al., 2002). The contribution from the thermal redistribution effect on
FWHM is also shown. As can be seen in this figure, the experimental data for sample A are
fixed to the values obtained from the contribution of redistributed carriers at T<180 K,
supplying the evidence of carrier redistribution in the sample. As T>180 K, the temperature
is high enough and the electron-phonon scattering starts to come into effect. However, the
Fig. 6. Experimental and calculated FWHM of sample A, sample B, and sample C. The
symbols are experimental data and the solid lines are the calculated results combining the
carrier redistribution and electron-phonon scattering effects together. The dashed curves
represent the contribution from thermal redistribution of carriers, compared with the
linewidth resolution of 5.5 meV
Temperature (K)
FWHM (meV)
25
50
75
100
sample A
ground state
excited state
25
50
75
100
sample B
excited state
ground state
0 50 100 150 200 250
300
25
50
75
100
sample C
excited state
ground state
effect on FWHM is unobvious and the tendency of PL linewidth with temperature is
dominated by the thermal redistribution of carriers. On the other hand, referring to the
simulated PL linewidth of sample C, little decrease is obtained at T=100-200 K in the curve
which considers only the contribution of thermal redistribution. It indicates that
repopulation of carriers among QDs is existent in this sample, while this phenomenon is too
weak to be visible in the measured FWHMs. Joining in the electron-phonon scattering effect;
the simulated FWHMs exhibit a monotonous broadening of the spectra as the temperature
increases, coinciding with the experimental data.
3.4 Intersublevel Relaxation Process
The intersublevel relaxation lifetimes of the samples can be calculated from (2) with
( )
( )
( )
En
En
Tf
f
1
1
1
=
.
(18)
Since f
1
(T) is the probability of occupancy for ground state, in equilibrium condition, it is
expressed as
( )
( )
[ ]
TkEE
Tf
B21
1
exp1
1
−+
=
.
(19)
The relaxation lifetimes simulated by (18) for the samples, as shown in Fig. 7, are decreasing
with increasing temperature. These results agree with the increase in number of phonons
predicted by the Bose distribution function: [exp(ħω/kT)−1]
−
1
. It is noticeable that the
calculated relaxation lifetimes for sample A, sample B, and sample C at T=15 K are 347 ps,
160 ps, and 40 ps, respectively. Evidently, the lifetimes of sample A and sample B are much
longer than that of sample C, resulting from their lower uniformity of QD structures. The
shortest intersublevel relaxation times of sample C coincide with the hindered phonon
bottleneck.
The corresponding values calculated from (19) of the samples at different temperatures are
also shown in Fig. 7. Observing the calculated results from (18) and (19), the discrepancy
between the curves is evident at lower temperature but the tendency of them becomes
gradually similar as the temperature is raised up. At low temperature, the carrier
recombination is much faster than the thermal emission, and the carrier distribution is non-
equilibrium (Jiang & Singh, 1999). With the increase of temperature, the thermal emission
time reduces and becomes smaller compared to the radiative recombination in the QD
system. The carriers redistribute among different dots and thus approach to the thermal
equilibrium distribution. Owing to the highest excited state energy and the smallest energy
separation between the intersublevels of sample A, carriers start to thermally emit at a lower
temperature than the other ones. As a result, sample A exhibits the lowest temperature
where the relaxation lifetimes start approaching to the values that predicted under the
thermal equilibrium condition.
Calculations of normalized PL peaks intensities of the samples are shown in Fig. 8, correlate
well with the measured data. Observing the curves shown in the plot, peak intensities of
ground state and excited state quench in the high temperature range because the carriers are
IntersublevelRelaxationPropertiesofSelf-AssembledInAs/GaAsQuantumDoteterostructures 315
carriers is obtained by the convolution of state distribution function and the Lorentzian
function Γ
phonon
(E).
( ) ( ) ( )
EdEΓEEnEn
phononf
ph
f
′′′
−=
∫
1
1
,
(16)
( ) ( ) ( )
EdEΓEEnEn
phononf
ph
f
′′′
−=
∫
2
2
.
(17)
Calculations of the temperature dependent FWHMs for the samples, which combine
thermal redistribution and electron-phonon scattering effects, are shown in Fig. 6 with
adapted values of
γ
AC
=15 μeV/K,
γ
LO
=25 meV, and ħω
LO
=30 meV for InAs QDs (Gammon et
al., 1995; Zhao et al., 2002). The contribution from the thermal redistribution effect on
FWHM is also shown. As can be seen in this figure, the experimental data for sample A are
fixed to the values obtained from the contribution of redistributed carriers at T<180 K,
supplying the evidence of carrier redistribution in the sample. As T>180 K, the temperature
is high enough and the electron-phonon scattering starts to come into effect. However, the
Fig. 6. Experimental and calculated FWHM of sample A, sample B, and sample C. The
symbols are experimental data and the solid lines are the calculated results combining the
carrier redistribution and electron-phonon scattering effects together. The dashed curves
represent the contribution from thermal redistribution of carriers, compared with the
linewidth resolution of 5.5 meV
Temperature (K)
FWHM (meV)
25
50
75
100
sample A
ground state
excited state
25
50
75
100
sample B
excited state
ground state
0 50 100 150 200 250 300
25
50
75
100
sample C
excited state
ground state
effect on FWHM is unobvious and the tendency of PL linewidth with temperature is
dominated by the thermal redistribution of carriers. On the other hand, referring to the
simulated PL linewidth of sample C, little decrease is obtained at T=100-200 K in the curve
which considers only the contribution of thermal redistribution. It indicates that
repopulation of carriers among QDs is existent in this sample, while this phenomenon is too
weak to be visible in the measured FWHMs. Joining in the electron-phonon scattering effect;
the simulated FWHMs exhibit a monotonous broadening of the spectra as the temperature
increases, coinciding with the experimental data.
3.4 Intersublevel Relaxation Process
The intersublevel relaxation lifetimes of the samples can be calculated from (2) with
( )
( )
( )
En
En
Tf
f
1
1
1
=
.
(18)
Since f
1
(T) is the probability of occupancy for ground state, in equilibrium condition, it is
expressed as
( )
( )
[ ]
TkEE
Tf
B21
1
exp1
1
−+
=
.
(19)
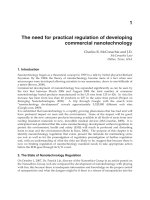
The relaxation lifetimes simulated by (18) for the samples, as shown in Fig. 7, are decreasing
with increasing temperature. These results agree with the increase in number of phonons
predicted by the Bose distribution function: [exp(ħω/kT)−1]
−
1
. It is noticeable that the
calculated relaxation lifetimes for sample A, sample B, and sample C at T=15 K are 347 ps,
160 ps, and 40 ps, respectively. Evidently, the lifetimes of sample A and sample B are much
longer than that of sample C, resulting from their lower uniformity of QD structures. The
shortest intersublevel relaxation times of sample C coincide with the hindered phonon
bottleneck.
The corresponding values calculated from (19) of the samples at different temperatures are
also shown in Fig. 7. Observing the calculated results from (18) and (19), the discrepancy
between the curves is evident at lower temperature but the tendency of them becomes
gradually similar as the temperature is raised up. At low temperature, the carrier
recombination is much faster than the thermal emission, and the carrier distribution is non-
equilibrium (Jiang & Singh, 1999). With the increase of temperature, the thermal emission
time reduces and becomes smaller compared to the radiative recombination in the QD
system. The carriers redistribute among different dots and thus approach to the thermal
equilibrium distribution. Owing to the highest excited state energy and the smallest energy
separation between the intersublevels of sample A, carriers start to thermally emit at a lower
temperature than the other ones. As a result, sample A exhibits the lowest temperature
where the relaxation lifetimes start approaching to the values that predicted under the
thermal equilibrium condition.
Calculations of normalized PL peaks intensities of the samples are shown in Fig. 8, correlate
well with the measured data. Observing the curves shown in the plot, peak intensities of
ground state and excited state quench in the high temperature range because the carriers are
CuttingEdgeNanotechnology316
Fig. 7. Calculated intersublevel relaxation lifetimes from excited state to ground state for
sample A, sample B, and sample C. The corresponding dashed lines with hollow symbols
are the values that calculated under the assumption of thermal equilibrium, and normalized
to the simulated relaxation lifetimes of sample A, sample B, and sample C, respectively
emitted into the GaAs barrier and irreversibly lost. We denote the temperature where the
excited state starts to quench as T
Q
. Sample A exhibits the lowest T
Q
(160K) and the fastest
quenching rate, coinciding with its highest excited state emission energy and the smallest
energy separation. The temperature T
Q
of sample B and sample C are 180K and 200 K,
respectively. It is noticeable that the thermal quench of ground state is much slower for
sample C than that for sample A and sample B. That can be explained by the different
intersublevel relaxation lifetimes of the samples. The shorter relaxation lifetimes of sample C
imply that the phonon bottleneck effect is partly relaxed for the sample. Through the more
active phonon-assisted scatterings, more carriers relax to the ground state during the
transferring process, slowing down the quenching rate of ground state.
Fig. 8. Experimental and calculated values of the temperature dependent PL peak intensities
of ground state and excited state of sample A, sample B, and sample C. The filled (hollow)
symbols are the experimental data of ground (excited) state and the solid (dashed) lines are
the calculated results of ground (excited) state. T
Q
denotes the temperature where the peak
intensity starts to quench
0 50 100 150 200 250
300
0
70
140
210
280
350
sample A
sample B
sample C
Relaxation Lifetime (ps)
Temperature (K)
20 70 120 170 220 270
10
-3
10
-2
10
-1
10
0
PL Peak Intensity (a.u.)
sample A
T
Q
20 70 120 170 220 270
10
-3
10
-2
10
-1
10
0
T
Q
sample B
Temperature (K)
20 70 120 170 220 270
10
-3
10
-2
10
-1
10
0
T
Q
sample C
The carriers transferring mechanisms are expressed more definitely in Fig. 9 by calculating
the numerical values of carriers which transferring in excited state and wetting layer for
sample A and sample C. A stronger dependence on temperature is obtained in Fig. 9 for
sample A. According to the curves shown in the upper panel of Fig. 9(a), thermally excited
carriers from QDs to wetting layer increase rapidly within the temperature range 100-200 K.
At T>200 K, the number of emitting carriers saturates and then decreases. Consulting to the
plot shown in the lower panel of Fig. 9(a), carriers relaxing from wetting layer to excited
state also increases at T=100-200 K, indicating the fact of thermal redistribution of carriers.
Furthermore, emitting carriers growing up as T>200 K, here the temperature is high enough
for carriers escaping to the GaAs barrier and irreversibly lost. The thermal loss reduces the
excitons in wetting layer, which in turn suppresses the carriers transferring in the excited
state.
Calculation for sample C is shown
in Fig. 9(b). Comparing the simulation results to that of
sample A, it is clearly seen in the upper panel that the calculated radiative recombination
term possesses a less important portion of the transferring carriers. The calculated result is
consistent with the shorter relaxation lifetime of sample C. Because most of the injected
carriers relax to the ground state, fewer carriers exist in the excited state. The thermal
redistribution of carriers in the QD system is then retarded; thermal emission occurs at a
higher temperature and the amount of thermally escaping excitons is smaller than that of
sample A. Consequently, the simulated results exhibit a similar but weaker response to
temperature change. It is obvious that the dot size uniformity of the QD systems plays an
influential role in the carrier relaxation process.
Fig. 9. Amounts of transferring carriers of each energy level in the QD system for (a) sample
A, and (b) sample C. Dash-dotted lines in upper panels denote the radiative recombination
terms. Solid lines and dotted lines denote the relaxation and thermal emission portions,
respectively
0.00
0.04
0.08
0.12
0 50 100 150 200 250 300
0
30
60
90
0.00
0.04
0.08
0.12
0 50 100 150 200 250 300
0
30
60
90
excited state
wetting layer
excited state
Temperature (K)
wetting layer
(a) (b)
Carriers (
×
10
19
s
-1
)
IntersublevelRelaxationPropertiesofSelf-AssembledInAs/GaAsQuantumDoteterostructures 317
Fig. 7. Calculated intersublevel relaxation lifetimes from excited state to ground state for
sample A, sample B, and sample C. The corresponding dashed lines with hollow symbols
are the values that calculated under the assumption of thermal equilibrium, and normalized
to the simulated relaxation lifetimes of sample A, sample B, and sample C, respectively
emitted into the GaAs barrier and irreversibly lost. We denote the temperature where the
excited state starts to quench as T
Q
. Sample A exhibits the lowest T
Q
(160K) and the fastest
quenching rate, coinciding with its highest excited state emission energy and the smallest
energy separation. The temperature T
Q
of sample B and sample C are 180K and 200 K,
respectively. It is noticeable that the thermal quench of ground state is much slower for
sample C than that for sample A and sample B. That can be explained by the different
intersublevel relaxation lifetimes of the samples. The shorter relaxation lifetimes of sample C
imply that the phonon bottleneck effect is partly relaxed for the sample. Through the more
active phonon-assisted scatterings, more carriers relax to the ground state during the
transferring process, slowing down the quenching rate of ground state.
Fig. 8. Experimental and calculated values of the temperature dependent PL peak intensities
of ground state and excited state of sample A, sample B, and sample C. The filled (hollow)
symbols are the experimental data of ground (excited) state and the solid (dashed) lines are
the calculated results of ground (excited) state. T
Q
denotes the temperature where the peak
intensity starts to quench
0 50 100 150 200 250 300
0
70
140
210
280
350
sample A
sample B
sample C
Relaxation Lifetime (ps)
Temperature (K)
20 70 120 170 220 270
10
-3
10
-2
10
-1
10
0
PL Peak Intensity (a.u.)
sample A
T
Q
20 70 120 170 220 270
10
-3
10
-2
10
-1
10
0
T
Q
sample B
Temperature (K)
20 70 120 170 220 270
10
-3
10
-2
10
-1
10
0
T
Q
sample C
The carriers transferring mechanisms are expressed more definitely in Fig. 9 by calculating
the numerical values of carriers which transferring in excited state and wetting layer for
sample A and sample C. A stronger dependence on temperature is obtained in Fig. 9 for
sample A. According to the curves shown in the upper panel of Fig. 9(a), thermally excited
carriers from QDs to wetting layer increase rapidly within the temperature range 100-200 K.
At T>200 K, the number of emitting carriers saturates and then decreases. Consulting to the
plot shown in the lower panel of Fig. 9(a), carriers relaxing from wetting layer to excited
state also increases at T=100-200 K, indicating the fact of thermal redistribution of carriers.
Furthermore, emitting carriers growing up as T>200 K, here the temperature is high enough
for carriers escaping to the GaAs barrier and irreversibly lost. The thermal loss reduces the
excitons in wetting layer, which in turn suppresses the carriers transferring in the excited
state.
Calculation for sample C is shown
in Fig. 9(b). Comparing the simulation results to that of
sample A, it is clearly seen in the upper panel that the calculated radiative recombination
term possesses a less important portion of the transferring carriers. The calculated result is
consistent with the shorter relaxation lifetime of sample C. Because most of the injected
carriers relax to the ground state, fewer carriers exist in the excited state. The thermal
redistribution of carriers in the QD system is then retarded; thermal emission occurs at a
higher temperature and the amount of thermally escaping excitons is smaller than that of
sample A. Consequently, the simulated results exhibit a similar but weaker response to
temperature change. It is obvious that the dot size uniformity of the QD systems plays an
influential role in the carrier relaxation process.
Fig. 9. Amounts of transferring carriers of each energy level in the QD system for (a) sample
A, and (b) sample C. Dash-dotted lines in upper panels denote the radiative recombination
terms. Solid lines and dotted lines denote the relaxation and thermal emission portions,
respectively
0.00
0.04
0.08
0.12
0 50 100 150 200 250 300
0
30
60
90
0.00
0.04
0.08
0.12
0 50 100 150 200 250 300
0
30
60
90
excited state
wetting layer
excited state
Temperature (K)
wetting layer
(a) (b)
Carriers (×10
19
s
-1
)
CuttingEdgeNanotechnology318
4. Conclusion
In this chapter, we have investigated the effects of phonon-assisted transferring of carriers
on QD system both experimentally and theoretically. The relaxation and thermal emission of
carriers are analyzed quantitatively by a rate-equation model. The model is based on a set of
rate equations which connect the ground state, the excited state, the wetting layer, and the
GaAs barrier in the QD system. All of the important mechanisms for explaining the unique
evolution of quantum dot PL spectra are taken into account, including the inhomogeneous
broadening of QDs, the random population of density of states, thermal emission and
retrapping, radiative and nonradiative recombination, and the electron-phonon scattering.
The simulated results exhibit a good agreement to the experimental data measured from
samples with different dot densities and size uniformities for temperatures ranging from 15
K to 280 K. Quantitative discussion of the carriers which thermally excited and relax
between the excited state and the wetting layer provides an explicit proof of the thermal
redistribution and lateral transition of carriers via the wetting layer.
The phonon-assisted activations of excitons with increasing temperatures are analyzed in
detail as well. Homogeneous broadening is included in the rate equation model to
demonstrate the correlation between thermal redistribution and electron-phonon scattering
effects on the PL spectra of QD system and the intersublevel relaxation lifetimes is
calculated. According to the theoretical analysis, carriers redistribute apparently with
increasing temperature for sample with evident phonon-bottleneck effect and the effect of
electron-phonon scattering is suppressed. On the other hand, the thermal redistribution
effect is weak and compensated by the thermal-enhanced electron-phonon scattering for
sample with relaxed phonon bottleneck and the electron-phonon scattering occupies an
evident portion of the transferring mechanisms in the QD system. It is coinciding with the
observed monotonic increase of FWHMs with temperature.
Furthermore, the numerical values of transferring carriers in discrete energy levels under
different temperatures are also calculated. The shorter relaxation lifetime of the sample with
better size-uniformity implies a restricted phonon bottleneck effect, and the unapparent
change of excitons with temperature in each energy level reveals a better thermal stability.
The simulation result confirms that the thermal redistribution of carriers and the electron
phonon scattering affect the temperature dependent PL spectra simultaneously, and the
size-uniformity of quantum dots is of essential importance for thermal activated
mechanisms in quantum dot systems. Detailed investigations into the carrier dynamics in
QD systems are of particular significance to the design of QD structures. Requirement of the
relaxation lifetime is severe in the case of high-speed modulation. Therefore, our work has
particular significance to the design of optoelectronic devices by QD structures which
exhibiting truly three-dimensional confined state transitions.
5. Acknowledgment
This work was supported by the National Science Council of the Republic of China under
Contract NSC 97-2112-M-131-001.
6. References
Bafna, M. K.; Sen, P. & Sen, P. K. (2006). Temperature dependence of the photoluminescence
properties of self-assembled InGaAs/GaAs single quantum dot, Journal of Applied
Physics, Vol. 100, pp. 103515
Benisty, H.; Sotomayor-Torres, C. M. & Weisbuch, C. (1991). Intrinsic mechanism for the
poor luminescence properties of quantum-box systems, Physical Review B, Vol. 44,
pp. 10945-10948
Benisty, H. (1995). Reduced electron-phonon relaxation rates in quantum-box systems:
Theoretical analysis, Physical Review B, Vol. 51, pp. 13281-13293
Bissiri, M.; Hőgersthal, G. B. H.; Capizzi, M.; Frigeri, P. & Franchi, S. (2001). Quantum size
and shape effects on the excited states of In
x
Ga
1-x
As quantum dots, Physical Review
B, Vol. 64, pp. 245337
Bockelmann, U. & Bastard, G. (1990). Phonon scattering and energy relaxation in two-, one-,
and zero-dimensional electron gases, Physical Review B, Vol. 42, pp. 8947-8951
Chang, W. H.; Hsu, T. M.; Tsai, K. F.; Nee, T. E.; Chyi, J. I. & N. T. Yeh, (1999). Excitation
Density and Temperature Dependent Photoluminescence of InGaAs Self-
Assembled Quantum Dots, Japanese Journal of Applied Physics, Vol. 38, pp. 554-557
Cheng, W. Q.; Xie, X. G.; Zhong, Z. Y.; Cai, L. H. ; Huang, Q. & Zhou, J. M. (1998).
Photoluminescence from InAs quantum dots on GaAs(100), Thin Solid Films, Vol.
312, pp. 287-290
Christen, J. & Bimberg, D. (1990). Line shapes of intersubband and excitonic recombination
in quantum wells: Influence of final-state interaction, statistical broadening, and
momentum conservation, Physical Review B, Vol. 42, pp. 7213-7218
Dawson, P.; Rubel, O.; Baranovskii, S. D.; Pierz, K.; Thomas, P. & Göbel, E. O. (2005).
Temperature-dependent optical properties of InAs/GaAs quantum dots:
Independent carrier versus exciton relaxation, Physical Review B, Vol. 72, pp. 235301
Duarte, C. A.; Silva, E. C. F. da; Quivy, A. A.; Silva, M. J. da; Martini, S.; Leite, J. R.;
Meneses,
E. A. & Lauretto, E. (2003). Influence of the temperature on the carrier capture into
self-assembled InAs/GaAs quantum dots, Journal of Applied Physics, Vol. 93, pp.
6279-6283
Gammon, D.; Rudin, S.; Reinecke, T. L.; Katzer, D. S. & Kyono, C. S. (1995). Phonon
broadening of excitons in GaAs/Al
x
Ga
1-x
As quantum wells, Physical Review B, Vol.
51, pp. 16785
Giorgi, M. De; Lingk, C.; Plessen, G. von; Feldmann, J.; Rinaldis, S. De; Passaseo, A.; Vittorio,
M. De; Cingolani, R. & Lomascolo, M. (2001). Capture and thermal re-emission of
carriers in long-wavelength InGaAs/GaAs quantum dots, Applied Physics Letters,
Vol. 79, pp. 3968-3970
Grosse, S.; Sandmann, J. H. H.; Plessen, G. von & Feldmann, J. (1997). Carrier relaxation
dynamics in quantum dots: Scattering mechanisms and state-filling effects, Physical
Review B, V
ol. 55, pp. 4473-4476
Hai, G. Q. & Oliveira, S. S. (2006). Electron relaxation induced by electron–longitudinal-
acoustic-phonon scattering in single and coupled quantum dots in external
magnetic and electric fields, Physical Review B, Vol. 74, pp. 193303
Jiang, H & Singh, J. (1999). Nonequilibrium distribution in quantum dots lasers and
influence on laser spectral output, Journal of Applied Physics, Vol. 85, pp. 7438-7442
IntersublevelRelaxationPropertiesofSelf-AssembledInAs/GaAsQuantumDoteterostructures 319
4. Conclusion
In this chapter, we have investigated the effects of phonon-assisted transferring of carriers
on QD system both experimentally and theoretically. The relaxation and thermal emission of
carriers are analyzed quantitatively by a rate-equation model. The model is based on a set of
rate equations which connect the ground state, the excited state, the wetting layer, and the
GaAs barrier in the QD system. All of the important mechanisms for explaining the unique
evolution of quantum dot PL spectra are taken into account, including the inhomogeneous
broadening of QDs, the random population of density of states, thermal emission and
retrapping, radiative and nonradiative recombination, and the electron-phonon scattering.
The simulated results exhibit a good agreement to the experimental data measured from
samples with different dot densities and size uniformities for temperatures ranging from 15
K to 280 K. Quantitative discussion of the carriers which thermally excited and relax
between the excited state and the wetting layer provides an explicit proof of the thermal
redistribution and lateral transition of carriers via the wetting layer.
The phonon-assisted activations of excitons with increasing temperatures are analyzed in
detail as well. Homogeneous broadening is included in the rate equation model to
demonstrate the correlation between thermal redistribution and electron-phonon scattering
effects on the PL spectra of QD system and the intersublevel relaxation lifetimes is
calculated. According to the theoretical analysis, carriers redistribute apparently with
increasing temperature for sample with evident phonon-bottleneck effect and the effect of
electron-phonon scattering is suppressed. On the other hand, the thermal redistribution
effect is weak and compensated by the thermal-enhanced electron-phonon scattering for
sample with relaxed phonon bottleneck and the electron-phonon scattering occupies an
evident portion of the transferring mechanisms in the QD system. It is coinciding with the
observed monotonic increase of FWHMs with temperature.
Furthermore, the numerical values of transferring carriers in discrete energy levels under
different temperatures are also calculated. The shorter relaxation lifetime of the sample with
better size-uniformity implies a restricted phonon bottleneck effect, and the unapparent
change of excitons with temperature in each energy level reveals a better thermal stability.
The simulation result confirms that the thermal redistribution of carriers and the electron
phonon scattering affect the temperature dependent PL spectra simultaneously, and the
size-uniformity of quantum dots is of essential importance for thermal activated
mechanisms in quantum dot systems. Detailed investigations into the carrier dynamics in
QD systems are of particular significance to the design of QD structures. Requirement of the
relaxation lifetime is severe in the case of high-speed modulation. Therefore, our work has
particular significance to the design of optoelectronic devices by QD structures which
exhibiting truly three-dimensional confined state transitions.
5. Acknowledgment
This work was supported by the National Science Council of the Republic of China under
Contract NSC 97-2112-M-131-001.
6. References
Bafna, M. K.; Sen, P. & Sen, P. K. (2006). Temperature dependence of the photoluminescence
properties of self-assembled InGaAs/GaAs single quantum dot, Journal of Applied
Physics, Vol. 100, pp. 103515
Benisty, H.; Sotomayor-Torres, C. M. & Weisbuch, C. (1991). Intrinsic mechanism for the
poor luminescence properties of quantum-box systems, Physical Review B, Vol. 44,
pp. 10945-10948
Benisty, H. (1995). Reduced electron-phonon relaxation rates in quantum-box systems:
Theoretical analysis, Physical Review B, Vol. 51, pp. 13281-13293
Bissiri, M.; Hőgersthal, G. B. H.; Capizzi, M.; Frigeri, P. & Franchi, S. (2001). Quantum size
and shape effects on the excited states of In
x
Ga
1-x
As quantum dots, Physical Review
B, Vol. 64, pp. 245337
Bockelmann, U. & Bastard, G. (1990). Phonon scattering and energy relaxation in two-, one-,
and zero-dimensional electron gases, Physical Review B, Vol. 42, pp. 8947-8951
Chang, W. H.; Hsu, T. M.; Tsai, K. F.; Nee, T. E.; Chyi, J. I. & N. T. Yeh, (1999). Excitation
Density and Temperature Dependent Photoluminescence of InGaAs Self-
Assembled Quantum Dots, Japanese Journal of Applied Physics, Vol. 38, pp. 554-557
Cheng, W. Q.; Xie, X. G.; Zhong, Z. Y.; Cai, L. H. ; Huang, Q. & Zhou, J. M. (1998).
Photoluminescence from InAs quantum dots on GaAs(100), Thin Solid Films, Vol.
312, pp. 287-290
Christen, J. & Bimberg, D. (1990). Line shapes of intersubband and excitonic recombination
in quantum wells: Influence of final-state interaction, statistical broadening, and
momentum conservation, Physical Review B, Vol. 42, pp. 7213-7218
Dawson, P.; Rubel, O.; Baranovskii, S. D.; Pierz, K.; Thomas, P. & Göbel, E. O. (2005).
Temperature-dependent optical properties of InAs/GaAs quantum dots:
Independent carrier versus exciton relaxation, Physical Review B, Vol. 72, pp. 235301
Duarte, C. A.; Silva, E. C. F. da; Quivy, A. A.; Silva, M. J. da; Martini, S.; Leite, J. R.;
Meneses,
E. A. & Lauretto, E. (2003). Influence of the temperature on the carrier capture into
self-assembled InAs/GaAs quantum dots, Journal of Applied Physics, Vol. 93, pp.
6279-6283
Gammon, D.; Rudin, S.; Reinecke, T. L.; Katzer, D. S. & Kyono, C. S. (1995). Phonon
broadening of excitons in GaAs/Al
x
Ga
1-x
As quantum wells, Physical Review B, Vol.
51, pp. 16785
Giorgi, M. De; Lingk, C.; Plessen, G. von; Feldmann, J.; Rinaldis, S. De; Passaseo, A.; Vittorio,
M. De; Cingolani, R. & Lomascolo, M. (2001). Capture and thermal re-emission of
carriers in long-wavelength InGaAs/GaAs quantum dots, Applied Physics Letters,
Vol. 79, pp. 3968-3970
Grosse, S.; Sandmann, J. H. H.; Plessen, G. von & Feldmann, J. (1997). Carrier relaxation
dynamics in quantum dots: Scattering mechanisms and state-filling effects, Physical
Review B, V
ol. 55, pp. 4473-4476
Hai, G. Q. & Oliveira, S. S. (2006). Electron relaxation induced by electron–longitudinal-
acoustic-phonon scattering in single and coupled quantum dots in external
magnetic and electric fields, Physical Review B, Vol. 74, pp. 193303
Jiang, H & Singh, J. (1999). Nonequilibrium distribution in quantum dots lasers and
influence on laser spectral output, Journal of Applied Physics, Vol. 85, pp. 7438-7442
CuttingEdgeNanotechnology320
Lee, J. C.; Hu, Y. J.; Wu, Y. F.; Nee, T. E.; Wang, J. C. & Fang, J. H. (2007). Intersublevel
Relaxation Properties of Self-Assembled InAs/GaAs Quantum Dot
Heterostructures, Proceedings of the 7th IEEE International Conference on
Nanotechnology, pp. 934-937, Hong Kong, August 2008
Lee, H.; Yang, W. & Sercel, P. C. (1997). Temperature and excitation dependence of
photoluminescence line shape in InAs/GaAs quantum-dot structures, Physical
Review B, Vol. 55, pp. 9757-9762
Lobo, C.; Leon, R.; Marcinkevicius, S.; Yang, W.; Sercel, P. C.; Liao, X. Z.; Zou, J. & Cockayne,
D. J. (1999). Inhibited carrier transfer in ensembles of isolated quantum dots,
Physical Review B, Vol. 60, pp. 16647-16651
Malik, S.; Ru, E. C. Le; Childs, D. & Murray, R. (2001). Time-resolved studies of annealed
InAs/GaAs self-assembled quantum dots, Physical Review B, Vol. 63, pp. 155313
Mukai, K.; Ohtsuka, N.; Shoji, H. & Sugawara, M. (1996). Phonon bottleneck in self-formed
In
x
Ga
1-x
As/GaAs quantum dots by electroluminescence and time-resolved
photoluminescence, Physical Review B, Vol. 54, pp. R5243-R5246
Nee, T. E.; Wu, Y. F. & Lin, R. M. (2005). Effect of carrier hopping and relaxing on
photoluminescence line shape in self-organized InAs quantum dot heterostructures,
Journal of Vacuum Science & Technology B, Vol. 23, pp. 954-958
Nee, T. E.; Wu, Y. F.; Cheng, C. C. & Shen, H. T. (2006). Carrier dynamics study of
temperature and excitation dependent photoluminescence from InAs/GaAs
quantum dots, Journal of Applied Physics, Vol. 99, pp. 013506
Ortner, G.; Yakovlev, D. R.; Bayer, M.; Rudin, S.; Reinecke, T. L.; Fafard, S.; Wasilewski, Z. &
Forchel, A. (2004). Temperature dependence of the zero-phonon linewidth in
InAs/GaAs quantum dots, Physical Review B, Vol. 70, pp. 201301
Polimeni, A.; Patanè, A.; Henini, M.; Eaves, L. & Main, P. C. (1999).
Temperature
dependence of the optical properties of InAs/Al
y
Ga
1-y
As self-organized quantum
dots, Physical Review B, Vol. 59, pp. 5064-5068
Raymond, S.; Fafard, S.; Poole, PJ.; Wojs, A.; Hawrylak, P.; Charbonneau, S.; Leonard, D.;
Leon, R.; Petroff, PM. & Merz, JL. (1996). State filling and time-resolved
photoluminescence of excited states in In
x
Ga
1-x
As/GaAs self-assembled quantum
dots, Physical Review B, Vol. 54, pp. 11548-11554
Sanguinetti, S.; Henini, M.; Alessi, M. G.; Capizzi, M.; Frigeri, P. & Franchi, S. (1999). Carrier
thermal escape and retrapping in self-assembled quantum dots, Physical Review B,
Vol. 60, pp. 8276-8283
Sanguinetti, S.; Watanabe, K.; Tateno, T.; Wakaki, M.; Koguchi, N.; Kuroda, T.; Minami, F. &
Gurioli, M. (2002). Role of the wetting layer in the carrier relaxation in quantum
dots, Applied Physics Letters, Vol. 81, pp. 613-615
Schmidt, K. H.; Medeiros-Ribeiro G.; Oestreich, M. & Petroff, P. M. (1996). Carrier relaxation
and electronic structure in InAs self-assembled quantum dots, Physical Review B,
Vol. 54, pp. 11346-11353
Seebeck, J.; Nielsen, T. R.; Gartner, P. & Jahnke, F. (2005). Coherent resonant tunneling time
and velocity in finite periodic systems, Physical Review B, Vol. 71, pp. 125317
Smith, L. M.; Leosson, K.; Erland, J.; Jensen, J. R.; Hvam, J. M. & Zwiller, V. (2001). Excited
State Dynamics in In
0.5
Al
0.04
Ga
0.46
As/Al
0.08
Ga
0.92
As Self-Assembled Quantum Dots,
Physica Status Solidi (b), Vol. 224, pp. 447-451
Solomon, G. S.; Trezza, J. A. & Harris, J. S. J. (1995). Effects of monolayer coverage, flux ratio,
and growth rate on the island density of InAs islands on GaAs, Applied Physics
Letters, Vol. 66, pp. 3161-3163
Tarasov, G. G.; Mazur, Yu. I.; Zhuchenko, Z. Ya.; Maaßdorf, A.; Nickel, D.; Tomm, J. W.;
Kissel, H.; Walther, C. & Masselink, W. T. (2000). Carrier transfer in self-assembled
coupled InAs/GaAs quantum dots, Journal of Applied Physics, Vol. 88, pp. 7162-7170
Tomm, J. W.; Mazur, Y. I.; Tarasov, G. G.; Zhuchenko, Z. Y.; Kissel, H.; Masselink, W. T. &
Elsaesser, T. (2003). Transit luminescence of dense InAs/GaAs quantum dot arrays,
Physical Review B, Vol. 67, pp. 045326
Wu, Y. F.; Lee, J. C. & Hu, Y. J. (2008). Effect of Phonon-assisted Transferring of Excitons on
Photoluminescence Spectra from InAs Quantum Dots, Proceedings of 2008
International Electron Devices and Materials Symposia, pp. 676-679, Taiwan, November
2008
Xu, Z. Y.; Lu, Z. D.; Yang, X. P.; Yuan, Z. L.; Zheng, B. Z.; Xu, J. Z.; Ge, W. K.; Wang, Y.;
Wang, J. & Chang, L. L. (1996). Carrier relaxation and thermal activation of
localized excitons in self-organized InAs multilayers grown on GaAs substrates,
Physical Review B, Vol. 54, pp. 11528-11531
Yang, W.; Lowe-Webb, R. R.; Lee, H. & Sercel, P. C. (1997). Effect of carrier emission and
retrapping on luminescence time decays in InAs/GaAs quantum dots, Physical
Review B, Vol. 56, pp. 13314-13320
Zhang, X. Q.; Ganapathy, S.; Kumano, H.; Uesugi, K. & Suemene, I. (2002). Photoexcited
carrier transfer in InGaAs quantum dot structures: Dependence on the dot density,
Journal of Applied Physics, Vol. 92, pp. 6813-6818
Zhao, H.; Wachter, S. & Kalt, H. (2002). Effect of quantum confinement on exciton-phonon
interactions, Physical Review B, Vol. 66, pp. 085337
IntersublevelRelaxationPropertiesofSelf-AssembledInAs/GaAsQuantumDoteterostructures 321
Lee, J. C.; Hu, Y. J.; Wu, Y. F.; Nee, T. E.; Wang, J. C. & Fang, J. H. (2007). Intersublevel
Relaxation Properties of Self-Assembled InAs/GaAs Quantum Dot
Heterostructures, Proceedings of the 7th IEEE International Conference on
Nanotechnology, pp. 934-937, Hong Kong, August 2008
Lee, H.; Yang, W. & Sercel, P. C. (1997). Temperature and excitation dependence of
photoluminescence line shape in InAs/GaAs quantum-dot structures, Physical
Review B, Vol. 55, pp. 9757-9762
Lobo, C.; Leon, R.; Marcinkevicius, S.; Yang, W.; Sercel, P. C.; Liao, X. Z.; Zou, J. & Cockayne,
D. J. (1999). Inhibited carrier transfer in ensembles of isolated quantum dots,
Physical Review B, Vol. 60, pp. 16647-16651
Malik, S.; Ru, E. C. Le; Childs, D. & Murray, R. (2001). Time-resolved studies of annealed
InAs/GaAs self-assembled quantum dots, Physical Review B, Vol. 63, pp. 155313
Mukai, K.; Ohtsuka, N.; Shoji, H. & Sugawara, M. (1996). Phonon bottleneck in self-formed
In
x
Ga
1-x
As/GaAs quantum dots by electroluminescence and time-resolved
photoluminescence, Physical Review B, Vol. 54, pp. R5243-R5246
Nee, T. E.; Wu, Y. F. & Lin, R. M. (2005). Effect of carrier hopping and relaxing on
photoluminescence line shape in self-organized InAs quantum dot heterostructures,
Journal of Vacuum Science & Technology B, Vol. 23, pp. 954-958
Nee, T. E.; Wu, Y. F.; Cheng, C. C. & Shen, H. T. (2006). Carrier dynamics study of
temperature and excitation dependent photoluminescence from InAs/GaAs
quantum dots, Journal of Applied Physics, Vol. 99, pp. 013506
Ortner, G.; Yakovlev, D. R.; Bayer, M.; Rudin, S.; Reinecke, T. L.; Fafard, S.; Wasilewski, Z. &
Forchel, A. (2004). Temperature dependence of the zero-phonon linewidth in
InAs/GaAs quantum dots, Physical Review B, Vol. 70, pp. 201301
Polimeni, A.; Patanè, A.; Henini, M.; Eaves, L. & Main, P. C. (1999).
Temperature
dependence of the optical properties of InAs/Al
y
Ga
1-y
As self-organized quantum
dots, Physical Review B, Vol. 59, pp. 5064-5068
Raymond, S.; Fafard, S.; Poole, PJ.; Wojs, A.; Hawrylak, P.; Charbonneau, S.; Leonard, D.;
Leon, R.; Petroff, PM. & Merz, JL. (1996). State filling and time-resolved
photoluminescence of excited states in In
x
Ga
1-x
As/GaAs self-assembled quantum
dots, Physical Review B, Vol. 54, pp. 11548-11554
Sanguinetti, S.; Henini, M.; Alessi, M. G.; Capizzi, M.; Frigeri, P. & Franchi, S. (1999). Carrier
thermal escape and retrapping in self-assembled quantum dots, Physical Review B,
Vol. 60, pp. 8276-8283
Sanguinetti, S.; Watanabe, K.; Tateno, T.; Wakaki, M.; Koguchi, N.; Kuroda, T.; Minami, F. &
Gurioli, M. (2002). Role of the wetting layer in the carrier relaxation in quantum
dots, Applied Physics Letters, Vol. 81, pp. 613-615
Schmidt, K. H.; Medeiros-Ribeiro G.; Oestreich, M. & Petroff, P. M. (1996). Carrier relaxation
and electronic structure in InAs self-assembled quantum dots, Physical Review B,
Vol. 54, pp. 11346-11353
Seebeck, J.; Nielsen, T. R.; Gartner, P. & Jahnke, F. (2005). Coherent resonant tunneling time
and velocity in finite periodic systems, Physical Review B, Vol. 71, pp. 125317
Smith, L. M.; Leosson, K.; Erland, J.; Jensen, J. R.; Hvam, J. M. & Zwiller, V. (2001). Excited
State Dynamics in In
0.5
Al
0.04
Ga
0.46
As/Al
0.08
Ga
0.92
As Self-Assembled Quantum Dots,
Physica Status Solidi (b), Vol. 224, pp. 447-451
Solomon, G. S.; Trezza, J. A. & Harris, J. S. J. (1995). Effects of monolayer coverage, flux ratio,
and growth rate on the island density of InAs islands on GaAs, Applied Physics
Letters, Vol. 66, pp. 3161-3163
Tarasov, G. G.; Mazur, Yu. I.; Zhuchenko, Z. Ya.; Maaßdorf, A.; Nickel, D.; Tomm, J. W.;
Kissel, H.; Walther, C. & Masselink, W. T. (2000). Carrier transfer in self-assembled
coupled InAs/GaAs quantum dots, Journal of Applied Physics, Vol. 88, pp. 7162-7170
Tomm, J. W.; Mazur, Y. I.; Tarasov, G. G.; Zhuchenko, Z. Y.; Kissel, H.; Masselink, W. T. &
Elsaesser, T. (2003). Transit luminescence of dense InAs/GaAs quantum dot arrays,
Physical Review B, Vol. 67, pp. 045326
Wu, Y. F.; Lee, J. C. & Hu, Y. J. (2008). Effect of Phonon-assisted Transferring of Excitons on
Photoluminescence Spectra from InAs Quantum Dots, Proceedings of 2008
International Electron Devices and Materials Symposia, pp. 676-679, Taiwan, November
2008
Xu, Z. Y.; Lu, Z. D.; Yang, X. P.; Yuan, Z. L.; Zheng, B. Z.; Xu, J. Z.; Ge, W. K.; Wang, Y.;
Wang, J. & Chang, L. L. (1996). Carrier relaxation and thermal activation of
localized excitons in self-organized InAs multilayers grown on GaAs substrates,
Physical Review B, Vol. 54, pp. 11528-11531
Yang, W.; Lowe-Webb, R. R.; Lee, H. & Sercel, P. C. (1997). Effect of carrier emission and
retrapping on luminescence time decays in InAs/GaAs quantum dots, Physical
Review B, Vol. 56, pp. 13314-13320
Zhang, X. Q.; Ganapathy, S.; Kumano, H.; Uesugi, K. & Suemene, I. (2002). Photoexcited
carrier transfer in InGaAs quantum dot structures: Dependence on the dot density,
Journal of Applied Physics, Vol. 92, pp. 6813-6818
Zhao, H.; Wachter, S. & Kalt, H. (2002). Effect of quantum confinement on exciton-phonon
interactions, Physical Review B, Vol. 66, pp. 085337
CuttingEdgeNanotechnology322
ArithmeticCircuitsRealizedbyTransferringSingleElectrons 323
ArithmeticCircuitsRealizedbyTransferringSingleElectrons
Wan-chengZhangandNan-jianWu
X
Arithmetic Circuits Realized by Transferring
Single Electrons
Wan-cheng Zhang and Nan-jian Wu
Institute of Semiconductors, Chinese Academy of Sciences
P. R. CHINA
1. Introduction
A number of challenges are facing the semiconductor industry, such as increases of power
consumption and interconnects delay. The combination of current CMOS technology and
novel nanotechnologies like the single-electron technology is a promising approach to solve
these problems. Single-electron devices (SEDs) operate by controlling the movements of
individual electrons based on the Coulomb Blockade effect (Likharev, 1999). They have
potentially small device area and very low power dissipation. Single-electron circuit, in
which discrete electrons are used to process information, can be viewed as the ultimate goal
of electronic circuits (Ono et al., 2006). Therefore, the single-electron technology is attracting
large interest in the last decade. Various single-electron circuit blocks, including memory
(Yano, 1994), inverter (Ono et al., 2000), logic gates (Asahi, 1997), multiple-valued logic
circuits (Inokawa et al., 2003) and sensors have been proposed and intensively studied.
These circuits used the unique characteristic of SEDs and some of them have been proven to
have impressive circuit performances.
Most of previous single-electron circuits have similar operation principle with their CMOS
counterparts. For example, the single-electron inverter is composed of two single-electron
transistors (SETs) with different I
d
-V
g
characteristics, just like the CMOS inverter (Ono et al.,
2000). The input/output signals are represented by node voltages. The only difference is
that the operations of SETs require much smaller energy than MOS transistors. We argue
that, this scheme does not release the full potential of SEDs. Actually, the single-electron
technology would represent a revolution not only in scaling down but also in its physical
foundation of the electron charge discreteness devices. The recent development of single-
electron turnstile already allows us to accurately control the transfer of single-electrons and
at relative high temperature (Nishiguchi et al., 2006). In this chapter, we will show that, by
using single-electron transfer devices to manipulate the transfer of single-electrons, it is able
to implement smarter arithmetic circuits with very compact structures and impressive
circuit performances.
Arithmetic circuits like adder and multiplier are regarded as very critical components in
modern information-processing systems. A promising nanoscale adder circuit should have
high integration density, low power dissipation and high speed, which is a great challenge.
The worst-case propagation delay t
d
of a conventional ripple-carry adder is proportional to
15
CuttingEdgeNanotechnology324
its operand length n, so that the operation speed of ripple-carry adder is low. Carry look-
ahead adder can reduce t
d
to the order of logn, but circuit area are largely increased. An
interesting family of adders use non-binary arithmetic algorithms based on high-radix
number systems or redundant number systems, such as the signed-digit (SD) adders
(Avizienis, 1961) and the redundant-binary (RB) adders (Takagi, 1985). Because the carry
propagations in these adders are restricted only to adjoining cells, it is possible to perform
addition of two operands in constant time which is not dependent on n (Parhami, 1990;
Parhami, 1993). Hereafter these non-binary adders are referred to as fast adders. Fast adders
have promising characteristics, but their compact and efficient implementation still remains
a big challenge. The conventional approaches use binary MOS logic gates to implement non-
binary algorithms so that the adders are complex in circuit structure and are thus hard to
design. Moreover, each type of fast adders requires specific consideration to optimize its
performance. On the other hand, the multiple-valued current-mode logic (MVCL) approach
can significantly reduce the number of devices in the circuit (Kawahito, 1988). However,
MVCL suffers from relatively large power dissipation and it results in low overall area-time-
power performances. Although novel approach using negative differential-resistance
devices can greatly reduces the number of transistors (Gonzalez, 1998), it is only specific to
one particular kind of fast adder.
In this chapter, we proposed circuit architecture and design methods to implement novel
fast adders and fast multipliers by transferring & storing single electrons. We use the number
of electrons to represent different logic values and we perform arithmetic operations by
accurately manipulating electrons. We propose general fast single-electron adder
architecture based on non-binary arithmetic and design methods to implement various fast
adder circuits. We adopt the counter tree diagram (CTD) (Sakiyama, 2003) to represent and
analyze our fast adders, and we use the MOSFET-based single-electron turnstile as the basic
circuit element. We used the unique characteristic of MOSFET-based single-electron
turnstile to finish complicated fast-addition arithmetic operations compactly. We propose
two design styles to implement fast adder circuit blocks: the threshold approach and the
periodic approach. The proposed adder circuits have several advantages: 1) The operation
speeds are high; 2) The circuit structures are compact and the number of devices is small; 3)
The power dissipations are much lower than conventional circuits; 4) The circuit design
method based on the CTD is very simple and can be applied to a wide range of adders. In
the following sections, first we introduce the background of single-electron devices and
operation principle of MOSFET-based single-electron turnstile. Then we introduce fast
addition algorithms and the circuit architecture to perform non-binary fast addition by
transferring single-electrons. Then we introduce a family of SE transfer circuits based on
MOSFET-based SE turnstile. Next we show the principles of the threshold approach and the
periodic approach, and we show adder design examples for each approach. After that we
study and compare the performances of the proposed adders. Finally, we summarize the
results.
2. MOSFET-based Single Electron Turnstile
2.1 Working Principle
First we introduce the basic device of our work: the single-electron (SE) turnstile. MOSFET-
based single-electron turnstile is a very promising SE transfer device, which could
accurately control the number of transferred electrons using the Coulomb blockade effect
(Fujiwara, 2008). Room-temperature (RT) operation of a SE multilevel memory and RT
operation of a digital-analog converter circuit (Nishiguchi, 2006) consisting of MOSFET-based
SE turnstiles have been experimentally demonstrated. Fig. 1(a) shows the device structure of
the SE turnstile. The turnstile has two MOSFETs, FET1 and FET2. The FET1 and FET2 are
gate-all-around Si-nanowire MOSFETs on SOI wafer. By turning FET1 and FET2 on and off
alternately, the single electrons are transferred from the source to the drain, like
conventional charge-coupled devices (CCDs). Fig. 1 (b) shows a SEM picture of the SE
turnstile (Fujiwara, 2004). Fig. 1(c) shows the equivalent circuit of the SE turnstile, which
includes a source S, a drain D, a gate voltage terminal G and two clock voltage terminals clk1
and clk2. In the following circuits, the source of the SE turnstile is connected to a supply
voltage, V
ss
or –V
ss
. The drain V
D
is always connected to an electron storage node (SN), and
it can be regarded as virtually grounded. The single electrons can be injected into the SN or
ejected from the SN through the SE turnstile (Zhang, 2007a). The number of electrons in the
SN can be detected by using the single-electron transistor as an electrometer. Experimentally,
a SN with small capacitance C
SN
can be realized by a silicon nanodot on SOI wafer.
Fig. 1(d) shows the pulse sequences for V
clk1
and V
clk2
applied to the gates of FET1 and FET2,
respectively. The SE turnstile operation requires two repulsive voltage pulses with a duty
cycle less than 50%. Fig. 1(e) shows how the electrons are transferred from the source to the
SN, according to steps (i)-(iv) shown in Fig. 1(d). The source of the SE turnstile is biased by –
V
ss
and V
G
is negative. When both FET1 and FET2 are turned off, a single-electron-box (SEB)
is electrically formed. Note that, the size of the SEB is much smaller than its lithography
definition, due to the barriers of the two MOSFETs. The SEB is small enough to activate the
Coulomb blockade effect. Since the SEB and source are separated by FET1, the potential of
the SEB is only controlled by the gate voltage V
G
via electrical coupling. Therefore, the
number of captured electrons N
s
is determined by the difference between V
G
and –V
ss
.
Assuming an ideal case at working temperature T=0, N
s
is given by (Zhang, 2008):
N
s
=0, if V
G
≤-V
ss
;
N
s
=[(V
G
+V
ss
)/V
0
+1/2], V
0
=e/C
u
g
, if V
G
≤-V
ss.
(1)
where V
0
is defined as constant logic value 1, C
ug
is the capacitance between the gate and the
SEB, and [X] denotes the maximum integer which is smaller than X. When FET2 is turned
on, the SEB is connected to the SN [step (iii)]. The capacitance of SN C
SN
is much larger than
the capacitance of the SEB, so when the electrons enter the SN, its potential change can not
affect the behavior of the SE turnstile and thus can be neglected. Therefore we assume the
potential of the SN is always 0V for simplicity. When V
G
<0, the potential of the SEB is
higher than the SN so that all single electrons flow into the SN. In this case, the number
N=N
s
of electrons transferred depends exclusively on V
G
. On the other hand, when V
G
>0,
not all electrons flow out of the SEB. In this case N only depends on the potential difference
between the source and the SN. Finally FET2 is turned off [step (iv)], and a transfer cycle is
finished. In summary, when the SE turnstile injects electrons into the SN, N is given by:
N=0, if V
G
≤-V
ss
;
N=[C
g
(V
G
+V
ss
)/e+1/2], if -V
ss
<V
G
<0;
N=[C
g
V
ss
/e+1/2], if V
G
≥0.
(2)
Similarly, electrons can be ejected from the SN. In this case the source of the SE turnstile is
connected to V
ss
and V
G
is positive. In this case, the number of captured electrons N
d
in the
SEB is determined by the potential difference between the SEB and SN. In step (iii) and step
ArithmeticCircuitsRealizedbyTransferringSingleElectrons 325
its operand length n, so that the operation speed of ripple-carry adder is low. Carry look-
ahead adder can reduce t
d
to the order of logn, but circuit area are largely increased. An
interesting family of adders use non-binary arithmetic algorithms based on high-radix
number systems or redundant number systems, such as the signed-digit (SD) adders
(Avizienis, 1961) and the redundant-binary (RB) adders (Takagi, 1985). Because the carry
propagations in these adders are restricted only to adjoining cells, it is possible to perform
addition of two operands in constant time which is not dependent on n (Parhami, 1990;
Parhami, 1993). Hereafter these non-binary adders are referred to as fast adders. Fast adders
have promising characteristics, but their compact and efficient implementation still remains
a big challenge. The conventional approaches use binary MOS logic gates to implement non-
binary algorithms so that the adders are complex in circuit structure and are thus hard to
design. Moreover, each type of fast adders requires specific consideration to optimize its
performance. On the other hand, the multiple-valued current-mode logic (MVCL) approach
can significantly reduce the number of devices in the circuit (Kawahito, 1988). However,
MVCL suffers from relatively large power dissipation and it results in low overall area-time-
power performances. Although novel approach using negative differential-resistance
devices can greatly reduces the number of transistors (Gonzalez, 1998), it is only specific to
one particular kind of fast adder.
In this chapter, we proposed circuit architecture and design methods to implement novel
fast adders and fast multipliers by transferring & storing single electrons. We use the number
of electrons to represent different logic values and we perform arithmetic operations by
accurately manipulating electrons. We propose general fast single-electron adder
architecture based on non-binary arithmetic and design methods to implement various fast
adder circuits. We adopt the counter tree diagram (CTD) (Sakiyama, 2003) to represent and
analyze our fast adders, and we use the MOSFET-based single-electron turnstile as the basic
circuit element. We used the unique characteristic of MOSFET-based single-electron
turnstile to finish complicated fast-addition arithmetic operations compactly. We propose
two design styles to implement fast adder circuit blocks: the threshold approach and the
periodic approach. The proposed adder circuits have several advantages: 1) The operation
speeds are high; 2) The circuit structures are compact and the number of devices is small; 3)
The power dissipations are much lower than conventional circuits; 4) The circuit design
method based on the CTD is very simple and can be applied to a wide range of adders. In
the following sections, first we introduce the background of single-electron devices and
operation principle of MOSFET-based single-electron turnstile. Then we introduce fast
addition algorithms and the circuit architecture to perform non-binary fast addition by
transferring single-electrons. Then we introduce a family of SE transfer circuits based on
MOSFET-based SE turnstile. Next we show the principles of the threshold approach and the
periodic approach, and we show adder design examples for each approach. After that we
study and compare the performances of the proposed adders. Finally, we summarize the
results.
2. MOSFET-based Single Electron Turnstile
2.1 Working Principle
First we introduce the basic device of our work: the single-electron (SE) turnstile. MOSFET-
based single-electron turnstile is a very promising SE transfer device, which could
accurately control the number of transferred electrons using the Coulomb blockade effect
(Fujiwara, 2008). Room-temperature (RT) operation of a SE multilevel memory and RT
operation of a digital-analog converter circuit (Nishiguchi, 2006) consisting of MOSFET-based
SE turnstiles have been experimentally demonstrated. Fig. 1(a) shows the device structure of
the SE turnstile. The turnstile has two MOSFETs, FET1 and FET2. The FET1 and FET2 are
gate-all-around Si-nanowire MOSFETs on SOI wafer. By turning FET1 and FET2 on and off
alternately, the single electrons are transferred from the source to the drain, like
conventional charge-coupled devices (CCDs). Fig. 1 (b) shows a SEM picture of the SE
turnstile (Fujiwara, 2004). Fig. 1(c) shows the equivalent circuit of the SE turnstile, which
includes a source S, a drain D, a gate voltage terminal G and two clock voltage terminals clk1
and clk2. In the following circuits, the source of the SE turnstile is connected to a supply
voltage, V
ss
or –V
ss
. The drain V
D
is always connected to an electron storage node (SN), and
it can be regarded as virtually grounded. The single electrons can be injected into the SN or
ejected from the SN through the SE turnstile (Zhang, 2007a). The number of electrons in the
SN can be detected by using the single-electron transistor as an electrometer. Experimentally,
a SN with small capacitance C
SN
can be realized by a silicon nanodot on SOI wafer.
Fig. 1(d) shows the pulse sequences for V
clk1
and V
clk2
applied to the gates of FET1 and FET2,
respectively. The SE turnstile operation requires two repulsive voltage pulses with a duty
cycle less than 50%. Fig. 1(e) shows how the electrons are transferred from the source to the
SN, according to steps (i)-(iv) shown in Fig. 1(d). The source of the SE turnstile is biased by –
V
ss
and V
G
is negative. When both FET1 and FET2 are turned off, a single-electron-box (SEB)
is electrically formed. Note that, the size of the SEB is much smaller than its lithography
definition, due to the barriers of the two MOSFETs. The SEB is small enough to activate the
Coulomb blockade effect. Since the SEB and source are separated by FET1, the potential of
the SEB is only controlled by the gate voltage V
G
via electrical coupling. Therefore, the
number of captured electrons N
s
is determined by the difference between V
G
and –V
ss
.
Assuming an ideal case at working temperature T=0, N
s
is given by (Zhang, 2008):
N
s
=0, if V
G
≤-V
ss
;
N
s
=[(V
G
+V
ss
)/V
0
+1/2], V
0
=e/C
u
g
, if V
G
≤-V
ss.
(1)
where V
0
is defined as constant logic value 1, C
ug
is the capacitance between the gate and the
SEB, and [X] denotes the maximum integer which is smaller than X. When FET2 is turned
on, the SEB is connected to the SN [step (iii)]. The capacitance of SN C
SN
is much larger than
the capacitance of the SEB, so when the electrons enter the SN, its potential change can not
affect the behavior of the SE turnstile and thus can be neglected. Therefore we assume the
potential of the SN is always 0V for simplicity. When V
G
<0, the potential of the SEB is
higher than the SN so that all single electrons flow into the SN. In this case, the number
N=N
s
of electrons transferred depends exclusively on V
G
. On the other hand, when V
G
>0,
not all electrons flow out of the SEB. In this case N only depends on the potential difference
between the source and the SN. Finally FET2 is turned off [step (iv)], and a transfer cycle is
finished. In summary, when the SE turnstile injects electrons into the SN, N is given by:
N=0, if V
G
≤-V
ss
;
N=[C
g
(V
G
+V
ss
)/e+1/2], if -V
ss
<V
G
<0;
N=[C
g
V
ss
/e+1/2], if V
G
≥0.
(2)
Similarly, electrons can be ejected from the SN. In this case the source of the SE turnstile is
connected to V
ss
and V
G
is positive. In this case, the number of captured electrons N
d
in the
SEB is determined by the potential difference between the SEB and SN. In step (iii) and step
CuttingEdgeNanotechnology326
(iv), electrons flow out of the SEB to the source. When V
G
<V
ss
, the potential of the SEB is
higher than the source, and all electrons flow out of the SEB. So N=N
d
also depends
exclusively on V
G
. On the other hand, when V
G
>V
ss
, the potential of the SEB is lower than
the source, and not all electrons flow out of the SEB. In this case N also only depends on V
ss
.
In summary, when the SE turnstile ejects electrons from the SN, N is given by:
N=0, if V
G
≤0;
N=[C
g
V
G
/e+1/2], if 0<V
G
<V
ss
;
N=[C
g
V
ss
/e+1/2] , if V
G
≥V
ss
.
(3)
The relationships between N and V
G
, V
ss
are summarized in Fig. 2(a). From equations (2)
and (3) we see that, the gate voltage V
G
directly controls N. Fig. 2(b) shows the relationship
between N and V
G
when V
ss
is large enough. N is a periodical staircase function of V
G
. This
unique characteristic of SE turnstile makes the single-electron transfer highly flexible.
The parameters of the SE turnstile are determined as follows. Transfer error may occur in
the transfer cycle. To reduce transfer errors, the capacitance of the SEB C
SEB
must be small
enough. Since a 0.76aF C
SEB
was reported (Nishiguchi, 2006), we choose C
SEB
=0.7aF and we
choose T=60K to ensure low transfer error rate. We choose C
ug
=0.53aF so that V
0
=0.3V, and
thus the circuit can have large noise margin.
Fig. 1. (a) Device structure of the MOSFET-based SE turnstile. (b) SEM picture of the SE
turnstile (Fujiwara, 2004). (c) Equivalent circuit of the SE turnstile. The drain connects to a
storage node (SN). (d) Repulsive clock pulses for the SE turnstile operation. (e) Schematic
diagram to accurately inject electrons into the SN. A transfer cycle has 4 steps.
Fig. 2. (a) Relationship between the transfer electron number N with gate voltage and source
voltage; (b) N as a function of gate voltage.
2.2 SPICE Simulation Model
Although the MOSFET-based turnstile is composed of MOSFETs, its behavior can not be
directly simulated by SPICE because SPICE always assume that currents are continuous and
thus can not handle the stochastic behavior of SE transfer. We proposed a behavioral SPICE
model to simulate the MOSFET-based SE turnstile (Zhang, 2007c; Zhang 2008). The
simplified model schematic is shown in Fig. 3. The most essential points of the model are: 1)
to represent the discrete single-charge transfer event as a δ-type current i
t
=eδ(t-t
0
), where t
0
is
the time of the transfer event; 2) to model the stochastic electron transfer by using random
number generator. Although the transfer event is a complex random process, we assume
that t
0
is the time when
0
0
)(
t
d
dttIep
(4)
where I
d
(t) is the current through the MOSFET and p is a random number distributed
uniformly from 0 to 1, which represents the randomness of the transfer process.
In the model, the SEB is modeled as a pure capacitor with capacitance C
SEB
. G1 is a voltage-
controlled current mirror of I
1
, and it is controlled by the output of module P1. With the
falling clock of clk1, C
SEB
is charged and its voltage V
SEB
is feed back to module P1. The
number of electrons stored in the SEB N
SEB
is controlled by V
g
. When V
SEB
> N
SEB
e/C
SEB
, the
output of P1 shut off G1, so the equivalent charge stored in the SEB is exactly N
SEB
e. A noise
source generates a noise voltage to module P1, so N
SEB
is randomly changed by the noise
voltage with a possibility ε, and ε corresponds to the transfer error rate of the SE turnstile.
With clk1, N
SN
electrons are equivalently stored in C
SEB
. With the rising clock of clk2, these
electrons are transferred from C
SEB
to drain one by one. G2 is a current mirror of I
2
. With the
rising clock of clk2, G2 charges C
E
. When the charge on C
E
is larger than ep in (4), we assume
that a SE transfer event will happen. Then the output of module P2 resets the charge on C
E
to 0 and transiently enables G3 so that G3 outputs a delta-shape current pulse, as shown in
Fig. 3. The area of the delta-shape current pulse is exactly e, and we use this current pulse to
represent SE transfer. G3 is transiently opened for N times until all electron flow to the drain.
ArithmeticCircuitsRealizedbyTransferringSingleElectrons 327
(iv), electrons flow out of the SEB to the source. When V
G
<V
ss
, the potential of the SEB is
higher than the source, and all electrons flow out of the SEB. So N=N
d
also depends
exclusively on V
G
. On the other hand, when V
G
>V
ss
, the potential of the SEB is lower than
the source, and not all electrons flow out of the SEB. In this case N also only depends on V
ss
.
In summary, when the SE turnstile ejects electrons from the SN, N is given by:
N=0, if V
G
≤0;
N=[C
g
V
G
/e+1/2], if 0<V
G
<V
ss
;
N=[C
g
V
ss
/e+1/2] , if V
G
≥V
ss
.
(3)
The relationships between N and V
G
, V
ss
are summarized in Fig. 2(a). From equations (2)
and (3) we see that, the gate voltage V
G
directly controls N. Fig. 2(b) shows the relationship
between N and V
G
when V
ss
is large enough. N is a periodical staircase function of V
G
. This
unique characteristic of SE turnstile makes the single-electron transfer highly flexible.
The parameters of the SE turnstile are determined as follows. Transfer error may occur in
the transfer cycle. To reduce transfer errors, the capacitance of the SEB C
SEB
must be small
enough. Since a 0.76aF C
SEB
was reported (Nishiguchi, 2006), we choose C
SEB
=0.7aF and we
choose T=60K to ensure low transfer error rate. We choose C
ug
=0.53aF so that V
0
=0.3V, and
thus the circuit can have large noise margin.
Fig. 1. (a) Device structure of the MOSFET-based SE turnstile. (b) SEM picture of the SE
turnstile (Fujiwara, 2004). (c) Equivalent circuit of the SE turnstile. The drain connects to a
storage node (SN). (d) Repulsive clock pulses for the SE turnstile operation. (e) Schematic
diagram to accurately inject electrons into the SN. A transfer cycle has 4 steps.
Fig. 2. (a) Relationship between the transfer electron number N with gate voltage and source
voltage; (b) N as a function of gate voltage.
2.2 SPICE Simulation Model
Although the MOSFET-based turnstile is composed of MOSFETs, its behavior can not be
directly simulated by SPICE because SPICE always assume that currents are continuous and
thus can not handle the stochastic behavior of SE transfer. We proposed a behavioral SPICE
model to simulate the MOSFET-based SE turnstile (Zhang, 2007c; Zhang 2008). The
simplified model schematic is shown in Fig. 3. The most essential points of the model are: 1)
to represent the discrete single-charge transfer event as a δ-type current i
t
=eδ(t-t
0
), where t
0
is
the time of the transfer event; 2) to model the stochastic electron transfer by using random
number generator. Although the transfer event is a complex random process, we assume
that t
0
is the time when
0
0
)(
t
d
dttIep
(4)
where I
d
(t) is the current through the MOSFET and p is a random number distributed
uniformly from 0 to 1, which represents the randomness of the transfer process.
In the model, the SEB is modeled as a pure capacitor with capacitance C
SEB
. G1 is a voltage-
controlled current mirror of I
1
, and it is controlled by the output of module P1. With the
falling clock of clk1, C
SEB
is charged and its voltage V
SEB
is feed back to module P1. The
number of electrons stored in the SEB N
SEB
is controlled by V
g
. When V
SEB
> N
SEB
e/C
SEB
, the
output of P1 shut off G1, so the equivalent charge stored in the SEB is exactly N
SEB
e. A noise
source generates a noise voltage to module P1, so N
SEB
is randomly changed by the noise
voltage with a possibility ε, and ε corresponds to the transfer error rate of the SE turnstile.
With clk1, N
SN
electrons are equivalently stored in C
SEB
. With the rising clock of clk2, these
electrons are transferred from C
SEB
to drain one by one. G2 is a current mirror of I
2
. With the
rising clock of clk2, G2 charges C
E
. When the charge on C
E
is larger than ep in (4), we assume
that a SE transfer event will happen. Then the output of module P2 resets the charge on C
E
to 0 and transiently enables G3 so that G3 outputs a delta-shape current pulse, as shown in
Fig. 3. The area of the delta-shape current pulse is exactly e, and we use this current pulse to
represent SE transfer. G3 is transiently opened for N times until all electron flow to the drain.
CuttingEdgeNanotechnology328
Fig. 3. SPICE circuit model of MOSFET-based single-electron turnstile
2.3 Electron Transfer Circuit Elements
Fig. 4 shows a family of SE transfer circuits using the MOSFET-based SE turnstile. These
basic electron transfer circuits sever as the basic building blocks of single-electron arithmetic
circuits. The circuit symbol of SE turnstile has terminals G, S and D. The linear ejector (LE) is
simply a SE turnstile. It ejects N electrons from the SN per cycle and N depends on V
G
according to (3). After one cycle, N
SN
is decreased by N. In the linear injector (LI), V
G
is
summed with -V
ss
by a voltage adder and is then connected to the G terminal of the SE
turnstile. The relationship between N and V
G
is same as in the LE, according to (2). The fixed
ejector (FE) has an E terminal. The clk2 terminal of the SE turnstile connects a PMOS
transistor in series, and E connects the gate of the PMOS transistor. The G terminal of the SE
turnstile connects a constant bias V
G
=NV
0
. When we apply high voltage (V
ss
) to E, the PMOS
transistor cuts off, and no electrons are transferred by the SE turnstile. When we apply low
voltage (-V
ss
) to E, the PMOS transistor turns on and N electrons are ejected per cycle.
Similarly the fixed injector (FI) also has an E terminal and it injects N electrons into the SN
per cycle if we apply -V
ss
to E.
Fig. 5 shows the schematics and functions of other useful circuit elements. The voltage adder
is simply composed of capacitors with equal capacitances. The voltage divider consists of
two capacitors C
1
and C
2
. The function of the voltage divider is V
out
=V
in
/f, where
f=(C
1
+C
2
)/C
1
is the division factor. The threshold inverter is a CMOS inverter and its logic
threshold value is set to (t-1/2)V
0
, where t is a designated integer. The reset circuit is a
NMOS transistor with its drain connected to the ground. When a clock pulse is applied, all
electrons flow out of the SN and the logic value of the SN is reset to 0.
The charge-voltage converter is a SET/MOS hybrid circuit and can readout the number of
electrons stored in the SN. It consists of a dual gate SET, a PMOS transistor as a constant
current source, and a NMOS transistor as a cascode device. The operation principle and
implementation details of the SET/MOS hybrid circuit were investigated (Zhang, 2007b).
The SET acts as a very sensitive electrometer. The output voltage of the SET/MOS hybrid
circuit depends linearly on the input voltage and it can accurately represent N
SN
, as shown
in Fig. 5.
Fig. 4. A family of SE transfer circuits based on MOSFET-based SE turnstiles. The schematic
includes the symbol of the SE turnstile.
Fig. 5. Symbol, circuit schematic and function of other useful circuit elements.
3. Architecture of Single-electron Fast Adder
3.1 Fast addition algorithm and counter tree diagram (CTD)
The number system in the fast adder belongs to a generalized signed-digit (GSD) number
system (Parhami, 1990). The operands belong to the digit set {-α, α+1, , β}, where both α and
β are positive integers or zero. The redundancy index ρ of the GSD number system is
defined as ρ=α+β+1-r, where r is the number representation radix. For limited carry
propagation, ρ must be larger than 0. The algorithms of the fast adders have been
intensively studied. According to the number system used and its redundancy, the fast
addition algorithms can be classified into many categories, such as carry-free, limited-carry,
stored-carry, etc. Given a particular number system, there may be several valid choices for
the range of carries and intermediate variables. Because these algorithms are quite
complicated, it is difficult to image a circuit schematic only from definitions and equations.
ArithmeticCircuitsRealizedbyTransferringSingleElectrons 329
Fig. 3. SPICE circuit model of MOSFET-based single-electron turnstile
2.3 Electron Transfer Circuit Elements
Fig. 4 shows a family of SE transfer circuits using the MOSFET-based SE turnstile. These
basic electron transfer circuits sever as the basic building blocks of single-electron arithmetic
circuits. The circuit symbol of SE turnstile has terminals G, S and D. The linear ejector (LE) is
simply a SE turnstile. It ejects N electrons from the SN per cycle and N depends on V
G
according to (3). After one cycle, N
SN
is decreased by N. In the linear injector (LI), V
G
is
summed with -V
ss
by a voltage adder and is then connected to the G terminal of the SE
turnstile. The relationship between N and V
G
is same as in the LE, according to (2). The fixed
ejector (FE) has an E terminal. The clk2 terminal of the SE turnstile connects a PMOS
transistor in series, and E connects the gate of the PMOS transistor. The G terminal of the SE
turnstile connects a constant bias V
G
=NV
0
. When we apply high voltage (V
ss
) to E, the PMOS
transistor cuts off, and no electrons are transferred by the SE turnstile. When we apply low
voltage (-V
ss
) to E, the PMOS transistor turns on and N electrons are ejected per cycle.
Similarly the fixed injector (FI) also has an E terminal and it injects N electrons into the SN
per cycle if we apply -V
ss
to E.
Fig. 5 shows the schematics and functions of other useful circuit elements. The voltage adder
is simply composed of capacitors with equal capacitances. The voltage divider consists of
two capacitors C
1
and C
2
. The function of the voltage divider is V
out
=V
in
/f, where
f=(C
1
+C
2
)/C
1
is the division factor. The threshold inverter is a CMOS inverter and its logic
threshold value is set to (t-1/2)V
0
, where t is a designated integer. The reset circuit is a
NMOS transistor with its drain connected to the ground. When a clock pulse is applied, all
electrons flow out of the SN and the logic value of the SN is reset to 0.
The charge-voltage converter is a SET/MOS hybrid circuit and can readout the number of
electrons stored in the SN. It consists of a dual gate SET, a PMOS transistor as a constant
current source, and a NMOS transistor as a cascode device. The operation principle and
implementation details of the SET/MOS hybrid circuit were investigated (Zhang, 2007b).
The SET acts as a very sensitive electrometer. The output voltage of the SET/MOS hybrid
circuit depends linearly on the input voltage and it can accurately represent N
SN
, as shown
in Fig. 5.
Fig. 4. A family of SE transfer circuits based on MOSFET-based SE turnstiles. The schematic
includes the symbol of the SE turnstile.
Fig. 5. Symbol, circuit schematic and function of other useful circuit elements.
3. Architecture of Single-electron Fast Adder
3.1 Fast addition algorithm and counter tree diagram (CTD)
The number system in the fast adder belongs to a generalized signed-digit (GSD) number
system (Parhami, 1990). The operands belong to the digit set {-α, α+1, , β}, where both α and
β are positive integers or zero. The redundancy index ρ of the GSD number system is
defined as ρ=α+β+1-r, where r is the number representation radix. For limited carry
propagation, ρ must be larger than 0. The algorithms of the fast adders have been
intensively studied. According to the number system used and its redundancy, the fast
addition algorithms can be classified into many categories, such as carry-free, limited-carry,
stored-carry, etc. Given a particular number system, there may be several valid choices for
the range of carries and intermediate variables. Because these algorithms are quite
complicated, it is difficult to image a circuit schematic only from definitions and equations.