TECHNOLOGY AND ENGINEERING APPLICATIONS OF SIMULINK pot
Bạn đang xem bản rút gọn của tài liệu. Xem và tải ngay bản đầy đủ của tài liệu tại đây (10.51 MB, 266 trang )
TECHNOLOGY AND
ENGINEERING
APPLICATIONS OF
SIMULINK
Edited by S.C. Chakravarty
Technology and Engineering Applications of Simulink
Edited by S.C. Chakravarty
Published by InTech
Janeza Trdine 9, 51000 Rijeka, Croatia
Copyright © 2012 InTech
All chapters are Open Access distributed under the Creative Commons Attribution 3.0
license, which allows users to download, copy and build upon published articles even for
commercial purposes, as long as the author and publisher are properly credited, which
ensures maximum dissemination and a wider impact of our publications. After this work
has been published by InTech, authors have the right to republish it, in whole or part, in
any publication of which they are the author, and to make other personal use of the
work. Any republication, referencing or personal use of the work must explicitly identify
the original source.
As for readers, this license allows users to download, copy and build upon published
chapters even for commercial purposes, as long as the author and publisher are properly
credited, which ensures maximum dissemination and a wider impact of our publications.
Notice
Statements and opinions expressed in the chapters are these of the individual contributors
and not necessarily those of the editors or publisher. No responsibility is accepted for the
accuracy of information contained in the published chapters. The publisher assumes no
responsibility for any damage or injury to persons or property arising out of the use of any
materials, instructions, methods or ideas contained in the book.
Publishing Process Manager Romina Skomersic
Technical Editor Teodora Smiljanic
Cover Designer InTech Design Team
First published May, 2012
Printed in Croatia
A free online edition of this book is available at www.intechopen.com
Additional hard copies can be obtained from
Technology and Engineering Applications of Simulink, Edited by S.C. Chakravarty
p. cm.
ISBN 978-953-51-0635-7
Contents
Preface IX
Chapter 1 Analysis of Power Electronic
Controllers in Electric Power Systems Using Simulink 1
Juan Segundo-Ramirez and A. Medina
Chapter 2 Study of Inductive-Capacitive
Series Circuits Using the Simulink Software Package 19
Titu Niculescu
Chapter 3 Fixed Transmission Media 41
Rastislav Róka
Chapter 4 Co-Simulation Procedure for
PID and Fuzzy Logic Active Controls
Strategies Applied to a Sprayers Boom Suspension 69
Cristiano Okada Pontelli and Mario Francisco Mucheroni
Chapter 5 S-Function Library for
Bond Graph Modeling 97
B. Umesh Rai
Chapter 6 From Control Design to
FPGA Implementation 129
Marcus Müller,
Hans-Christian Schwannecke and Wolfgang Fengler
Chapter 7 Describing Function Recording with
Simulink and MATLAB 149
Krunoslav Horvat, Ognjen Kuljaca and Tomislav Sijak
Chapter 8 Performance Evaluation of a Temperature
Control Stage Used on a Semiconductor Gas
Sensor 3D Electro-Thermal Model Through Simulink
®
167
E.N. Vázquez-Acosta, S. Mendoza-Acevedo,
M.A. Reyes-Barranca, L.M. Flores-Nava,
J.A. Moreno-Cadenas and J.L. González-Vidal
VI Contents
Chapter 9 Matlab Simulink
®
Model of
a Braked Rail Vehicle and Its Applications 189
Grażyna Barna
Chapter 10 Using of Hybrid Supply for Electric or Hybrid Vehicles 219
N. Rizoug, G. Feld, B. Barbedette and R. Sadoun
Chapter 11 The Uses of Artificial Intelligence for
Electric Vehicle Control Applications 239
Brahim Gasbaoui and Abdelfatah Nasri
Preface
Building on MATLAB (the language of technical computing), Simulink provides a
platform for engineers to plan, model, design, simulate, test and implement complex
electromechanical, dynamic control, signal processing and communication systems.
Simulink-Matlab combination is very useful for developing algorithms, GUI assisted
creation of block diagrams and realisation of interactive simulation based designs. The
eleven chapters of the book demonstrate the power and capabilities of Simulink to
solve engineering problems with varied degree of complexity in the virtual
environment. The first four chapters provide details of design, analysis, simulation
and implementation of flexible AC transmission system devices to control the power
variables, multi-component electric circuits, signal transmission through power
distribution lines of different kinds and PID/fuzzy logic control of a boom suspension.
Details of enhanced capabilities in simulation effects constitute the subject matter of
the next three chapters on S-functions for custom made subroutines and bond graph
models, development of model and HDL code on FPGA system and harmonic
linearization method of non-linear characteristics of modulation techniques. The last
four chapters deal with examples of electromagnetic and dynamic systems of thermo-
electrical micro hot plate with temperature control circuit, braked railed vehicle wheel
slide protection, replacement in a car battery by a hybrid supply of battery and super
capacitors and a novel speed control logic for electric vehicle. I hope that both
newcomers and professionals in the field would benefit by going through the details
given in the above chapters of the book.
S.C. Chakravarty
Scientist (retired), Indian Space Research Organisation (ISRO), Bangalore or Hon
Senior Professor, Indian Centre for Space Physics (ICSP), Kolkata,
India
1
Analysis of Power Electronic Controllers in
Electric Power Systems Using Simulink
Juan Segundo-Ramirez
1
and A. Medina
2
1
Universidad Autónoma de San Luis Potosí
2
Universidad Michoacana de San Nicolás de Hidalgo
México
1. Introduction
Flexible ac Transmission Systems (FACTS) devices have emerged in power system because
of the development of power electronics components for high voltage and power. The
FACTS devices provide higher controllability in power systems by means of power
electronic devices. Several FACTS equipments have been already introduced for various
applications worldwide, and new types of FACTS are in the stage of being introduced in
practice. FACTS technology provides a better ability to varying operational conditions and
improves the usage of existing installations.
2. Power electronic application in transmission systems
It can be seen that with growing line length and with higher power demand the opportunity
for FACTS devices gets more important. The devices work electrically as fast current,
voltage or impedance controllers. The power electronic allows very short reaction times
down to far below one second (~ms). Detailed introductions in FACTS devices can also be
found in the literature (Hingorani & Gyudyi, 2000) (Acha, et al. 2004) (Mathur & Varma,
2002)(Padiyar, 2007) (Zhang, Rehtanz, & Pal, 2006) with the main focus on new topologies,
modeling and control.
Basically, there are two groups of FACTS, one is based on thyristor valve operation
(Hingorani & Gyudyi, 2000), and the other is based on Voltage Source Converters (VSCs)
(Segundo-Ramírez & Medina, 2008) (Segundo-Ramírez & Medina, 2009). A list of some
FACTS devices are shown in Table 1. The FACTS devices based on VSCs provide a
controllable voltage magnitude and phase angle due to a Pulse Width Modulation (PWM)
technique (Mohan, Underland, & Robins, 1995). The Static Compensator (STATCOM)
(Hingorani & Gyudyi, 2000) is a shunt connected device that is able to provide reactive
power support at a network location far away from the generators. Through this reactive
power injection, the STATCOM can regulate the voltage at the connection node. The Static
Synchronous Series compensator (SSSC) (Hingorani & Gyudyi, 2000) is a series device
which injects a voltage in series with the transmission line. The Unified Power Flow
Controller (UPFC) (Hingorani & Gyudyi, 2000) is the most versatile device of the family of
FACTS devices, since it is able to control the active and the reactive power, respectively, as
Technology and Engineering Applications of Simulink
2
well as the voltage at the connection node. In Figure 1 a schematic representation of the
STATCOM, the SSSC, and the UPFC are presented. The compensating FACTS devices under
analysis in this chapter are briefly described below.
Table 1. Overview of the principal FACTS-Devices.
Fig. 1. FACTS devices based on VSCs. (a) STATCOM, (b) SSSC, and (c) UPFC.
2.1 Static compensator (STATCOM)
It is a shunt device that does not require passive elements for reactive compensation. The
STATCOM operation is based on a VSC, which is supplied by a dc storage capacitor. The
VSC terminals are connected to the dc system through a coupling transformer. The VSC
produces a quasi-sine wave voltage at the fundamental frequency (50 or 60 Hz). The
STATCOM can generate or absorb reactive power. A schematic representation of the
STATCOM is shown in Figure 1(a).
Assuming that the losses in the VSC and the coupling transformer are negligible, v
statcom
is in
phase with the voltage at the terminal bus v
k
. In this situation, the current i
statcom
is completely
reactive. If the magnitude of the voltage v
k
is higher than the magnitude of v
statcom
, the reactive
current flows from the bus to the VSC, which means that the STATCOM absorbs reactive
power. On the other hand, if the magnitude of v
statcom
is higher than the magnitude of v
k
, the
reactive current flows from the VSC to the ac system. Then, the STATCOM injects reactive
power to the system. In practice, the power losses of the STATCOM are not negligible and
must be drawn from the ac system to maintain constant the dc capacitor voltage.
Connection Type
FACTS Devices
Thyristor-Based FACTS VSC-Based FACTS
Shunt Connected Static Var Compensator (SVC) Static Compensator (STATCOM)
Series Connected
Thyristor Controlled Series
Compensator (TCSC)
Static Series Synchronous
Compensator (SSSC)
Back-to-Back Connected HVDC
Unified Power Flow Controller
(UPFC)
HVDC VSC
Analysis of Power Electronic Controllers in Electric Power Systems Using Simulink
3
2.2 Static synchronous series compensator (SSSC)
The SSSC is a series device in which a synchronous voltage source injects a fundamental
frequency voltage in series with the transmission line through a coupling transformer. The
synchronous voltage source is supplied by a VSC. A schematic representation of the SSSC is
shown in Figure 1(b).
Ideally, the injected voltage is in quadrature with the line current. In this mode the VSC
does not absorb or inject any real power. However, in practice, the VSC losses must be
replenished by the ac system, in consequence a small phase lag is introduced for this
purpose. The operating characteristics make this device very attractive for power
transmission application. The main limitation of application is due to the losses and cost of
the converter. The SSSC is a device which has so far not been built at transmission level
because Series Compensator (fixed capacitor) and thyristor controlled series capacitor
(TCSC) (Hingorani & Gyudyi, 2000) are fulfilling all the today’s operational requirements at
a low cost.
2.3 Unified power flow controller (UPFC)
This device contains two VSCs connected together through a dc link storage capacitor. One
of the VSCs is connected in series with the transmission line, while the other VSC is
connected in shunt with the transmission line. The UPFC can control the active and reactive
power flow in the transmission line, and at the same time can regulate the voltage
magnitude at the connection node. To control the real and reactive power flow in the series
side, the UPFC allows interchange of real power between the shunt and the series
converters. The main disadvantage of this device is the high cost level due to the complex
systems setup (Zhang, Rehtanz, & Pal, 2006). A schematic representation of the UPFC is
shown in Figure 1(c).
3. PSB/SIMULINK
Power System Blockset (PSB) for use with Matlab/Simulink employs state-variable
analysis. In PSB complex control algorithms can be implemented into the models in an
easy and fast way. Besides, PSB can use several Matlab toolboxes. In particular, it has the
PWM generator and the VSC blocks. The main advantage of the PSB is that it is
developed in Matlab/Simulink environment, this fact makes possible to use it together
with several other control design tools. It is possible to use the Simulink Accelerator and
the Real-Time Workshop to improve the PSB performance; a C code is generated.
Additionally, the PSB can use several integration methods, which make it a powerful
simulation tool.
3.1 Modeling and analysis of FACTS by PSB/SIMULINK
This section is divided into three parts. Simulations relating to the STATCOM are presented
first. This is followed by simulations carried out for the SSSC and then for the UPFC. The
study case related to the STATCOM is described in detail using PSB/Simulink. For the cases
of the SSSC and the UPFC, only the general implementation is described.
Technology and Engineering Applications of Simulink
4
3.2 Static compensator (STATCOM)
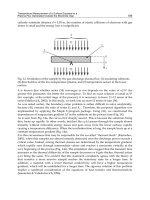
The test case is shown in Figure 2, where the STATCOM includes the control system
described in (Mahyavanshi & Radman, 2006). The initial conditions are zero, the reference
line to line voltage is 179.6292 volts at node 1, the reference voltage for the dc capacitor is
500 volts, and the modulation index is m
f
=15 (900 Hz). The shunt transformer, the line 1 and
the line 2 are represented by RL branches, whose impedances are0.05 + × 0.005Ω,
0.2 + × 0.015Ω, and 0.15 + × 0.01Ω, respectively. The Figure 3 shows the PI control
used in this analysis. On the other hand, Figure 4 shows some important blocks parameters
of the system. Figure 4 shows some important block of parameters for some components
shown in Figure 2 and Figure 3. Please notice that a passive filter has been connected at bus
1, in order to drain the harmonic currents.
Fig. 2. Test system including the STATCOM.
The test case is initially in periodic steady state, at = 0.05, the voltage magnitude of the
three-phase programmable voltage source is increased 15%, and finally at = 0.35, the
initial operating point is reestablished. The study for the STATCOM is divided in two parts,
firstly the three-phase breaker is open, and consequently the passive filter is disconnected.
In the second part, the three-phase breaker is closed allowing the filtering function. The
passive filter is represented as a RC branch with = 80 and = 0.5Ω.
In the Figure 5, some selected transient waveforms of the STATCOM without the passive
filter are shown: Figure 5(a) presents the output of the phase controller, alfaE, which is
actually the phase angle of the voltage at the ac terminals of the VSC; Figure 5(b) presents
the output of the magnitude control, which is the half part of the voltage magnitude at the
ac terminal of the VSC; Figure 5(c) shows the voltage across the dc capacitor, and finally, the
Analysis of Power Electronic Controllers in Electric Power Systems Using Simulink
5
peak line-to-neutral voltage at the bus 1 is shown in Figure 5(d). Figure 6 shows the steady
state waveform of the voltage at the bus 1 at the top of the figure, and its harmonic spectrum
at the bottom of the figure. The Figure 6 was obtained using the FFT Analysis button in the
powergui block.
In the Figure 7, some selected transient waveforms of the STATCOM with the passive filter
are shown: Figure 7(a) presents the output of the phase controller; Figure 7(b) presents the
output of the magnitude control; Figure 7(c) shows the voltage across the dc capacitor, and
finally, the peak line-to-neutral voltage at the bus 1 is shown in Figure 7(d). Figure 8 shows
the steady state waveform of the voltage at the bus 1 at the top of the figure, and its
harmonic spectrum at the bottom of the figure.
(a) Control System (b) Bandpass Filter
(c) Vabc to Peak Value
Fig. 3. STATCOM PI control system. (a) Main control system. (b) Bandpass filter. (c)
Extraction of the peak value of a three-phase voltage in abc-reference.
Technology and Engineering Applications of Simulink
6
Fig. 4. Blocks parameters of important components.
Analysis of Power Electronic Controllers in Electric Power Systems Using Simulink
7
Fig. 5. Selected transient waveforms of the STATCOM without passive filter. (a) Phase angle
of the voltage at the ac terminals of the VSC. (b) Amplitude modulation ratio. (c) Voltage
across the dc capacitor. (d) Peak line-to-neutral voltage at the bus 1.
From Figure 5 and Figure 7 it is easy to notice that the passive filter has a positive impact on
the reduction of the harmonic distortion in the power network without affecting the
performance of the controller. In Figure 6, the waveform of the voltage at bus 1 is severely
distorted with a total harmonic distortion (THD) of 39.88%. In this case, some harmonic
components have a magnitude of almost 20% of the fundamental component, which is an
undesirable operating condition in practical applications. On the other hand, the obtained
voltage at bus 1 when the passive filter is on has a THD of 4.23% and the highest magnitude
of the harmonic components is around 3.5% of the fundamental component, as shown in
Figure 8.
In this simulation analysis, a discrete representation of the system given in Figure 2 was
used in order to carry-out the simulations, an integration step of 1 was selected.
0 0.1 0.2 0.3 0.4 0.5 0.6 0.7
-0.35
-0.3
-0.25
-0.21
(a) alfaE
0 0.1 0.2 0.3 0.4 0.5 0.6 0.7
0.6
0.7
0.8
(b) mE
0 0.1 0.2 0.3 0.4 0.5 0.6 0.7
480
500
520
(c) Vdc (Volts)
0 0.1 0.2 0.3 0.4 0.5 0.6 0.7
170
180
190
Time (s)
(d) V1 (Volts)
peak L-n
Technology and Engineering Applications of Simulink
8
Fig. 6. Steady state waveform of the voltage at the bus 1 without passive filter (top), and its
harmonic spectrum (bottom).
Fig. 7. Selected transient waveforms of the STATCOM with passive filter. (a) Phase angle of
the voltage at the ac terminals of the VSC. (b) Amplitude modulation ratio. (c) Voltage
across the dc capacitor. (d) Peak line-to-neutral voltage at the bus 1.
1.184 1.186 1.188 1.19 1.192 1.194 1.196 1.198
-400
-200
0
200
400
Tim e (s )
FFT window: 1 of 72 cycles of selected signal
0 10 20 30 40 50 60 70 80
0
5
10
15
20
Harmonic order
Fundamental (60Hz) = 179.6 , THD= 39.88%
Mag (% of Fundamental)
0 0.1 0.2 0.3 0.4 0.5 0.6 0.7 0.8
-0.35
-0.3
-0.25
(a) alfaE
0 0.1 0.2 0.3 0.4 0.5 0.6 0.7 0.8
0.6
0.8
(b) mE
0 0.1 0.2 0.3 0.4 0.5 0.6 0.7 0.8
480
500
520
(c) Vdc (Volts)
0 0.1 0.2 0.3 0.4 0.5 0.6 0.7 0.8
176
178
180
182
Time (s )
(d) V1 (Volts)
peak L-n
Analysis of Power Electronic Controllers in Electric Power Systems Using Simulink
9
Fig. 8. Steady state waveform of the voltage at the bus 1 with passive filter (top), and its
harmonic spectrum (bottom).
3.2.1 Static synchronous series compensator (SSSC)
The test system for the analysis of the SSSC is shown in Figure 9. The network parameters
are the same of those of Figure 2. The series transformers are represented b an ideal model.
The series active power reference Pref in the line 2 is equal to 5500 W; the dc voltage
capacitor reference is equal to 500 V; the gains of the power control are Kp=0.000015 and
Ki=0.004, and its limits are 0 and 1; the gains of the dc voltage control are Kp=0.03 and Ki=1,
and its limits are – and
The SSSC includes the control system shown in Figure 10. This control has two control
objectives: to control the active power (P) that flows in the transmission line connected in
series with the SSSC, and to maintain the dc voltage capacitor at its reference value.
Remember that the SSSC does not interchange active power in steady-state, only the
power loss; otherwise the dc capacitor is discharged. In transient state the SSSC has
transient interchanges of active power with the network, which is reflected in variation
of the dc voltage. Under this situation, the control regulates the interchange of active
power in order to maintain the dc voltage capacitor at its steady-state. The initial
1.184 1.186 1.188 1.19 1.192 1.194 1.196 1.198
-200
-100
0
100
200
Time (s )
FFT window: 1 of 72 cycles of selected signal
0 10 20 30 40 50 60 70 80
0
0.5
1
1.5
2
2.5
3
3.5
Harmonic order
Fundamental (60Hz) = 179.6 , THD= 4.23%
Mag (% of Fundamental)
Technology and Engineering Applications of Simulink
10
conditions are zero; the active power reference Pref is 5500 W, and the index modulation
is 41 (2.46 kHz). Pref is the active power reference in the transmission line in series with
the SSSC.
The test case has zero initial conditions for all the state variables, except for the voltage
across the dc capacitor; its initial condition is 500 V. At = 0.4 the voltage magnitude of
the three-phase programmable voltage source is increased 15%, and finally at = 0.7, the
initial operating point is reestablished. In this simulation analysis, a discrete representation
of the system given in Figure 2 was used in order to carry-out the simulations, and an
integration step of 2 was selected. This analysis is also carried-out with and without the
passive filter.
Figure 11 shows some selected transient waveforms of the SSSC without passive filter. In
this figure it is possible to notice that the series active power decreases about 25% when the
voltage magnitude of the three-phase programmable voltage source increases 15%, and the
series active power increases about 25% when the same voltage goes back to the original
value. The control objectives of the SSSC controller are achieved in six full cycles, as shown
in this figure.
Fig. 9. Test system including the SSSC.
Analysis of Power Electronic Controllers in Electric Power Systems Using Simulink
11
Fig. 10. SSSC control.
Fig. 11. Selected transient waveforms of the SSSC without passive filter. (Top left) Series
active power. (Top right) Amplitude modulation ratio. (Bottom left) Voltage across the dc
capacitor. (Bottom right) Phase angle of the voltage at the ac terminals.
Technology and Engineering Applications of Simulink
12
Figure 12 shows the steady state waveform of the voltage at bus 1 without passive filter. In
this operating scenario, the voltage is highly distorted; the THD is around 22.85% and the
harmonics 39 and 43 have a magnitude of around 12% of the fundamental component.
Notice that THD is high even when the switching frequency is 2.46 kHz. On the other hand,
of some selected variables, the transient and steady state solutions of the SSSC test system
including the passive filter are shown in Figure 13 and Figure 14. Comparing Figure 11 and
Figure 13, it is easy to notice that difference between these figures is negligible. The most
remarkable difference is the reduction of the harmonic distortion in all the system,
especially in the voltage at bus 1.
Fig. 12. Steady state waveform of the voltage at the bus 1 without passive filter (top), and its
harmonic spectrum (bottom).
0.984 0.986 0.988 0.99 0.992 0.994 0.996 0.998
-400
-200
0
200
400
Time (s )
FFT window: 1 of 60 cycles of selected signal
0 20 40 60 80 100 120 140 160
0
2
4
6
8
10
12
Harmonic order
Fundamental (60Hz) = 186.6 , THD= 22.85%
Mag (% of Fundamental)
Analysis of Power Electronic Controllers in Electric Power Systems Using Simulink
13
Fig. 13. Selected transient waveforms of the SSSC with passive filter. (Top left) Series active
power. (Top right) Amplitude modulation ratio. (Bottom left) Voltage across the dc
capacitor. (Bottom right) Phase angle of the voltage at the ac terminals.
Fig. 14. Steady state waveform of the voltage at the bus 1 with passive filter (top), and its
harmonic spectrum (bottom).
0.984 0.986 0.988 0.99 0.992 0.994 0.996 0.998
-200
-100
0
100
200
Time (s)
FFT window: 1 of 60 cycles of selected signal
0 10 20 30 40 50 60 70 80
0
0.1
0.2
0.3
0.4
0.5
Harmonic order
Fundamental (60Hz) = 191.7 , THD= 0.60%
Mag (% of Fundamental)
Technology and Engineering Applications of Simulink
14
3.2.2 Unified power flow controller (UPFC)
The UPFC test system of Figure 15 and Figure 16 shows the Simulink implementation of
the UPFC. The network parameters are the same of those of Figure 2. The UPFC including
the shunt control described in (Mahyavanshi & Radman, 2006) is schematically shown in
Figure 18, and the series control proposed in (Fujita, Watanabe, & Akagi, 2001) is shown
in Figure 17. The initial condition is zero, except for the dc capacitor voltage, which is 500
volts.
The series controller regulates the real (Pref=8500 watts) and reactive (Qref=0 vars) power
flows by adjusting the injected series voltage. The shunt converter regulates the voltage
across the dc capacitor and the sending end voltage V1 at bus 1. The modulation index is
m
f
=27, which represents a commutation frequency of 1.61 kHz. The RC passive filter has a
capacitance of 80 and a resistance of 0.2Ω. The gains for the series controller are the
following: Kp=1 and Ki=500 for the Discrete PI Controller 1, with no limits; Kp=2 and
Ki=1000 for the Discrete PI Controller 2, with no limits. On the other hand, the gains for the
shunt controller are: Kp=0.002 and Ki=1 for the Discrete PI Controller 1, with no limits;
finally, Kp=0.0012 and Ki=0.09 for the Discrete PI Controller 2, with no limits. The UPFC
analysis presented in this section only includes the case when the passive filter is connected,
as shown in Figure 15.
Fig. 15. Test system including the UPFC.
Analysis of Power Electronic Controllers in Electric Power Systems Using Simulink
15
Fig. 16. UPFC and its controllers.
Fig. 17. Series controller.