Methodology for data validation 1.0
Bạn đang xem bản rút gọn của tài liệu. Xem và tải ngay bản đầy đủ của tài liệu tại đây (1.45 MB, 76 trang )
<span class="text_page_counter">Trang 1</span><div class="page_container" data-page="1">
Methodology for data validation 1.0
Revised edition June 2016 Essnet Validat Foundation
<i><small>Marco Di Zio, Nadežda Fursova, Tjalling Gelsema, Sarah Gießing, Ugo Guarnera, Jūratė Petrauskienė, Lucas Quensel-von Kalben, Mauro Scanu, K.O. ten Bosch, Mark van der Loo, Katrin Walsdorfer </small></i>
</div><span class="text_page_counter">Trang 2</span><div class="page_container" data-page="2">Table of contents
<small>Foreword ... 3 </small>
<small>1 What is data validation. ... 5 </small>
<small>2 Why data validation. Relationship between validation and quality. ... 7 </small>
<small>3 How to perform data validation: validation levels and validation rules ... 9 </small>
<small>4 Validation levels from a business perspective ... 10 </small>
<small>4.1 Validation rules ... 14 </small>
<small>5 Validation levels based on decomposition of metadata ... 18 </small>
<small>5.1 A formal typology of data validation functions ... 20 </small>
<small>5.2 Validation levels... 22 </small>
<small>6 Relation between validation levels from a business and a formal perspective ... 22 </small>
<small>6.1 Applications and examples ... 24 </small>
<small>7 Data validation as a process ... 26 </small>
<small>7.1 Data validation in a statistical production process (GSBPM) ... 26 </small>
<small>7.2 The informative objects of data validation (GSIM) ... 29 </small>
<small>8 The data validation process life cycle ... 31 </small>
<small>8.1 Design phase ... 33 </small>
<small>8.2 Implementation phase ... 34 </small>
<small>8.3 Execution phase ... 35 </small>
<small>8.4 Review phase ... 36 </small>
<small>9 Metrics for data validation ... 38 </small>
<small>10 Properties of validation rules ... 39 </small>
</div><span class="text_page_counter">Trang 3</span><div class="page_container" data-page="3"><small>11 Metrics for a data validation procedure ... 52 </small>
<small>11.1 Indicators on validation rule sets derived from observed data ... 53 </small>
<small>11.2 Indicators on validation rule sets derived from observed and reference data ... 61 </small>
<small>11.2.1 True values as reference data ... 61 </small>
<small>11.2.2 Plausible data as reference data ... 65 </small>
<small>11.2.3 Simulation approach ... 65 </small>
<small>12 Assessment of validation rules ... 67 </small>
<small>Appendix A: List of validation rules ... 70 </small>
<small>13 References ... 74 </small>
</div><span class="text_page_counter">Trang 4</span><div class="page_container" data-page="4"><b>Foreword </b>
Data validation is a task that is usually performed in all National Statistical Institutes, in all the statistical domains. It is indeed not a new practice, and although it has been performed for many years, nevertheless, procedures and approaches have never been systematized, most of them are ad-hoc and also its conceptualisation within a statistical production process is not always clear. This is a cause of inefficiency both in terms of methodologies and of organization of the production system. There is an urge of producing a generic framework for data validation in order to have a reference context, and to provide tools for setting an efficient and effective data validation procedure.
<i>The first part of the document is devoted to establish a generic reference framework for data validation. Firstly, the main elements needed to understand clearly what is data validation, why data validation is performed and how to process data validation are discussed. To this aim a </i>
definition for data validation is provided, the main purpose of data validation is discussed taking into account the European quality framework, and finally, for the ‘how’ perspective, the key elements necessary for performing data validation, that are validation rules, are illustrated.
Afterwards, data validation is analysed within a statistical production system by using the main current references in this context, i.e., GSBPM for the business process and GSIM for defining the informative objects of data validation described as a process with an input and an output. Connections with statistical data editing are clarified by considering the GSDEMs (Generic Statistical Data Editing Models). Finally, the data validation process life cycle is described to allow a clear management of such an important task.
The second part of the document is concerned with the measurement of important characteristics
<i>of a data validation procedure (metrics for data validation). The introduction of characteristics of a </i>
data validation procedure and the proposal of indicators providing quantitative information about them is useful to help the design, maintenance and monitoring of a data validation procedure. In this second part, the reader can find a discussion of concepts concerning the properties of validation rules such as complexity, redundancy, completeness, and suggestions about how to analyse them. Moreover, once a validation process has been designed, there is the need to analyse its performance with respect to data. In the document, suggestions on indicators based only on observed data are proposed. These indicators are particularly useful for tuning the parameters of the data validation rules. Finally, in order to measure the quality of a data validation procedure, indicators based both on observed and reference data (e.g., simulated or cleaned data) are illustrated.
The document is intended for a broad category of readers: survey managers, methodologists, statistical production designers, and more in general for all the people involved in a data validation process. In fact, the first important objective of the document is to provide a common language
</div><span class="text_page_counter">Trang 5</span><div class="page_container" data-page="5">The common language we are referring to is concerned with concepts. The introduction of a common technical language for expressing validation rules is certainly an essential part, however it is beyond of the scope of this paper.
Finally, it is worthwhile to remark that more research is still needed, especially in the field concerned with the development of metrics for measuring the quality of a data validation procedure.
This document was developed between January and December 2015 as an output of the Essnet project Validat foundation primarily financed by Eurostat, which involved CBS, Destatis, Istat and Statistic Lithuania.
</div><span class="text_page_counter">Trang 6</span><div class="page_container" data-page="6">A generic framework for data validation
<b>1 What is data validation </b>
<i><small>(Marco Di Zio, Nadežda Fursova, Tjalling Gelsema, Sarah Gießing, Ugo Guarnera, Jūratė Petrauskienė, Lucas Quensel-von Kalben, Mauro Scanu, K.O. ten Bosch, Mark van der Loo, Katrin Walsdorfer) </small></i>
The first important concept to clarify is concerned with the definition of data validation.
<i>A definition for data validation is given in the Unece glossary on statistical data editing (UNECE </i>
2013):
<i>An activity aimed at verifying whether the value of a data item comes from the given (finite or infinite) set of acceptable values. </i>
<i>In this definition, the validation activity is referred to a single data item without any explicit mention to the verification of consistency among different data items. If the definition is </i>
interpreted as stating that validation is the verification that values of single variables belong to set
<i>of prefixed sets of values (domains) it is too strict since important activities generally considered </i>
part of data validation are left out. On the other hand, if the acceptance/rejection of a data item
<i>were intended as the final action deriving from some complex procedure of error localization, the </i>
previous definition of validation would be too inclusive since it would involve also phases of the editing process not strictly related to the validation process.
<b>A proposal for an operational definition of data validation was recently provided by Simon (2013a). </b>
<i>“Data validation could be operationally defined as a process which ensures the correspondence of the final (published) data with a number of quality characteristics.” </i>
It is related to the objective of validation, that is to ensure a certain level of quality of the final data. We did not adopt this definition since many processes different than data validation may be characterised by using this definition.
The definition we provide is reported in the following box, it is similar to that given by Unece, but with a modification that allows to disregard the correction activities, and to focus only on verification:
<i>Data Validation is an activity verifying whether or not a combination of values is a member of a set of acceptable combinations. </i>
The set of 'acceptable values' may be a set of possible values for a single field. But under this definition it may also be a set of valid value combinations for a record, column, or larger collection of data. We emphasize that the set of acceptable values does not need to be defined extensively. This broad definition of data is introduced to make data validation refer both to micro and macro
</div><span class="text_page_counter">Trang 7</span><div class="page_container" data-page="7">Data validation assesses the plausibility of data: a positive outcome will not guarantee that the data is correct, but a negative outcome will guarantee that the data is incorrect.
Data validation is a decisional procedure ending with an acceptance or refusal of data as acceptable. The decisional procedure is generally based on rules expressing the acceptable combinations of values. Rules are applied to data. If data satisfy the rules, which means that the combination expressed by the rules is not violated, data are considered valid for the final use they are intended to. There is of course the possibility of using the complementary approach in which rules are expressed in “negative form”: in this case data are validated by verifying that predefined non-acceptable combinations of values do not occur.
Sometimes the rules used in a validation procedure are split in hard/fatal edits and soft/query edits and the not acceptable values are classified either as ‘erroneous’ or ‘suspicious’ depending
<i>on whether they fail hard edits or soft edits. Hard edits are generally rules that must necessarily be </i>
satisfied for logical or mathematical reasons (e.g., children cannot be older than their parents). An example of query edits taken from the Unece glossary on statistical data editing is “a value that, compared to historical data, seems suspiciously high” while for fatal edits is “a geographic code for a Country province that does not exist in a table of acceptable geographic codes”. This distinction is an important information for the related ‘editing’ phase. In addition to this information, a data validation procedure may assign a degree of failure (severity) that is important for the data editing phase and for the tuning of data validation. Taking the example previously mentioned for soft edits, the severity can be evaluated by measuring the distance of the actual values with respect to the historical one. A more detailed discussion on metrics for measuring severity is given in the ‘Metrics’ Section.
In case of failure of a rule, data are exported from the data validation procedure, or marked respectively, and are handled by the editing staff in order to correct values to make the rules satisfied, or data are considered acceptable and the rules of the data validation are updated. The data validation process is an iterative procedure based on the tuning of rules that will converge to a set of rules that are considered the minimal set of relations that must be necessarily satisfied. The relation with statistical data editing must be clarified. We take as reference for statistical data editing the Generic Statistical Data Editing Models (GSDEMs v. 0.1) and the Generic Statistical Business Process Model (GSBPM). In the GSBPM, the process ‘Validate and Review’ is distinguished from the process ‘Edit and Impute’. In the ‘Validate and review phase’ there is data validation as it is previously described, while the ‘edit and impute phase’ includes the action of ‘changing data’. This is the idea underlying our definition.
In the GSDEMs, statistical data editing is described as composed of three different function types: Review, Selection and Amendment.
The review functions are defined as:
<i>Functions that examine the data to identify potential problems. This may be by evaluating formally specified quality measures or edit rules or by assessing the plausibility of the data in a less formal sense, for instance by using graphical displays. </i>
Among the GSDEMs different function categories there is ‘Review of data validity’ that is
<i>Functions that check the validity of single variable values against a specified range or a set of values and also the validity of specified combinations of values. Each check leads to a binary value </i>
</div><span class="text_page_counter">Trang 8</span><div class="page_container" data-page="8"><i>(TRUE, FALSE). </i>
This is in fact what we have just defined for data validation. In the GSDEMs, other ‘review’ functions are introduced: ‘review of data plausibility’ and ‘review of units’.
In review of data plausibility and review of units the output is a degree of ‘plausibility’, they are not seen as a final step, but as an intermediate step necessary for further work on data. In other words, the GSDEM review category includes also functions that typically are used to produce elements (such as scores or thresholds) that are needed in the validation procedure.
The connection of data validation with statistical data editing depends on the reference framework that is taken into account. According to GSBPM they are related but distinct, according to the GSDEMs data validation is a part of statistical data editing.
We notice that, the step of validation in statistical data editing generally assumes that IT structural requirements are satisfied and it does not deal with the related errors (formal checks), while we include this type of check in the data validation procedure.
<b>2 Why data validation - Relationship between validation and quality </b>
<i><small>(Marco Di Zio, Ugo Guarnera) </small></i>
The purpose of data validation is to ensure a certain level of quality of the final data.
Nevertheless, quality has several dimensions in official statistics: relevance, accuracy, timeliness and punctuality, accessibility and clarity, comparability, coherence, completeness. Hence, it is important to establish on which components data validation is concerned with.
Data validation focuses on the quality dimensions related to the ‘structure of the data’, that are accuracy, comparability, coherence. Data validation does not directly focus on quality aspects from the ESS QAF (see ESS QAF) that concern processes (e.g., timeliness). It is worthwhile to see in detail to which extent data validation is related to the different quality dimensions.
<b>Accuracy. </b>
The general definition of accuracy refers to the measurement of the difference between the ‘target parameter’ and the ‘estimated parameter’ (in principle these parameters are aggregates). This difference is potentially due to many error components that can be divided in ‘sampling and non-sampling errors’.
The validation procedure we are going to discuss does not take into account the sampling errors that are in fact evaluated generally through variance estimation methods. By definition sampling errors are not generated by errors in data, and are out of the scope of data validation procedure. Non-sampling errors are composed of different components (coverage errors, measurement errors, processing errors, non-response) but generally validation procedures are aimed at verifying the presence of those errors in that data that are defined in literature as ‘measurement errors’
</div><span class="text_page_counter">Trang 9</span><div class="page_container" data-page="9">On the contrary to what happens with sampling errors, for non-sampling errors and of course as a specific case for measurement errors, it is usually difficult and expensive to provide a direct measure. Evaluation of non-sampling error is often based on ‘repeated measures’ on the same individuals. Hence, it is worthwhile to exploit indirect measures to identify errors in data by using consistency rules concerning micro and macro aspects. This explains the usefulness of a data validation procedure.
It is worthwhile to remark that, while strictly speaking measurement errors refer only to observed data, in our more general context measurement errors refer also to errors produced in the production procedure, for instance coding, imputation. Actually, from the point of view of the validator, also data produced during the statistical production process are indeed observations.
<b>Coherence and comparability </b>
The general definition of coherence and comparability claims that statistics should be consistent internally, over time and comparable between regions and countries.
Coherence and comparability aspects are definitely important for the data validation process. Validation rules and the process of confronting the data set with validation rules, the process of detecting errors and flagging them should be coherent and consistent internally and between countries, based on common standards with respect to the scope and national deviations.
<b>Clarity and accessibility </b>
‘Accessibility and clarity’ is a quality dimension checked in a data validation process, it is related to the IT formal checks that are performed in order to be able to read without any misunderstanding the data.
<b>Timeliness </b>
Timeliness is not a quality dimension checked by a validation procedure. Nevertheless, it is important to remark that it has a strong connection with a data validation procedure. Timeliness can be seen as a constraint when designing a data validation procedure. For instance, in case of complex checks and time demanding editing procedures, a less restrictive data validation process allowing a higher amount of errors in data may be designed to meet the expected timing of the release of final data.
A final remark about the concept that data validation “aims at verifying whether data have a certain level of quality”: It is indeed true that data validation cannot ‘ensure’ a level of quality. What it can more realistically provide is that at least a certain level of data consistency considered as the minimum requirement for having acceptable data, is reached. This results not in perfect data, but in ‘plausible’ data.
</div><span class="text_page_counter">Trang 10</span><div class="page_container" data-page="10"><b>3 How to perform data validation: validation levels and validation rules </b>
<i><small>(Marco Di Zio, Mark Van der Loo) </small></i>
Because of the variety of validation steps and procedures, and because of the way validation procedures pervade statistical production processes, it is desirable to be able to judge to what extent a data set has been validated (validation level) by validation procedures applied to it. Moreover, as statistical processes age and mature, the number of validation procedures and rules tend to grow organically, generating a need for maintenance. Finally, one would like to be able to compare statistical processes and statistical software in view of their abilities to validate data. Clearly, the above tasks would be easier, if there was some sort of system that classifies validation levels, validation rules and procedures into disjoint subtypes.
To develop any classification system, one needs to consider what principle or principles separate the different classes. For validation rules and procedures, the following come to mind or have been encountered in literature:
- automated versus manual;
- objective versus subjective/expert opinion; - structural validation versus content validation;
- set being validated: in-field, in-record, cross-record, cross-data set, etc.; - place in the statistical process: input, throughput, output;
- type of validation rule: equality, inequality, logical rule,…
and sure there are many more options. Depending on the task at hand, different classifications may be useful, as long as they are both exhaustive and mutually disjoint.
In the recent literature, classifications have been developed from both a business perspective (Simon 2013a, 2013b) and from a more abstract perspective (Van der Loo, 2015). Moreover, Daas
<i>et al. (2011) produced an extensive checklist describing quality aspects to be validated, </i>
encompassing both structural (e.g. file format compliance) and subject-matter based content validation in the context of administrative data sources.
<i>The works of Simón and Daas et al. take a business perspective, encompassing both structural and </i>
subject-matter based content validation. The work of Van der Loo is focused on validation of data for which the technical structure has already been fixed. The advantage of the latter work is that it abstracts away from particular processes, files, or quality requirements and only looks at the structure of the domain of validation functions. This makes it more suitable for comparing, for example validation tools and languages or comparing validation across wildly different production processes.
</div><span class="text_page_counter">Trang 11</span><div class="page_container" data-page="11"><b>4 Validation levels from a business perspective </b>
<i><small>(Sarah Giessing, Katrin Walsdorfer) </small></i>
As it was observed in the introduction, data validation is not a new process, and some common elements can be derived from the existing practice of data validation. To this aim, a survey on the data validation procedures currently used in the National Statistical Institutes has been carried out in the Essnet Validat Foundation to find out how the typical validation process is practically implemented in the Member States of the ESS, see (Giessing and Walsdorfer, 2015) for information on design and results of this survey.
Looking at the practical implementation of the validation process means to take a business perspective. In the business perspective the attention is focused on the validation activities. The amount of information needed and the phases of the validation process are important for determining the validation levels. This approach is particularly useful for classifying and designing validation activities within an organization.
It is generally assumed that there are basically two general validation levels:
A. Technical integrity of the file, i.e., consistency with the expected IT structural requirements B. Logical and statistical consistency of the data
The second category is generally split into different sub-categories (levels) involving more and more information. The two general categories can then be expanded forming the following validation levels.
Valid. Lev 0 : consistency with the expected IT structural requirements Valid. Lev. 1: consistency within the data set
Valid. Lev. 2: consistency with other data sets within the same domain and within the same data source
Valid lev. 3: consistency within the same domain between different data sources Valid lev. 4: consistency between separate domains in the same data provider Valid. Lev 5: consistency with data of other data providers.
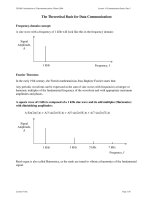
We notice that validation level 0 corresponds to the general validation level A earlier mentioned. In Figure 1, validation levels are represented according to their degree of complexity. The figure and the examples illustrating the levels have been taken from Simon (2013a).
</div><span class="text_page_counter">Trang 12</span><div class="page_container" data-page="12"><b>Figure 1. Graphical representation of validation levels</b>
<b>SDM: Task Team on a Generic Process Framework for Statistical Data - Generic Statistical Dta Editing </b>
<b>Models (GSDEM), draft prepared for the 2015 UNECE Work </b>
<b>on Statistical Data Editing</b>
The description of the validation levels is reported in the following, for a detailed discussion see Simon (2013a).
<b>Validation level 0. </b>
At this level, it is checked the consistency of the data with their expected IT requirements, for instance
- if the file has been sent/prepared by the authorised authority (data sender); - if the column separator, the end of record symbol are correctly used;
- if the file has the expected number of columns (agreed format of the file);
- if the column have the expected format of the data (i.e., alphanumeric, numeric, etc.)
For these quality checks only the structure of the file or the format of the variables are necessary
</div><span class="text_page_counter">Trang 13</span><div class="page_container" data-page="13"><b>Validation level 1 </b>
It is checked the consistency within the elements of the data set. For these quality checks, it is needed only the (statistical) information included in the file itself.
For instance:
- check whether the number included in column 4 is not negative (as expected); - check whether the year in the second column is 2011, as in the file name;
- check whether the content of the third column is one of the codes of the dictionary "Sex";
- check whether the content of the first column is consistent with the data sender (let's assume that there is a dictionary including the list of the data senders associated to the specific data set): data for Luxembourg should not be sent by another country.
- based on information available before data collection (for example from previous survey or other sources) one could establish a "plausibility range" for a certain variable (for instance number of components of a household).
- check consistency at (micro-level) of two (or more) variables: a certain combination of codes is illogical, a variable has to be reported only for a certain combination of codes. - check consistency at macro-level of two (or more) variables: Total inhabitants = male inhabitants + female inhabitants, or Female inhabitants = (total inhabitants / 2) +/- 10%
<b>Validation level 2 </b>
Validation levels 2 is concerned with the check of consistency based on the comparison of the content of the file with the content of "other files" referring to the same statistical system (or domain) and the same data source.
For instance:
Case a) the "other files" can be other versions of exactly the same file.
In this case the quality checks are meant to detect "revisions" compared to previously sent data. Detection and analysis of revisions can be useful for example to verify if revisions are consistent with outliers detected in previous quality checks (corrections) or to have an estimate of the impact of the revisions in the "to be published" results, for the benefit of the users.
Case b) the "other files" can be versions of the same data set referring to other time periods. These checks are usually referred to as "time series checks" and are meant to verify the plausibility of the time series.
</div><span class="text_page_counter">Trang 14</span><div class="page_container" data-page="14">Case c) the "other files" can refer to other data sets from the same data provider (e.g., Countries in the ESS), referring to the same or other correlated time periods. Sometimes a group of data sets (same country, same reference period) is sent at the same time.
Example: three files could be sent at the same time, from the same country and referring to the same time period: one file includes data for "females", one for "male" and one for "total". Consistency between the results of the three files can be checked.
Another example: results from annual data sets can be compared with the results of the corresponding quarterly data sets.
<b>Validation level 3 </b>
Validation levels 3 is concerned with the check of consistency based on the comparison of the content of the file with the content of "other files" referring to the same statistical system (or domain) but with a different data source.
For instance:
Case d) the "other files" can refer to the same data set, but from another data provider (e.g., Countries of the ESS).
Mirror checks are included in this class. Mirror checks verify the consistency between declarations from different sources referring to the same phenomenon, e.g., export declared by country A to country B should be the same as import declared by country B from country A.
<b>Validation level 4 </b>
Validation level 4 could be defined as plausibility or consistency checks between separate domains available in the same Institution. The availability implies a certain level of "control" over the methodologies by the concerned Institution.
These checks could be based on the plausibility of results describing the "same" phenomenon from different statistical domains. Examples: unemployment from registers and from Labour Force Survey, or inhabitation of a dwelling (from survey of owners of houses and dwellings vs. from population register)
Checks could also be made between results from correlated micro-data and macro-data sources. Other plausibility checks could be based on known correlations between different phenomena: for example external trade and international transport activity in ports.
<b>Validation level 5 </b>
Validation level 5 could be defined as plausibility or consistency checks between the data available in the data provider (Institution) and the data / information available outside the data provider (Institution). This implies no "control" over the methodology on the basis of which the external data are collected, and sometimes a limited knowledge of it.
Statistical indicators collected by Eurostat might also be compiled for their own needs by national
</div><span class="text_page_counter">Trang 15</span><div class="page_container" data-page="15">companies, etc.) and also by international organisations (World Bank, United Nations, International Monetary Fund, etc.).
For example, EU road freight statistics are prepared by Member States according to the EU Commission legal acts and in addition countries can carry out specific surveys for national purposes. A benchmarking between indicators common to these different surveys allows assessing the coherence of these data and could help improving the methodologies for data collection. To summarize, the classification of validation levels presented above implicitly assumes a growing degree of complexity from one level to another. However, this must not necessarily be reflected by a growing technical complexity of the validation checks themselves. From the technical point of view, the distinction made with respect to data sets is an artifice, since data sets and files could be merged into single databases in advance of implementing the checks.
A likely rise in complexity might be regarding organizational and management matters. On the higher levels of this classification more parties and stake-holders will be involved, potentially with different needs and requirements regarding data validity. This certainly tends to make it more difficult to harmonize technical and methodological concepts. However, this may depend very much on the concrete situation and circumstances.
<b>4.1 Validation rules </b>
The validation levels, as anticipated in the examples of validation levels, are verified by means of rules. Rules are applied to data, a failure of the rule implies that the corresponding validation level is not attained by the data at hand.
As explained in the beginning of section 4., a first broad classification of validation rules distinguishes rules to ensure technical integrity of the data file (type A.) and rules for logical/statistical consistency validation (type B). The distinction is useful since the rules used in the two contexts can be very different. Examples for the different rule types have been reported by the respondents of the ESSNET survey. Some of them will be presented further below:
A. Rules to ensure technical integrity of a data file
formal validity of entries (valid data type, field length, characters, numerical range)
presence of an entry
no duplicate units
all the values in a field of one data set are contained in a field of another data set (for instance contained in a codelist)
each record has a valid number of related records (in a hierarchical file structure)
</div><span class="text_page_counter">Trang 16</span><div class="page_container" data-page="16">B. Rules for logical validation and consistency could be classified using the two typology dimensions presented in table 1, e.g. identity vs. range checks (1) and simple vs. complex
Simple checks, based directly on the entry of a target field
More “complex” checks, combining more than one field by functions (like sums, differences, ratios)
Also, rules are often implemented as conditional checks, i.e. they are only checked, if a certain condition holds. This can be regarded as another property of a rule and might be considered as additional “dimension” of the rule typologies (for both rule sets, A. and B.).
Typical conditions of a conditional check mentioned by the ESSNET survey respondents are -
- if “age under 15” (then marital status must be not married), or
- if “legal form: Self-Employed” (then number of self-employed" must exceed 0), or - if “status in employment = compulsory military service” (then sex must be male), or - if “no. of employees not zero” (then wages and salaries must be greater than zero), or - if “enterprise reports production of goods” (then it should also report costs for raw
material), etc.
Of course there might be several conditions combined by logical AND or OR statements. Table 2 below presents at least one example<sup>1</sup> for each rule type in set A.
For the rule types of set B, table 3 provides examples<sup>2</sup>.
</div><span class="text_page_counter">Trang 17</span><div class="page_container" data-page="17"><b>Table 2: Examples of rules to ensure technical integrity of a data file </b>
Formal validity of…
- field length <i>Date: If Date is given as text it should be 8 characters long </i>
- characters <i>Date: If Date is given as text it should contain only </i>
numbers.
- numerical range <i>Month: Month of arrival in the country must be in {1,...,12} </i>
Presence of an entry <i>Persons in households: It is checked whether all have </i>
responded
<i>Code for Sex: no missing data. </i>
No duplicate units <i>Holding ID: Each holding has a unique ID number, duplicate </i>
ID numbers are not allowed within the data set All the values in a field of one
data set are contained in a field of another data set (for instance contained in a codelist)
<i>“code list check” </i>
<i>Occupation: Field “Occupation” must contain only entries </i>
from a list of valid ISCO-08(COM) codes at 3 digits level
<i>Country of origin: Field "country of origin" must contain </i>
only entries from a list of valid ISO country codes Each record has a valid
number of related records (in a hierarchical file structure)
<i>“Cardinality check” </i>
<i>Number of members of a family: the aggregated number of </i>
persons in each family must be equal to the number of individual rows in the data set corresponding to the members of that family
<b>Table 3: Examples of rules for logical validation and consistency </b>
<b>functions on field entries) Identity check </b> <i>In a sheep survey : </i>
“Milk production” must be equal to “milk disposal”
<i>Employment: </i>
“Number of persons engaged” must
<b>be equal to the sum of “employees” </b>
and “self-employed persons”
<b>Range checks </b>
<b>- bounds fixed </b> <i>Working hours (monthly): </i>
“Hours worked” must be between 0 and 168
<i>Average poultry weight: </i>
<b>“weight of poultry” divided by </b>
“number of poultry” must be
“Expenses on external services” must be greater or equal to
<b>“payment for agency workers” plus “telecommunications” plus </b>
“business trips of company personnel”
</div><span class="text_page_counter">Trang 18</span><div class="page_container" data-page="18">Notably, not all cross-combinations in the 2-way representation of rule types used to define the fields in table 3 are “necessary” from a language perspective. For example, any range check of the type “complex” can be expressed as range check with fixed bounds. For illustration, consider the instance provided in table 3 for checking expenses on external services. This rule would be equal to the following rule with a fixed bound of zero:
<b>“Expenses on external services” minus “payment for agency workers” minus “telecommunications” minus “business trips of company personnel” must be greater or equal </b>
to zero.
Moreover, any check of the type “complex” might be implemented as well as check of the type “simple”: According to our definition, a “complex” check is a check combining more than one field by functions (like sums, differences, ratios). Of course one might implement into the procedures of a statistic a step which derives new variables implementing such “functions”. If the validation step is carried out after such a preparatory step, all “complex” checks will be “simple”. This has also been reported as actual practice by one of the survey respondents: “Variables that are a combination of elementary ones are always implemented by combining elementary variables in the output process”.
Also, from a pure technical perspective, a conditional check may have the same logical form as an unconditional one. For example an unconditional check may have the logical form: if C1 and C2. Any range check could be expressed this way, for example C1: age difference between spouses ≥0, C2: age difference between spouses ≤20. On the other hand also the conditional check “If a person is aged under 16 the legal marital status must be never married” can be expressed this way, if we define: C1: age < 16 and C2: legal marital status not married.
An extended list of validation rules is provided in Appendix A. It has been obtained combining the lists of tables 2 and 3, taking into account a few more examples provided by the survey respondents, and combining this with the list of rules Simon (2013b).
In the extended list, we classify the rules according to the rule typology of table 1, with some occasional comments, if the check might be typically implemented not simply as intra-file check (i.e. on level 1 of the validation levels discussed in 2.3.1), but might perhaps fall into the categories defined as levels 2 to 5 in (Simon, 2013a), c.f. 2.3.1.
However, unlike for the examples directly taken from (Simon, 2013b), constructed to explain the different levels, for the examples provided by the survey respondents, this is always just a guess. The survey questionnaire did not “cover” the “levels” dimension. Consequently, respondents did not bother to explain, if the data used for a particular check are stored in the same, or in different files, whether they come from the same or from different sources or even from different data collecting organizations. Nor did they explain explicitly, if a check is carried out on the microdata- or on the macro-data-level. Rather on the contrary, one respondent reported for a certain type of check (i.e. complex range check with bounds depending on other fields) that “This is performed on
</div><span class="text_page_counter">Trang 19</span><div class="page_container" data-page="19">micro, macro and output editing. In micro-editing relevant ratios are tested in order to qualify the quality of a firms answer to the yearly survey. In macro and output editing phases, these ratios are used in order to identify the firms/sectors that have a big influence on the results.”
So far we have discussed the validation levels and rules from a business perspective, which means to describe the validation as it is usually discussed in the practice of surveys. This perspective is particularly relevant with all the practical aspects of a survey, for instance for doing a check-list in the design phase. On the other hand, it is limited in terms of abstraction and this may be inconvenient for generalizing the concepts and results.
In the following section a generic framework for validation levels and rules is presented.
<b>5 Validation levels based on decomposition of metadata </b>
<i><small>(Mark Van der Loo) </small></i>
For this typology, we use the following technical definition of a data validation function (Van der Loo, 2015). Denote with 𝑆 the class of all data sets. That is, if 𝑠 ∈ 𝑆, then 𝑠 may be a single data
<i>field, a record, a column of data, or any other collection of data points. A data validation function </i>
𝑣 is defined as a Boolean function on 𝑆, that is:
𝑣 ∶ 𝑆 → {0,1}.
<i>Here, 0 is to be interpreted as FALSE, or invalid, and 1 is to be interpreted as TRUE, or not invalidated by 𝑣. </i>
Such a functional definition may feel unnatural for readers who are used to validation rules, for example in the form of (non)linear (in)equality constraints. However, a comparison operator such as the “>” in the rule 𝑥 > 𝑦 may be interpreted as a function > (𝑥, 𝑦), yielding 0 if 𝑥 ≤ 𝑦 and 1 otherwise. Likewise, comparison operators ≤, <, =, >, ≥ and the membership operator ∈ can be interpreted as functions.
The action of a validation function thus consists of testing whether a certain relation on a (set of) data points holds. As such it’s result does not usually permit an immediate interpretation of failures in terms of what data point, or set of points cause the violation(s). The latter task is called error localization which is an entirely different task.
We may distinguish different types of validation functions by considering what type of elements from the class of all data sets (𝑆) it validates. In other words, we need to decompose the metadata that defines the data points making up a data set 𝑠 ∈ 𝑆. Van der Loo (2015) proposes a basic but extensible metadata decomposition that is based on an analysis of the measurement process.
</div><span class="text_page_counter">Trang 20</span><div class="page_container" data-page="20"><b>In this model, which is depicted in Figure 2, the horizontal axis is the time line with time points 𝑡. </b>
At time 𝑡<sub>𝑢</sub> an element of a statistical universe 𝑈 is born. From that time on, it contains certain properties, say 𝑋, that may depend on time. At time 𝜏, 𝑢 is selected from the then current population and a measurement of 𝑋 on 𝑢 takes place.
This model yields four essential, and not completely independent metadata aspects that are necessary to identify a data point, namely:
1. The universe 𝑈 from which a statistical object originates. This roughly determines the type of object that is investigated: household, person, company, e-mail, phone call, and tweet are all examples of valid statistical objects from certain universes. The choice of 𝑈 determines the set of properties 𝑋 for statistical objects.
2. The time 𝜏 of selecting an element 𝑢 from the then current population 𝑝(𝜏). The moment of selection determines about what population one is producing a statistical statement later on.
3. The selected element 𝑢 ∈ 𝑝(𝜏). This determines the value of variables 𝑋 over time that may be observed.
4. The variable selected for measurement.
<b>Figure 2: A simple model of a measurement process (Van der Loo, 2015) </b>
It is important to point out a subtlety regarding time in this model. Observe that the value that is obtained by measurement may or may not pertain to the measurement time 𝜏. For example, if a questionnaire is the instrument of measurement, one may ask about a subject’s past, current or future (expected) place of residence. In general then, the measurement pertains to a period [𝑡<sub>𝑥</sub>, 𝑡<sub>𝑥</sub><small>′</small>) or a moment in time if one lets 𝑡<small>𝑥</small><sup>′</sup> → 𝑡<sub>𝑥</sub> that need not coincide with 𝜏. In the context of this simple model, the time to which a value pertains is a part of the definition of variable 𝑋 and therefore non-essential. The time of measurement 𝜏 is considered essential since it both fixes the population and the value that is to be recorded. Indeed, Zhang and Pritchard (2013) for example point out that in the case of administrative data, a recorded value may be updated over time.
</div><span class="text_page_counter">Trang 21</span><div class="page_container" data-page="21"><i>Following the model described above, we define a data point as recorded value endowed with the </i>
four indices (𝑈, 𝜏, 𝑢, 𝑋) for Universe, time of measurement, selected element, and observed
<i>variable. A data set 𝑠 ∈ 𝑆 is now formally defined as a set of data points. </i>
<b>5.1 A formal typology of data validation functions </b>
We may classify data sets in 𝑆 according to which indices are constant for all data points 𝑥 ∈ 𝑠. And classify validation functions accordingly. For example, the rule
𝑥<sub>𝑈,𝜏,𝑢,𝑋</sub> > 0,
states that individual values have to be larger than zero. The corresponding validation function can be executed on the simplest of data sets: a single observation. To execute the validation
𝑥<sub>𝑈,𝜏,𝑢,𝑋</sub>+ 𝑥<sub>𝑈,𝜏,𝑢,𝑌</sub> = 𝑥<sub>𝑈,𝜏,𝑢,𝑍</sub>,
we need to collect values for variables 𝑋, 𝑌, and 𝑍 for the same element 𝑢 ∈ 𝑈, measured at the same time 𝜏 (in short: it is an in-record validation rule). Hence, only the indices (𝑈, 𝜏, 𝑢) are constant over the set that is validated by this rule.
Generalizing from these examples, we see that validation functions may be classified according to which of the metadata indices need to be varied to be able to execute a validation function. Since we have four indices, this in principle yields 2<sup>4</sup> = 16 possible rule types.
There are however some restrictions since the indices cannot be varied completely independent from each other. The first restriction is that a statistical element 𝑢 cannot be a member of two universes, except in the trivial case where one universe is a subset of the other (for example: take the universe of all households, and the universe of all households with more than 3 members). The second restriction stems from the fact that 𝑈 determines what variables can be measured.
<i>The exact same variable cannot be a property of two types of objects (e.g. even though one may speak of an income for either persons or households, one would consider them separate objects </i>
and not combine them to say, compute a total).
Taking these restrictions into account yields 10 disjunctive classes of validation functions. Using the index order 𝑈𝜏𝑢𝑋, each indicate class is indicated with a quadruplet of {𝑠, 𝑚}, where 𝑠 stands for single and 𝑚 for multiple. An overview of the classes, with examples on numerical data is given in the Table 4.
</div><span class="text_page_counter">Trang 22</span><div class="page_container" data-page="22"><b>Table 4: Overview of the classes and examples of numerical data Class </b>
<b>(𝑼𝝉𝒖𝑿) <sup>Description of input </sup><sup>Example function </sup><sup>Description of </sup>example </b>
</div><span class="text_page_counter">Trang 23</span><div class="page_container" data-page="23"><b>5.2 Validation levels </b>
The typology described in the previous subsection lends itself naturally for defining levels of validation in the following way. Given a data set 𝑠 ∈ 𝑆 that is validated by some validation function 𝑣, count the number of indices 𝑈𝜏𝑢𝑋 that vary over 𝑠. The result can be summarized in the
Observe that the order of validation levels correspond with the common practice where one tests the validity of a data set starting with simple single-field checks (range checks) and then moves to more complex tests involving more versatile data.
<b>6 Relation between validation levels from a business and a formal perspective </b>
<i><small>(Mark Van der Loo) </small></i>
In the previous sections, validation levels have been discussed from both a business and a more formal view. A natural question to ask is how these two perspectives interrelate and what the merits and demerits of these contrasting views are. In the following, we discuss both viewpoints from a theoretical perspective, and we will correlate the levels amongst each other, illustrated by examples obtained in the survey undertaken in this ESSnet.
From a theoretical point of view, the difference lies in the chosen principals that are used to separate validation rules. The validation levels that are derived from a business perspective (see
<i>Figure 1) are motivated by the viewpoint of a statistician: data are obtained in batches of files (a data set) from a source, pertaining to a domain, and data may or may not come from within the same institute (statistical provider). Now, validation rules are categorized by judging whether they </i>
pertain to data within a single or multiple files, within or across sources, and so on. The main merit of this division is that it appeals closely to the daily routine of data management and handling. It is likely that the business-based subdivision can therefore be easily understood by many practitioners in the field. The main demerit is that it is to some extent subjective. For example,
</div><span class="text_page_counter">Trang 24</span><div class="page_container" data-page="24">consider the division of rules between in-file and cross-file is spurious: one statistician may receive two files, and apply a cross-file validation, merge the files and pass it to a second statistician. The second statistician can perform the exactly the same validation, but now it is classified as an in-file validation. This subjectivity is especially problematic when one wishes to compare validation levels across production processes.
The validation levels that are derived from a formal viewpoint are based on a decomposition of
<i>metadata that minimally consists of a domain, a measurement time, the observed statistical object and the measured variable. Rules are categorized according to whether they pertain to one or </i>
more domains, objects, and so on, taking into account that the four aspects cannot be chosen completely independently. The merits and demerits mirror the demerits and merits derived from the business point of views and can in that sense be seen as complementary: being based on formal consideration, this typology’s demerit is that it may take more effort to analyse practical situations. The main merit is its objectivity: it allows for comparison of different production processes.
Table 6 shows a correlation chart between the typologies driven by business and formal considerations: an ‘x’ marks where levels in the business-driven typology have matches in the formal typology. A capital ‘X means ‘full overlap’ while a small ‘x’ marks partial overlap.
Since the formal typology is defined on a logical level, file format and file structure is not a part of the typology. Hence, the first row in the table is empty. The business-typology level 1 includes checks that can be performed in-file, where based on the examples given in section 4.1, it is assumed that a single file contains only data from a single domain. This means that there is no overlap with formal typology level 4, in which the domain must vary in order to perform a check. There is partial overlap with format-typology level 3, since it contains one category where domains a varied and one where this is not the case. The same holds for business-level 2, where it is stated explicitly that the checks have to pertain to within a single domain. The most important difference
<i>between business-level 2 and 3 is the physical origin of the data (source). Since there is no </i>
equivalent of this in the formal typology, the correspondence is again the same as for level 1 and level 2.
Business-level 4 is explicitly reserved for checks that use data across statistical domains. There is therefore full overlap with formal level 4 and partial overlap with formal level 3. Business level 5 finally, mentions explicitly the use of data ‘information outside the institution’. Since the formal typology makes no difference between such physical aspects, there is at least partial overlap with all formal levels.
</div><span class="text_page_counter">Trang 25</span><div class="page_container" data-page="25"><b>Table 6: Cross-correlation of the business-driven and formal typology. Small ‘x’ means partial overlap, large ‘X’ indicates full overlap </b>
<b>6.1 Applications and examples </b>
To further clarify the above typology, we classify a number of rules that were submitted by NSI’s during the stocktaking work of the ESSnet on validation. In the below examples, we copy the description of rules exactly as they were submitted by respondents and analyse their coding in terms of the typology. Since the descriptions do not always provide all the necessary information for a complete classification, we make extra assumptions explicit.
<b>Example 1 </b>
<i>Field for country of birth should contain only entries from code list of countries </i>
This rule is used to check whether a single variable occurs in a (constant) set of valid values. Hence it is coded 𝑠𝑠𝑠𝑠 (level 0) in the formal typology. In the business typology it would fall in Level 1.
</div><span class="text_page_counter">Trang 26</span><div class="page_container" data-page="26"><b>Example 2 </b>
<i>if a price of reference period is different to price of last period, the Code of price change must be completed </i>
<i>We assume that the price of reference period is recorded during a different measurement then price of last period. If this assumption holds, the rule encompasses two measurement times and two variables: price and Code of price change. Hence, in the formal typology the rule type is </i>
classified as 𝑠𝑚𝑠𝑚 (level 2). In the business-typology it is a level 2 check, since it can be thought of as involving a sort of ‘time series check’.
<b>Example 3 </b>
<i>If in a household record the number of persons living is that household is 2, there must be 2 records in the file of the person record </i>
<i>This rule concerns objects from two different universes: households and persons, so we have two options in the formal typology: 𝑚𝑚𝑚𝑚 or 𝑚𝑠𝑚𝑚. Assuming that the data is collected in a single </i>
household survey where various persons were interviewed, the correct type is 𝑚𝑠𝑚𝑚 (level 3) in the formal typology. In the business-typology this would probably be perceived as an in-domain check (a check on households, or demography). Assuming all data is stored in a single file, it would
<i>be a business-typology level 1 check. </i>
<b>Example 4 </b>
<i>unit price = total price / quantity </i>
<i>Assuming the three variables unit price, total price, and quantity are collected in a single </i>
measurement, this rule is coded as 𝑠𝑠𝑠𝑚 (formal typology level 1). Similarly, this is an in-file check
<i>for the business typology and therefore level 1. </i>
<b>Example 5 </b>
<i>We do check for duplication of respondents by checking the 'person_id'. </i>
<i>This concerns a single variable, person_id, and multiple units that presumably are collected at a </i>
single measurement time. Hence the rule is of type 𝑠𝑠𝑚𝑠 (level 1) in the formal typology. Checking for duplicates is interpreted as a structural requirement from the business perspective (considering that checking whether all columns are present is also considered structural), so in the business-typology it would be level 0.
<b>Example 6 </b>
</div><span class="text_page_counter">Trang 27</span><div class="page_container" data-page="27"><i>Number of animal at the end of reference period == number of animal at the beginning of following reference period. </i>
This rule concerns a single variable, measured at two instances of time. The classification is therefore 𝑠𝑠𝑚𝑠 (level 1) in the formal typology. In the business typology it is a level 2 check as well, for similar reasons as in Example 2.
<b>Example 7 </b>
<i>If a person states that his/her mother lives in the household and states her interview-id the person with this id needs to be female. </i>
<i>This rule concerns a single object type (person), two objects, and two variables: whether a </i>
person’s mother lives in the household and the recorded gender of the person’s mother. Hence the classification is 𝑠𝑠𝑚𝑚 (level 2) in the formal typology. In the business-typology it is an in-file check, and therefore level 1.
<b>7 Data validation as a process </b>
<b>7.1 Data validation in a statistical production process (GSBPM) </b>
<i><small>(Marco Di Zio, Ugo Guarnera) </small></i>
The business processes for the production of official statistics are described in the GSBPM (UNECE
<i>2013). </i>
The schema illustrated in the GSBPM is useful to see that data validation is performed in different phases of a production process. The phases where validation is performed are the following:
<b>GSBPM: phase 2.5 </b>
The first phase when data validation is introduced is the ‘design’ phase and more specifically in
<i>sub-phase 2.5, that is ‘design processing and analysis’. The description in GSBPM is: </i>
<i>“This sub-process designs the statistical processing methodology to be applied during the "Process" and "Analyse" phases. This can include specification of routines for coding, editing, imputing, estimating, integrating, validating and finalizing data sets”. </i>
This is of course related to the design of a validation procedure, or more properly, of a set of validation procedures composing a validation plan.
<b>GSBPM: phase 4.3 </b>
The first sub-phase of GSBPM where validation checks are performed is the 4.3. As described in the GSBPM document, checks are concerned with formal aspects of data and not on the content:
</div><span class="text_page_counter">Trang 28</span><div class="page_container" data-page="28"><i>“Some basic validation of the structure and integrity of the information received may take place within this sub-process, e.g. checking that files are in the right format and contain the expected fields. All validation of the content takes place in the Process phase” </i>
The other two sub-phases where validation procedures are applied are ‘Process’ and ‘Analyse’.
<b>GSBPM: phase 5.3 </b>
In the process phase, the sub-phase 5.3 is specifically referred to validation, it is in fact named
<i>‘review & validate’. </i>
The description given in the document GSBPM (2013) is:
<i>“This sub-process examines data to try to identify potential problems, errors and discrepancies such as outliers, item non-response and miscoding. It can also be referred to as input data validation. It may be run iteratively, validating data against predefined edit rules, usually in a set order. It may flag data for automatic or manual inspection or editing. Reviewing and validating can apply to data from any type of source, before and after integration. Whilst validation is treated as part of the “Process” phase, in practice, some elements of validation may occur alongside collection activities, particularly for modes such as web collection. Whilst this sub-process is concerned with detection of actual or potential errors, any correction activities that actually change the data are done in sub-process 5.4” </i>
Some remarks can be done on the previous description.
i) The term input validation proposes an order in the production process. The term and the idea can be used in the handbook.
ii) Input data concern with any types of source iii) Validation may occur alongside collection activities
iv) The distinction between validation and editing is provided, and it is in the action of ‘correction’ that is made in the editing phase, while validation only says if there is (potentially) an error or not. The relationship between validation and data editing will be discussed later on.
<b>GSBPM: phase 6.2 </b>
The last sub-phase is the 6.2 (‘validate outputs’).
<i>“This sub-process is where statisticians validate the quality of the outputs produced, in accordance with a general quality framework and with expectations. This sub-process also includes activities involved with the gathering of intelligence, with the cumulative effect of building up a body of knowledge about a specific statistical domain. This knowledge is then applied to the current collection, in the current environment, to identify any divergence from expectations and to allow informed analyses. Validation activities can include: </i>
<i>checking that the population coverage and response rates are as required; comparing the statistics with previous cycles (if applicable); </i>
</div><span class="text_page_counter">Trang 29</span><div class="page_container" data-page="29"><small>Final data </small>
<i>checking that the associated metadata and paradata (process metadata) are present and in line with expectations </i>
<i> confronting the statistics against other relevant data (both internal and external); investigating inconsistencies in the statistics; </i>
<i> performing macro editing; </i>
<i> validating the statistics against expectations and domain intelligence” </i>
The checks that are not usually considered as a part of a ‘data validation’ procedure (i.e., the first and the third item where emphasis is not on data) are marked with “”.
Remark. The attention of this validation step is on the output of the ‘process’ step. It means that data are already processed, e.g., statistical data editing and imputations are done.
In figure 1,a flow-chart is depicted describing the different validation phases in connection with statistical data editing as described in the GSBPM.
<b>Figure3: Flow-chart describing the different validation phases in connection with statistical data </b>
In principle, there should be a decisional step addressing the end of the process also after input validation, but it is rare that input data are free of errors especially by considering also the non-response in the non-sampling errors.
This process flow is related to a data set, however it can be easily adapted to a more complex situation where more than a single provider is responsible of the release of data. An important case is the European statistical system, where each single NSI applies the process described in
</div><span class="text_page_counter">Trang 30</span><div class="page_container" data-page="30">figure 3 and send the final data to Eurostat. Eurostat has the possibility of making further comparisons, having data from different Countries. Hence, the final collector may repeat the data validation process, with the usual exception of performing the phase of data editing (sub-phase 5.4). A similar example can be that of aggregates provided by National Accounts, in general NA collects data from different sources and for this they have the possibility of making further consistency checks that are not possible within each single part of the production chain.
From the previous considerations, the validation process is considered as a set of validation procedures.
<b>7.2 The informative objects of data validation (GSIM) </b>
<i><small>(Marco Di Zio, Ugo Guarnera, Mauro Scanu) </small></i>
<i>According to GSIM, each data is a result of a Process step through the application of a Process method on the necessary Inputs. </i>
A data validation procedure can be interpreted according to the GSIM standard (Unece GSIM 2013) that provides a set of standardized, consistently described information objects, which are the inputs and outputs in the design and production of statistics.
<i>To this aim the validation process can be represented by an Input, a process, and an output. </i>
<i>The relevant informative objects are those characterising the input, the process and the output, </i>
and more in general all the objects used to describe the validation procedure in the statistical production procedure.
At first, we introduce the concept of Statistical program cycle that is for instance the survey at a
<i>certain time within a Statistical Program. A statistical program cycle is typically performed by means of several Business Processes. A Business process corresponds to the processes and </i>
sub-processes found in the Generic Statistical Business Process Model (GSBPM). Process steps address the question: how to process the business process.
<i>Each Process Step in a statistical Business Process has been included to serve some purposes. The purpose is captured as the Business Function (what) associated with the Process Step (how to do </i>
it).
<i>According to these definitions, data validation can be interpreted as a business function </i>
corresponding to different business processes, which means that data validation can be performed at different stages of the production chain, in fact data validation refers to different phases of GSBPM. These phases, composed of process steps, are distinguished by their process
<i>inputs, i.e., any instance of the information objects supplied to a Process Step Instance at the time </i>
its execution is initiated.
</div><span class="text_page_counter">Trang 31</span><div class="page_container" data-page="31">Data validation is in general described by an application of rules to a set of data to see whether data are consistent with the rules. Data fulfilling rules are considered validated. The output of the process is a data set with indicators addressing which data are considered acceptable and hence validated, indicators about metrics computing..., and indicators measuring the severity of the failure (if any).
The data sets are to be considered in a broad way, they can be composed of microdata or aggregates, they can have a longitudinal part or not.
GSIM defines data set as:
<i>“A Data Set has Data Points. A Data Point is placeholder (for example, an empty cell in a table) in a Data Set for a Datum. The Datum is the value that populates that placeholder (for example, an item of factual information obtained by measurement or created by a production process). A Data Structure describes the structure of a Data Set by means of Data Structure Components (Identifier Components, Measure Components and Attribute Components). These are all Represented Variables with specific roles. </i>
<i>Data Sets come in different forms, for example as Administrative Registers, Time Series, Panel Data, or Survey Data, just to name a few. The type of a Data Set determines the set of specific attributes to be defined, the type of Data Structure required (Unit Data Structure or Dimensional Data Structure), and the methods applicable to the data.” </i>
This definition is broad enough to include the elements data validation is supposed to analyse.
The input of a validation procedure must include the variables to be analysed, however it is worthwhile to notice that GSIM defines separately informative objects for the meaning and the concrete data-representation, i.e., it distinguishes between conceptual and representation levels in the model, to differentiate between the objects used to conceptually describe information, and those that are representational.
The validation procedure requires the description of the variables at representation level. Furthermore, it is necessary to associate variables to the data set(s). The GSIM informative object
<i>is the instance variable. From GSIM we have that “an Instance Variable is a Represented Variable that has been associated with a Data Set. This can correspond to a column of data in a database. For example, the “age of all the US presidents either now (if they are alive) or the age at their deaths” is a column of data described by an Instance Variable, which is a combination of the Represented Variable describing "Person’s Age" and the Value Domain of "decimal natural numbers (in years)". </i>
<i>Finally, the parameter object is an essential input for the process since it is concerned with the </i>
parameters required by the rules used in the process.
</div><span class="text_page_counter">Trang 32</span><div class="page_container" data-page="32"><i>In GSIM, a Process Method specifies the method to be used, and is associated with a set of Rules </i>
to be applied. For example, any use of the Process Method 'nearest neighbour imputation' will be associated with a (parameterized) Rule for determining the 'nearest neighbour'. In that example the Rule will be mathematical (for example, based on a formula). Rules can also be logical (for example, if Condition 1 is 'false' and Condition 2 is 'false' then set the 'requires imputation' flag to 'true', else set the 'requires imputation flag' to 'false'). In case of validation, a common example of process method is a balance edit, <small>Closing inventory = Opening Inventory + Purchases - Sales</small>.
<i>Process Outputs can be composed of reports of various types (processing metrics, reports about data validation and quality, etc.), edited Data Sets, new Data Sets, new or revised instances of </i>
metadata, etc.
More precisely, in data validation process outputs are metrics measuring the severity of possible failures and a set of logical values addressing whether the unit/variables are acceptable or not. The data set is the same as the one in the input, the same holds for data structure and variables - We are now able to represent a validation procedure as a generic process defined in terms of an input, a process and an output, characterised respectively by GSIM informative objects, see Table 7
<b>Table 7. GSIM informative objects characterising a data validation procedure </b>
This generic procedure may be applied in different business processes for the production of official statistics (different phases of GSBPM). Each of these different applications will be characterised by specific input parameters, process objects and also outputs.
While the previous informative objects are sufficient to describe a validation procedure, in order to place precisely a validation procedure in a statistical production process, further information is
<i>needed, in fact there is the need to associate the procedure to a cycle of statistical program (e.g., a survey at a certain time), a business process (a phase of GSBPM) and process step (steps performed in the business process). These informative objects represent the coordinates to place exactly the validation procedure a production process. </i>
<b>8 The data validation process life cycle </b>
</div><span class="text_page_counter">Trang 33</span><div class="page_container" data-page="33">In order to improve the performance of a statistical production process by managing and optimising the data validation process, it is useful to describe the data validation process life cycle. First, the process should be seen as a dynamic and complex process. Adapting validation rules may influence not only in the scope of one data set or one statistical domain, but also to all statistical domains. For instance, the optimization of efficacy and efficiency of the validation rules should take into account their assessment in the previous occasion, relations of indicators, etc. Second, the process should be seen as an integral part of the whole statistical information production process.
The data validation life cycle involves the activities directly linked to each statistical domain for the
<b>definition and execution of data validation. This cycle starts by designing the data validation </b>
process for the statistical domain or inter statistical domain, with an overall study of the data sets, variables and its relations to find a list of suitable and effective validation rules. In the
<b>implementation phase, these validation rules are described in common syntax, formalised, tested and refined, discussed and evaluated by stakeholders. During the execution phase, data are </b>
checked against the rules; validation results are measured and quantified. These outputs will be
<b>reviewed to improve the list of validation rules. </b>
The data validation life cycle process includes the review of obtained statistical data through data editing, in fact the output of this task is used to improve the data validation procedure in an iterative way.
Data validation process is an integral part of the whole statistical information production process. Validation tasks and controls are performed by several stakeholders with a wide range of responsibilities. The data validation process life cycle should provide clear and coherent allocation of actions and responsibilities to ensure the highest performance, while reducing the possibility of mistakes. Though, allocation of responsibilities for each phase of data validation life cycle is hardly possible due to the complexity of data validation procedure and because this is strongly related to the particular organization structure.
Designing validation rules and rule sets for a data set implies the distribution of validation tasks in the statistical production chain to be proposed to the decision making structures. This distribution
<i>of responsibilities should be designed following the principle of "the sooner the better" as it is </i>
commonly agreed that the cost in terms of resources, time and quality of fixing data errors is lower as closer it is to the data source.
The data validation process life cycle is represented in figure 4.
</div><span class="text_page_counter">Trang 34</span><div class="page_container" data-page="34"><b>Figure 4: Data validation process life cycle</b>
<b>8.1 Design phase </b>
The design of a data validation process is a part of the design of the whole survey process. The data validation process has to be designed and executed in a way that allows for control of the process. The design of the validation process for a data set in or between the statistical domains requires setting up the validation rules to be applied to the data set.
These set of validation rules should be complete, coherent, and efficient and should not contain any inconsistencies. Designing a set of validation rules is a dynamic process. Validation rules should be designed in collaboration with subject matter specialists and should be based on analysis of previous surveys. Consistency and non-redundancy of rules should be verified. Validation rules should be designed cautiously in order to avoid over-editing. Effective validation rules can be obtained by differently combining approaches and “best practices”.
In this phase the validation process should be planned and documented for further progress monitoring. The overall management of the process and the interfaces with the other sub-processes should be considered. For each phase the resources and time needed to implement, test, execute, review and document should be planned.
This is the phase where survey designers, questionnaire designers, validation and editing specialists and subject matter experts have to co-operate.
<b>Activity descriptions </b>
<b> Assess quality requirements for data sets </b>
<b> Overall study of data sets, variables and their relations </b>
</div><span class="text_page_counter">Trang 35</span><div class="page_container" data-page="35"><b> Determine satisfactory set of validation rules for the data. In order to make data </b>
production process more efficient, reducing time and human resources, but considering quality requirements.
<b> Assess responsibilities and roles. Document who is doing what; who is responsible for </b>
different actions; who is accepting and adopting the validation rules, etc.
<b> Integrate the data validation process in the overall statistical production process. Design </b>
the connections with other phases of the statistical production processes.
<b> Improvement of the validation according to the results of the review phase </b>
A document with the form of guidelines with some theoretical background, examples and best practices could support the task of the domain manager when designing the entire validation process.
<b>8.2 Implementation phase </b>
Once the data validation process has been designed, it has to be implemented with a parameterisation, thoroughly tested, tuned and become productive.
The validation process should be tested before it is applied. Validation rules and editing techniques and methods should be tested separately and together. It is important to realize that once the validation process is implemented in the actual survey process, only slight changes should be made to monitoring and tuning in order to avoid structural changes.
Common definitions and descriptions applied to data validation are required for a common understanding of the whole validation process.
A proper documentation of the validation process is an integral part of the metadata to be published. The aim of documentation is to inform users, survey managers, respondents, validation and editing specialists about the data quality, the performance of the process, its design and adopted strategy. The documents can be of three types: methodological, reporting and archiving. The validation rules should be written in an unambiguous syntax that could allow communicating the rules amongst the different actors in the production chain and could also be interpreted by IT systems.
People working on validation and related aspects should have a sound knowledge of the methods that can be adopted, aware about the links between the validation and the other parts of the statistical production process. At this phase cooperation from methodologist and IT specialist should be very concise.
</div><span class="text_page_counter">Trang 36</span><div class="page_container" data-page="36"><b>Activity descriptions </b>
<b> Validation rules are formalized and described in a common syntax. </b>
<b> Determine metrics for data validation rules, assessment of validation process and validation rules. Validation rules should be assessed for quality (clear, unambiguous and consistent, saving time resources). </b>
<b> Testing. Apply validation rules to test data (real data, artificial data) and producing indicators. </b>
<b> Test results (indicators, validation rules, metrics, quality aspects, etc.) are evaluated by stakeholders (Eurostat, Member states, Domain managers, etc.). Reporting documents on </b>
test results and evaluation should be prepared and saved for review phase.
<b> Refinement of validation rules according to the test results and consultations with stakeholders </b>
<small> </small> <b>Documenting. Data validation rules should be well documented – documents depend on </b>
the purpose and the final user: producers, users of the results, survey managers or methodologists.
<b>8.3 Execution phase </b>
The execution phase consists of identifying values that are not acceptable with respect to rules expressing logical, mathematical or statistical relationships. This process usually consists of a set of integrated validation methods dealing with different type of errors. This allows assessing the quality of the data and helps to identify error sources for future improvements of statistical production process.
The result of execution phase is a flag pointing out acceptable and not acceptable data, and generally a score measuring the degree of severity of failure.
A standard communication of error/warning messages may increase the global efficiency of statistical production and impacts directly the time required for understanding and locating the source of the error. As well, this standardisation may lead to an automatic treatment of validation messages by IT tools.
It would be desirable to reach certain level of harmonisation in the presentation of validation results with agreed validation metrics. More about metrics on validation could be found in the second part of this handbook: Metrics for a data validation procedure. The quality measures could be used as standard reporting devices which are routinely calculated.
The part of this phase is gathering the statistics on validation outcomes to assess the quality of
</div><span class="text_page_counter">Trang 37</span><div class="page_container" data-page="37">Data, programs and the corresponding metadata have to be documented and archived if the process should be repeated or if new methods will be tested for a data sets. It is desirable to have common approach for validation procedure to keep validation rules in one place maintained and supported continuously, friendly users’ application and specification written in understandable language for different users of the application.
This phase is aimed at continuous improvement of validation process efficacy and data quality. During the review phase needs for new design elements are established. This phase includes identification of problems using feedback from the users and other stakeholders and analysing outcomes from the execution phase. The identified problems are prioritised and dealt with in the design phase.
Examples of revisions are:
Improvement of validation rules due to:
- Replacing those that detect few errors by others more powerful - Replacing those that ‘mislead’: detect errors that are not real errors - Increase efficiency of validation rules
- Improvements in validation rules: detecting more possible errors - Changes in the data file or regulations
Changes in the validation process originated by: - Changes in validation tools
- Changes in file formats - Improving efficiency
Changes in the validation workflow due to:
- Better assignment of responsibilities in validation tasks - Efficiency gains in the chain
</div><span class="text_page_counter">Trang 38</span><div class="page_container" data-page="38"><b>Activity descriptions </b>
<b> Analysis of feedback from stakeholders. Feedback gathered in previous phases. </b>
<b> Analysing of outcomes from the execution phase. Identified potential problems, errors, </b>
discrepancies, detected systematic problems are analysed in order to decide whether validation rules should be reviewed.
<b> Identifying and prioritising problems. </b>
</div>