- Trang chủ >>
- Tuyển sinh lớp 10 >>
- Toán
PIE CHARTS CONTENTS DOMAIN REFERENCES
Bạn đang xem bản rút gọn của tài liệu. Xem và tải ngay bản đầy đủ của tài liệu tại đây (1.82 MB, 12 trang )
<span class="text_page_counter">Trang 1</span><div class="page_container" data-page="1">
<b>18</b>
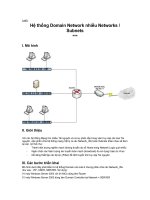
This pie chart shows how the children in Class 6 best like their potatoes cooked.32 children took part in the survey. Look at the four statements below.
10 children like chips best.
25% of the children like mashed potatoes best.
of the children like roast potatoes best.
12 children like jacket potatoes best. <small>1</small>
<b>For each statement put a tick ( ) if it is correct.Put a cross ( ) if it is not correct.</b>
</div><span class="text_page_counter">Trang 2</span><div class="page_container" data-page="2"><small>19 </small>
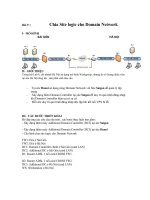
Class 6 did a survey of the number of trees in a country park.
This pie chart shows their results.
The children counted 60 <b>ash trees.</b>
Use the pie chart to estimate the <b>number of beech trees </b>
</div><span class="text_page_counter">Trang 3</span><div class="page_container" data-page="3"><small>Sourced from SATs-Papers.co.uk</small>
[2 marks]
<b>33</b>
[2012]
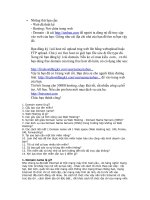
</div><span class="text_page_counter">Trang 4</span><div class="page_container" data-page="4">A shop sells books, CDs and DVDs.
This pie chart shows the sales of each in one week.
In this week, 200 CDs were sold. Estimate how many books were sold.
</div><span class="text_page_counter">Trang 5</span><div class="page_container" data-page="5">They each made a pie chart of what they found.
<b>Estimate the number of worms that Tony found.</b>
<b>Who found more snails?</b>
Circle Tony or Gemma.
Tony / Gemma
Explain how you know.
<small>They each made a pie chart of what they found.</small>
<b><small>Estimate the number of worms that Tony found.</small></b>
<b><small>Who found more snails?</small></b>
<small>Explain how you know.</small>
They each made a pie chart of what they found.
<b>Estimate the number of worms that Tony found.</b>
<b>Who found more snails?</b>
Circle Tony or Gemma.
Tony / Gemma
Explain how you know.
They each made a pie chart of what they found.
<b>Estimate the number of worms that Tony found.</b>
<b>Who found more snails?</b>
Circle Tony or Gemma.
Tony / Gemma
Explain how you know.
They each made a pie chart of what they found.
<b>Estimate the number of worms that Tony found.</b>
<b>Who found more snails?</b>
Circle Tony or Gemma.
Tony / Gemma
Explain how you know.
They each made a pie chart of what they found.
<b>Estimate the number of worms that Tony found.</b>
<b>Who found more snails?</b>
Circle Tony or Gemma.
Tony / Gemma
Explain how you know.
[2 marks]
<b>55</b>
[2000]
</div><span class="text_page_counter">Trang 6</span><div class="page_container" data-page="6"><small>“The pie charts show that more girls than boys liked milk chocolate best.”</small>
<small> Dev is correct. </small>
<small>Explain how you know.</small>
<small>1 mark</small>
<small>1 mark</small>
<small>M004088_chocolate pie – 14 April 2015 1:01 PM – Version 3</small>
<small>KS2 item template version 1.1</small>
</div><span class="text_page_counter">Trang 7</span><div class="page_container" data-page="7"><b><small>40 children predicted who would win the boys’ race at sports day.</small></b>
<small>This pie chart shows their predictions.</small>
<b><small>10 children predicted the winner of the race correctly.</small></b>
<small>Who won the race?Explain how you know.</small>
</div><span class="text_page_counter">Trang 8</span><div class="page_container" data-page="8"><small>Total out of 6</small>
The pie charts show the results of a school’s netball and football matches.
<b>The netball team played 30 games.The football team played 24 games.</b>
Estimate the percentage of games that the
<b>netball team lost.</b>
David says,
<i><b>‘The two teams won the same number of games’.</b></i>
Is he correct? Circle Yes or No.
Explain how you know.
</div><span class="text_page_counter">Trang 9</span><div class="page_container" data-page="9"><b><small>The next day another boy joins Sarah’s class.</small></b>
<small>She makes a new pie chart.</small>
<b><small>Calculate the angle for boys on the new pie chart.NumberSize of angle</small></b>
<b><small>in classon pie chart</small></b>
</div><span class="text_page_counter">Trang 10</span><div class="page_container" data-page="10">Megan asked children from two different schools, ‘How do you travel to school?’
Here are her results.
</div><span class="text_page_counter">Trang 11</span><div class="page_container" data-page="11"><small>23 </small>
Megan says,
‘The number of children walking to Foxwood school is more than the number walking to Midtown school.’ Is she correct?
Explain how you know.
<small>1 mark</small>
At Midtown school, one third of children travel by car.
The number of children who cycle is the same as the number who
</div><span class="text_page_counter">Trang 12</span><div class="page_container" data-page="12"><small>The Year 6 children in a school were asked to choose a musical </small>
<b><small>Estimate what fraction of the children chose a drum.</small></b>
<b><small>There are 80 children in Year 6.</small></b>
<b><small>Sam spins A 100 times and B 100 times. </small></b>
<b><small>The arrows on the line show how many times each spinner lands on an odd number. </small></b>
<b><small>33. The Year 6 children in a school were asked to choose a musical instrument. This is a </small></b>
<small>pie chart of their choices. </small>
</div>