BEYOND THE BLUE BOX ONTARIO’S FRESH START ON WASTE DIVERSION AND THE CIRCULAR ECONOMY
Bạn đang xem bản rút gọn của tài liệu. Xem và tải ngay bản đầy đủ của tài liệu tại đây (3.94 MB, 80 trang )
<span class="text_page_counter">Trang 1</span><div class="page_container" data-page="1">
<b>Beyond theBlue Box</b>
<b>Ontario’s Fresh Start onWaste Diversion and theCircular Economy</b>
A Special Report to the
Legislative Assembly of OntarioOctober 2017
</div><span class="text_page_counter">Trang 2</span><div class="page_container" data-page="2"><b>Select citations have been included to help readers understand where the information the ECO cites comesfrom and to assist them in investigating an issue further should they be interested. Citations may be providedfor: quotes; statistics; data points; and obscure or controversial information. Endnotes for these facts aregenerally only included if the source is not otherwise made clear in the body of the text and if the informationcannot be easily verified. Exhaustive references are not provided.</b>
</div><span class="text_page_counter">Trang 3</span><div class="page_container" data-page="3">October 2017
The Honourable Dave Levac
Speaker of the Legislative Assembly of Ontario Room 180, Legislative Building
Legislative Assembly of Ontario Queen’s Park
Province of Ontario
Dear Speaker,
<i>In accordance with section 58(4) of the Environmental Bill of Rights, 1993, I am pleased to present a Special</i>
Report of the Environmental Commissioner of Ontario for your submission to the Legislative Assembly of Ontario.
<i>Beyond the Blue Box: Ontario’s Fresh Start on Waste Diversion and the Circular Economy reports on the provincialgovernment’s ambitious new Waste-Free Ontario Act, 2016. Ontario rarely adopts a significant new environmental</i>
statute. This Act can be a much needed fresh start for Ontario's waste policy.
For economic, environmental and climate reasons, Ontario must make better use of resources, and transform our pattern of take-use-dispose into a circular economy. In this report, the ECO summarizes key lessons from Ontario's first 40 years of trying to divert waste from landfill, and uses them to understand the main challenges ahead.
The ECO is optimistic that the new law will provide better governance, transparency and accountability than
<i>did the Waste Diversion Act, 2002, which it replaces. Taking organic waste out of landfill will alone contribute</i>
significantly to Ontario's environmental and climate goals, and taking more toxics out of landfill will help protect public health.
But the economic obstacles to a circular economy remain profound. For most Ontarians and most materials, it remains cheaper to buy new stuff, use it briefly and then throw it away than to reuse those resources over and over. This substantial obstacle is due partly to culture and habit, partly to government policy, and partly to the high cost of labour in comparison to the cost of materials.
By paying attention to what has worked, and what hasn't, in the last 40 years, the government can make the
<i>Waste-Free Ontario Act, 2016 a significant tool for improving Ontario's environmental footprint. There are</i>
enough new mistakes to make in the world; let's not make the old ones again.
Dianne Saxe
Environmental Commissioner of Ontario
</div><span class="text_page_counter">Trang 4</span><div class="page_container" data-page="4"><b>CONTENTS</b>
</div><span class="text_page_counter">Trang 5</span><div class="page_container" data-page="5"><b>Executive Summary. . . 4</b>
<b>Part 1: Ontario Has a Waste Problem . . . 10</b>
<b>Part 2: A 40-Year History of Recycling in Ontario . . . 18</b>
<i><b>Part 3: Problems with the Waste Diversion Act . . . 28</b></i>
<b>Part 4: A Fresh Start for Waste Diversion in Ontario . . . 40</b>
<b>Part 5: Beyond Diversion: Looking Forward to the Circular Economy . . . . 54</b>
<b>Part 6: Will the Environment Win? Recommendations . . . 62</b>
</div><span class="text_page_counter">Trang 6</span><div class="page_container" data-page="6"><b>Ontario has a waste problem. For decades, the</b>
Ontario government has pledged to tame this problem. But despite ambitious targets and seemingly widespread recycling, diversion rates have stagnated and the mountain of waste continues
<i>to grow. Now that Ontario has a new Waste-Free</i>
<i>Ontario Act, 2016, what will change?</i>
This Special Report looks at Ontario’s efforts to tackle waste: past, present and future. We look at why waste is such an important environmental issue, and consider what has worked in the past, what hasn't, and why. We then look at what the new law is likely to change, and some key challenges in the transition from the old law to the new one. Finally, we recommend how to maximize the environmental benefit of the new legislation.
In brief, the new law can be expected to improve governance and accountability, and to increase the amount of materials diverted from disposal. It is less clear how much the new approach will overcome the economic obstacles to diversion, and move Ontario toward the much more challenging goal of a circular economy. Ontario must learn from its past failures to change the economics of waste.
<b>Ontario Has a Waste Problem (Part 1)</b>
Ontarians, like most Canadians, throw away far more waste per capita than most people on Earth. About three-quarters of that goes to landfill or incineration.
Landfilling and incinerating waste have adverse environ-mental consequences. They squander valuable resources, can contaminate air and water, and generate powerful green-house gases that increase climate change. Incineration releases toxic
pollutants into the air that can harm human health, while landfilling can release toxins into the soil and groundwater, reduce property values, and use up
FIGURE 1.3. Annual generation and disposal of waste in Ontario in 2014.
Source: Environment and Climate Change Canada,
<i>National Inventory Report 1990-2015: Greenhouse GasSources and Sinks in Canada, Part 2 (2017).</i>
FIGURE 4.1. The environmental impacts of landfilling waste.
<b>Ontario generated 12 million tonnes of waste in 2014</b>
</div><span class="text_page_counter">Trang 7</span><div class="page_container" data-page="7"><b>40 Years of Recycling (Part 2)</b>
Ontario had a waste disposal capacity crisis in the late twentieth century: more and more waste, with less and less landfill space. It therefore became urgent to divert waste from landfills through the “3Rs” (in order of importance): Reduce, Reuse and Recycle. Except for some modest and mostly ineffective attempts at waste reduction and reuse, Ontario has focused on recycling.
Ontario’s much-loved, flagship recycling program, the Blue Box, began as a voluntary initiative. By 1994, the province required most municipalities to offer Blue Box curbside collection of printed paper and some packaging. But packaging waste kept increasing, fund-ing was a constant challenge, and overall diversion rates were modest.
<i>The government introduced the Waste Diversion</i>
<i>Act, 2002 (WDA), to increase waste diversion and</i>
to transfer some of the cost of waste diversion from the taxpayer back to the brand owners and importers of packaging and other products (called “stewards”).
<i>The WDA required stewards of designated wastes to</i>
partially or fully finance and operate a program, via
an Industry Funding Organiza-tion (IFO), to divert that waste
<i>from landfill. The WDA created</i>
an independent, non-govern-ment corporation, Waste Diversion Ontario (WDO), to oversee the development and
operation of waste diversion programs. Creating the WDO was intended, among other things, to insulate the provincial government from the intense and difficult politics of waste.
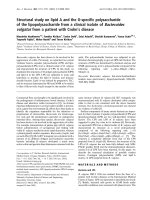
<i>FIGURE 2.3. Diversion rates for the four WDA programs,</i>
plus household organic (i.e., food and yard) waste as a
<i><b>The WDA was only partially successful.</b></i>The resi-dential Blue Box program grew, and three additional mandatory diversion programs were successfully rolled out (used tires, waste electrical and electronic equipment, and municipal hazardous or special waste). But<b>diversion rates stagnated and costsrose,</b>while ever-more wastes were created.
<i>Most of Ontario’s wastes remained outside the WDA,</i>
including organic waste (e.g., food and yard waste) and most industrial, commercial and institutional (IC&I) wastes, which togethermake up over three-quarters of Ontario’s waste.
<b>The old law didn’twork. Waste diversionstagnated at 25% andtaxpayers still pay toomuch.</b>
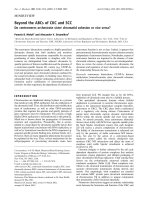
</div><span class="text_page_counter">Trang 8</span><div class="page_container" data-page="8">FIGURE 3.1. Waste diversion by the numbers. Source: Created by the ECO using data from Statistics Canada.
FIGURE 3.4. Most of Ontario’s waste is not yet covered by mandatory diversion programs.
Source: Created by the ECO using data from Statistics Canada, the MOECC, and Stewardship Ontario.
<b><small>mandatory diversion programs</small></b>
<b><small>IC&I: Paper & Packaging, 33%</small></b>
<b><small>Blue Box: Paper &Packaging, 12%</small></b>
<b><small>Personal Electronics, 1%</small></b>
<b><small>Household hazardous, 0.5%</small></b>
<b><small>Tires, 1%</small></b>
In addition, the botched rollout of “eco-fees” (charged to consumers at the point of sale to fund household hazardous waste diversion) became a public relations disaster, which halted the expansion of producer-responsibility-based waste diversion in Ontario.
Meanwhile,<b>WDO and the IFOs had majorproblems of governance, accountability andtransparency.</b>Policy responsibility was unclear and its implementation inconsistent. No one had clear accountability for results. Essential data was confidential or contested. Enforcement of non-compliance was weak. Some rules were perceived to be unfair; some decisions were poorly understood and poorly communicated. Stewards, required by law to pay increasing costs through opaque monopolies (i.e., the IFOs), had neither regulatory nor financial incentives to reduce, reuse or divert more waste or to develop markets for collected materials. Relationships among Blue Box stewards and municipalities deteriorated to litigation over whether stewards were paying their fair share. The province remained enmeshed in bitter struggles among stakeholders of the different programs to the general dissatisfaction of all.
<i>By and large, the WDA and the WDO were</i>
unsatisfactory.
</div><span class="text_page_counter">Trang 9</span><div class="page_container" data-page="9"><i>In 2016, the WDA was repealed and replaced by twocompanion statutes, the Resource Recovery and</i>
<i>Circular Economy Act, 2016 (RRCEA) and the WasteDiversion Transition Act, 2016, collectively called theWaste-Free Ontario Act, 2016. Both are essentially</i>
enabling laws, whose effect will depend upon (future)
<i>regulations. The RRCEA also required the governmentto adopt a formal Strategy for a Waste Free Ontario,</i>
which commits the government to a number of actions to complement the law.
<i>The RRCEA does away with the IFOs, and moves</i>
towards<b>individual producer responsibility</b>, where each producer will be directly financially and legally responsible for the waste it causes its customers to produce. This shift to direct responsibility for individual
producers, if combined (as the Strategy promises) with firm diversion targets,
<b>should result in morediversion</b>of materials that are already collected, perhaps
at a lower cost. The Strategy’s commitment to mandate diversion of additional types of material, as well as potential disposal bans, should further push up provincial diversion rates.
<i>The RRCEA also replaces the WDO with a new</i>
non-Crown, not-for-profit corporation, the Resource Productivity and Recovery Authority.<b>The newAuthority should have improved governance,accountability, transparency, data and enforcement.</b>
<b>A Fresh Start for Waste Diversion in Ontario (Part 4)</b>
FIGURE 4.2. The Waste Hierarchy. Ontario’s new Strategy aims to focus on more than just recycling. Source: Created by the ECO.
<b>Most favoured option</b>
<b>Least favoured option</b>
<b>Our focus should be here</b>
<b>Our current focus is here</b>
</div><span class="text_page_counter">Trang 10</span><div class="page_container" data-page="10"><b>Beyond Diversion: Looking Forward tothe Circular Economy (Part 5)</b>
<i>Even more ambitious, the RRCEA and the Strategy</i>
commit to moving Ontario to a circular economy. In a circular economy, resources would not be used once and then discarded as trash. A circular economy would overcome economic
and social barriers – the high costs of waste diversion, the low cost of (especially US) landfills, the fluctuating values of most collected materials, and the
ever-growing diversity of wastes – so that resources are used efficiently
and repeatedly, with commercially successful markets for diverted materials and closed-loop forms of production. As in nature, resources would be used again and again, ideally being continually used for their highest and best use.
FIGURE 5.1. Linear Economy versus the Circular Economy. Source: Sustainable Brands.
<b>Will the Environment Win? (Part 6)</b>
In the short term, three waste diversion (recycling)
<i>issues are critical for the RRCEA to be an </i>
environ-mental success:
• Minimizing organics in landfill and using them as a resource instead;
• Ensuring stringent, enforceable (and enforced) standards for what counts as “recycling”; and
• Extending mandatory diversion to IC&I and other high-priority wastes.
<b>In the long run, what mattersmost is the Strategy’sambitious vision of a circulareconomy.</b>This is an enormous goal, with enormous potential benefits for the environment and
our climate, but one that Ontario cannot achieve on its own. Ontario can move in this direction by minimizing how much waste we generate, and by maximizing the value, and the use, of the resources that waste contains.
Many of the economic and policy issues that have plagued the province for decades, especially the high
cost of diversion as compared to land-fill, could continue to challenge Ontario waste policy under the new law. Key to achieving Ontario’s new vision of a circular economy is learning from our past mistakes.
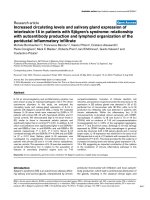
FIGURE 1.4. Portion of total greenhouse gas emissions reported from waste, and breakdown of sources of waste emissions. Source: Environment and Climate Change
<i>Canada, National Inventory Report 1990-2015: Greenhouse Gas Sources and Sinksin Canada, Part 2 (2017).</i>
<small>Emissions from landfills (89.5%)</small>
<small>Emissions from composting and anaerobic digestion (3.5%)Emissions from wastewater treatment and discharge (3.7%)Emissions from incineration and open burning (3.4%)</small>
</div><span class="text_page_counter">Trang 11</span><div class="page_container" data-page="11"><b>The ECO recommends that the Ministry of theEnvironment and Climate Change:</b>
<b>1.set deadlines for the actions identified in its</b>
<i><b>Strategy for a Waste Free Ontario;</b></i>
<b>2.adopt some form of disposal ban on food waste;</b>
<b>3.make the process for approving anaerobicdigestion and composting facilities fast andpredictable, while protecting public health andenvironmental interests;</b>
<b>4.develop recycling standards that are clear,enforceable and provide a high level ofenvironmental protection;</b>
<b>5.expand and enforce source separation anddiversion obligations for the IC&I sectors;</b>
<b>6.document how new waste policies compare tothose tried before, and what lessons have beenearned from previous efforts;</b>
<b>7.make the ultimate goal of Ontario’s circulareconomy policies the creation of profitablemarkets for all end-of-life materials; and</b>
<b>8.work with other ministries to integrate circulareconomy objectives into policy and practice</b>
</div><span class="text_page_counter">Trang 12</span><div class="page_container" data-page="12">Part 1:
Ontario Has a Waste Problem
Ontarians produce an enormous amount of waste. Most of it ends up in landfills. Landfilling and
incinerating waste has adverse environmental
consequences, and siting new facilities is very hard. Part 1 explores the environmental consequences of our
high-consumption, high-waste lifestyle in order to better understand why enhanced waste diversion is so important.
<b>We throw out toomuch. Most of itgoes to landfill.</b>
</div><span class="text_page_counter">Trang 13</span><div class="page_container" data-page="13"><b>PART 1:</b>
<b>ONTARIO HAS A WASTE PROBLEM</b>
<b>1.0Ontario Generates a Lot of Waste. . . 12</b>
<b>1.1Why is Waste a Problem? . . . 12</b>
<b>1.1.1Environmental Consequences of Waste Disposal . . . 12</b>
<b>1.1.2Focus on Climate: Waste has a Bigger Impact ThanWe Think . . . 13</b>
<b>Life Cycle of a Cell Phone . . . 15</b>
<b>1.1.3Waste Disposal Capacity . . . 16</b>
<b>1.2Why Do We Create So Much Waste? . . . 16</b>
<b>1.2.1Complexity and Inconvenience . . . 16</b>
</div><span class="text_page_counter">Trang 14</span><div class="page_container" data-page="14"><b>1.0 Ontario Generatesa Lot of Waste</b>
Ontario produces an astonishing amount of waste: about 12 million tonnes annually.<small>1</small><i><b><small>a</small></b></i>Overall, Canada produces more garbage per capita than most other countries in the world.<small>2</small>With over a third of the country’s population calling Ontario home, the prov-ince carries a fair share of the blame for that title.<small>3</small>
FIGURE 1.1. Canada's annual waste generated, calculated per person (850kg), compared to the U.S. (940 kg), France (700 kg), U.K. (653 kg) and Sweden (587 kg).
<i>Source: The World Bank, What a Waste: A Global Reviewof Solid Waste Management (2012).</i>
We throw out all kinds of stuff: food, electronics, mattresses, pharmaceuticals, appliances, tools, lightbulbs, batteries, carpets, construction materials, textiles, plastics, paper, packaging and much more.
FIGURE 1.2. Rough breakdown of Ontario's waste stream.
<i>Source: Data from the MOECC’s 2013 Waste Reduction Strategy.</i>
<b>of our waste is thrown out</b>in landfills (and some in incinerators). In 2014, the most recent year for which full data is available, Ontarians sent about 9 million tonnes of materials to landfills and incinerators.<small>4</small>Two thirds of this waste – about 6 million tonnes – went to Ontario landfills, while 2.7 million tonnes was exported to landfills in the United States, and 3% went to incineration<small>5</small>(see Figure 1.3).
FIGURE 1.3. Annual generation and disposal of waste in Ontario in 2014.
Source: Environment and Climate Change Canada,
<i>National Inventory Report 1990-2015: Greenhouse GasSources and Sinks in Canada, Part 2 (2017).</i>
1.1<b>Why is Waste a Problem?</b>
1.1.1<b>Environmental Consequences ofWaste Disposal</b>
<b>Poorly managed waste can cause serious environ-mental problems.</b>One major issue is that when waste is disposed in landfill and rainwater filters down through that buried waste, it picks up metals, chloride and other minerals, nutrients, chemicals and other toxic materials, creating a contaminated liquid called “leachate.” Some older landfills, which lacked rigorous leachate collection systems, contaminated ground and surface water with their leachate. Modern landfills are now required to have
<i><b><small>a</small></b></i>There are a number of different sources of data on waste disposal and diversion rates in Ontario. In this report, we rely largely on Statistics Canada information, but both the Ontario Waste Management Association and the Resource Productivity and Recovery Authority also collect data on certain aspects of the Ontario waste sector. The numbers vary somewhat from data source to source, and the most recent year available differs by source as well. We have chosen to rely primarily on Statistics Canada, where
</div><span class="text_page_counter">Trang 15</span><div class="page_container" data-page="15">be operated for decades into the future.<small>6</small>
Decomposing waste in landfills also produces gases that can cause fires, damage vegetation and create unpleasant odours. Some of these gases are powerful greenhouse gases (GHGs) that drive climate change. In 2015, 5.2% of Ontario’s total GHG emissions –
with 8 megatonnes (mostly methane) coming directly from landfills and incinerators (the other 0.6 mega-tonnes came from composting and wastewater treatment) (see Figure 1.4).<small>7</small>Although some of this methane is captured and can be used as fuel (marketed as “biogas” or “renewable natural gas”), most of the gas generated is released to the
<i>atmos-phere (see Focus on Climate box below).</i>
<b>1.1.2 Focus on Climate: Waste has a Bigger Impact Than We Think</b>
The official inventory, shown in Figure 1.4, of the waste sector’s contribution to Ontario’s GHG emissions do not
<i>tell the whole story. As reported by the ECO in our 2016 Annual Greenhouse Gas Progress Report, Facing Climate</i>
<i>Change (see Chapters 2 and 3), the emissions officially attributed to waste understate the total amount and</i>
impact of GHG emissions that come from waste and drive climate change.
<i><b>Official reports don’t include all the waste generated in Ontario</b></i>
For the purposes of calculating Ontario’s GHG emissions from waste, only the emissions from waste disposed of within the province are included. This methodology is consistent with international emissions reporting guidelines that are used by countries when reporting their GHG emissions (as required by the United Nations Framework Convention on Climate Change).<small>8</small>This approach, however, does not provide Ontarians with a complete picture of our contribution to global GHG emissions from waste.
For example, it fails to include the emissions from the millions of tonnes of waste shipped out of Ontario each year to landfills in the United States. Because much of this waste is carried by private haulers, it is difficult to determine the exact amount of waste involved. The federal government estimates that about 2.7 million tonnes of waste were exported in 2014 (although according to MOECC, the amount could be as much as 3.3 million tonnes) – roughly 30% of all waste generated in Ontario.<small>9</small>
<i><b>Official reports underestimate the amount of waste going into Ontario landfills</b></i>
The most recent federal data (from Statistics Canada and Natural Resources Canada) reported that Ontario landfills – the main source of the waste sector’s GHG emissions – received approximately 6.1 million tonnes of waste in 2014, resulting in 7.7 megatonnes of GHG emissions.<small>10</small>
FIGURE 1.4. Portion of total greenhouse gas emissions reported from waste and breakdown of sources of waste emissions.
Source: Environment and Climate Change
<i>Canada, National Inventory Report 1990-2015:Greenhouse Gas Sources and Sinks in Canada,Part 2 (2017).</i>
<small>Emissions from landfills (89.5%)</small>
<small>Emissions from composting and anaerobic digestion (3.5%)Emissions from wastewater treatment and discharge (3.7%)Emissions from incineration and open burning (3.4%)Total emissions</small>
<small>Emissions from waste (5.2%)</small>
</div><span class="text_page_counter">Trang 16</span><div class="page_container" data-page="16"><i>Landfill Report. Based on a survey of the Association’s members, this report concluded that Ontario landfills received</i>
7.7 million tonnes of waste in 2014.<small>11</small>This suggests that the Government of Canada is significantly underestimating the amount of waste landfilled in Ontario each year, and thus the amount of GHGs generated by Ontario landfills and the waste sector.
<i><b>Official reports overestimate the efficiency of gas capture systems</b></i>
Large Ontario landfills are required to capture, and then use or burn, GHGs generated from the site.<small>12</small>Government estimates of the amount of GHGs released from landfills rely on assumptions about the efficiency of these capture systems; overestimating the level of efficiency will underestimate the gases released. The ECO has previously documented flaws in these assumptions, which mean that official estimates understate GHG emissions from
<i>Ontario landfills (see the ECO’s 2012 Annual Greenhouse Gas Progress Report, A Question of Commitment,</i>
pp. 68-69).
<i><b>Official reports hide the near-term importance of methane</b></i>
Canada follows internationally accepted protocols when it calculates GHG emissions from each sector in each province. These protocols include factors that are used to convert the measure of different types of gases into one common unit based on the gas’ unique climate change impact. This allows governments to more easily tally and compare the total emissions contribution of different sectors and different gas types.<small>13</small>
<b>Much of the gas released from landfills is methane, a potent greenhouse gas.</b>In recent years, it has become clear that the impact of methane on climate change is more potent than previously thought.<small>14</small>As a result, the factor used to convert the measurement of methane into the common unit underrepresents its climate change impact – meaning that methane’s impact has been underreported. When estimating the impact of a given GHG, most calculations focus on the impact of the gas over a 100-year time span; this hides the fact that methane is about 100 times more potent than CO<sub>2</sub>during the time it stays in the atmosphere (about 12.6 years).
Taken together, these two factors mean that the impact of methane on the climate has historically been
underestimated. When the ECO recalculated the contributions of methane from waste based on a higher – and, in the ECO’s opinion, more accurate – global warming potential on a 20-year basis, we found that waste is responsible for 15% of all Ontario emissions – not 5.2% as is officially reported.<small>15</small>
Air pollution is another problem created by waste. Incineration releases particulate matter and small amounts of toxic pollutants, such as dioxins and furans, which are known contributors to health problems.
Waste also ends up as litter. Litter is unsightly and expensive to manage, and can pose significant problems to ecosystems and wildlife. For example, plastic garbage can break down and be ingested by microscopic organisms and larger wildlife, introducing toxic chemicals into their bodies and the food chain (for more on this issue, see Part 3.2 of the ECO’s 2014/2015 Annual Report).
Lastly, but certainly not least, every missed opportunity to reuse and recycle materials that otherwise go into the waste stream (and to design products to be reusable and more durable in the first place), means new materials must be extracted from the earth. Extracting new materials (e.g., through mining) gener-ates GHG emissions, water pollution, and toxic
<i>chemicals, as discussed below in Life Cycle of a Cell</i>
<i>Phone. The amount of carbon dioxide embodied in</i>
the materials extracted and in the goods produced and transported around the world each day represent a massive, under-recognized source of GHG emissions. Further, throwing organic materials (like banana peels and corn cobs) in the garbage wastes valuable nutrients that could be spread on farm fields as
</div><span class="text_page_counter">Trang 17</span><div class="page_container" data-page="17"><b>Life Cycle of a Cell Phone</b>
The life of a typical smart phone makes a perfect case study of the significant environmental consequences of mining, refining and manufacturing a single product: GHG emissions are generated; landscapes are de-naturalized; water is polluted; and toxic chemicals are emitted at almost every stage of the industrial manufacturing process.
Cell phones have become one of the most ubiquitous signs of modern life. Over 85% of Canadian households subscribe to mobile phone services and almost 75% of Canadians have a smartphone (as opposed to a basic cell phone).<small>16</small>Smartphones, in particular, have dramatically changed how many of us interact with the wider world. For many, it is difficult to imagine being without the entire Internet at one’s fingertips, let alone the convenience of being able to contact anyone at any time. As important as they are to so many, most cell phones lead relatively transient lives – they come and go quickly, with the average Canadian phone being replaced every 2.5 years.<small>17</small>
The 62 different metals<small>18</small>contained in the average cell phone must be mined from all corners of the globe, and then processed using and creating toxic chemicals that often contaminate the surrounding air, water and soil. By one estimate, the gold contained in just one phone creates 100 kilograms of mining waste.<small>19</small>Plastic, contained in equal part to metals in the average cell phone, is almost always made from fossil fuels and the plastic anticipated to be used in 2017 cell phone production will use over 7 million barrels of crude oil.<small>20</small>Other parts are made from materials like glass and ceramics,<small>21</small>which require sand, obtained from quarries, as a source ingredient.
These refined materials are then manufactured into component parts, and assembled into the cell phone. Globally, most of this work takes place in China.<small>22</small>During this part of the process, workers may be exposed to toxic materials like mercury and lead,<small>23</small>which have massive impacts on human health as well as the surrounding environment.<small>24</small>These phones are then shipped around the world, generating greenhouse gas emissions and packaging waste in the process.
A few short years later, these phones are discarded. Most Canadians give away, store or recycle their old cell phones, but about 5-10% of old cell phones are still sent directly to landfill.<small>25</small>
In the landfill, the metals and plastics in cell phones can con-tribute to toxic leachate, which can pollute groundwater and soil. Additionally, failing to recycle cell phones means a missed opportunity to recover metals that can be reused. For example, copper can be completely recovered without losing quality, and the process uses about 80% less energy than required to mine and refine the same amount of virgin copper.<small>26</small>Moreover, it is becoming increasingly difficult to find economically acces-sible sources of many of the metals in cell phones, which may result in shortages of affordable metals.<small>27</small>
FIGURE 1.5. Life of a Cell Phone Source: Created by the ECO.
</div><span class="text_page_counter">Trang 18</span><div class="page_container" data-page="18">1.1.3<b>Waste Disposal Capacity</b>
Another problem with throwing out so much waste is that it creates a powerful demand for landfills (and incinerators), which are unpopular neighbours. Few people want one of these facilities near them. Because of numerous environmental problems caused by older landfills (see the ECO’s 2009/2010 Annual Report,
<i>Redefining Conservation, Part 6.1), it has become</i>
extremely difficult and expensive to find suitable locations for new facilities. Proposals for new or ex-panded landfills are often faced with intense public opposition and/or litigation from those concerned with potential environmental ramifications and/or decreased property values.
1.2<b>Why Do We Create SoMuch Waste?</b>
<b>Waste is a complicated problem with many causes.</b>
One factor is just how much we consume. The average Ontarian, like the average North American, has a lot of ‘stuff.’<small>28</small>Global supply chains and improved technology provide Ontarians and people around the world with ever easier, cheaper access to almost any product they might desire. Moreover, much of that ‘stuff’ cycles faster than ever through our lives and homes. Cell phones are replaced every two and a half years on average, with many other electronics not lasting much longer.<small>29</small>Clothing, increasingly inexpensive and subject to the ever-changing trends of “fast fashion,” often lasts only a season or two.<small>30</small>
Many kitchens are dominated by packaged food, single-use coffee pods, and disposable cleaning wipes, pads and scrubbers.<small>31</small>Scale up this “out with the old, in with the new” mentality to other items, such as appliances and furniture, and the amount of waste we produce grows exponentially.
and the convenience of packaged food and disposable cleaning materials have all made life easier for many Ontarians, but today’s consumer culture also creates massive, often invisible, environmental impacts. Most of the products in an average Ontario home are made from materials mined or manufactured outside of Canada, and curbside waste collection across most of the province means few of us see the volume of waste we generate in anything more than small weekly increments. As a result, many Ontarians never turn their mind to the impacts this high-con-sumption, high-waste lifestyle has on the environment.
Consumer culture is not the only factor. It can be challenging for even the most motivated consumer to avoid creating waste every day. For example, health and safety laws, fear of tampering, theft prevention and marketing all contribute to large amounts of packaging waste. Consumer products and appliances are often cheaper to replace than to repair, partly because they are designed that way and partly because labour costs where most products are made are so much lower than they are in Canada. Appliance certifications, such as EnerGuide, focus on operational efficiency and ignore durability.<small>32</small>
“Best before” dates and liability laws may strive to protect health but also contribute to food waste. Bedbugs have made it challenging to reuse
mattresses and upholstered furniture. Time-starved households may understandably choose convenience over waste minimization.
1.2.1<b>Complexity and Inconvenience</b>
Another factor is likely the often-complex network of recycling options. While it is possible to recycle many items, from single-use batteries to used oil filters, the availability of recycling for individual materials differs from municipality to municipality, and many people are simply unaware of the options or find the distinctions confusing. Accordingly, about 15% of household garbage consists of recyclable materials that should have gone into the Blue Box:
</div><span class="text_page_counter">Trang 19</span><div class="page_container" data-page="19">FIGURE 1.6. Breakdown of recyclable materials found in the garbage.
Source: Continuous Improvement Fund, Co-Ordinated Waste Composition Studies Update.
recycling options, it may not be convenient to make use of them. Throwing an item in the trash is far simpler than tracking down the proper recycling facility, especially in rural areas. Lack of infrastructure may pose another challenge. For example, many multi-unit residential buildings, which have much lower recycling rates than single family homes, were built with no easy way to accommodate source-separated materials. Typically, there is only one garbage chute, and there may be no appropriate space for recycling trucks to pick up recyclable
</div><span class="text_page_counter">Trang 20</span><div class="page_container" data-page="20">Part 2:
A 40-Year History of Recycling in Ontario
For almost four decades, the Ontario government has tried to tame the province’s waste. Part 2 looks at the history of waste management in Ontario, including the creation of the Blue Box and the
<i>introduction of the Waste Diversion Act, 2002 (WDA).Part 2 also details the key elements of the WDA, as a basis</i>
of comparison with the new law, described in Part 4 of this report.
<b>We’ve been tryingto divert wastefrom landfill for40 years.</b>
</div><span class="text_page_counter">Trang 21</span><div class="page_container" data-page="21"><b>PART 2:</b>
<b>A 40-YEAR HISTORY OF RECYCLING IN ONTARIO</b>
<b>2.0What is “Waste Diversion”? . . . 20</b>
<b>2.0.1 When Does Waste Need Diversion Regulation? . . . 20</b>
<b>2.1A Brief History of Waste Diversion in Ontario . . . 21</b>
<b>2.1.1Why Diversion? . . . 21</b>
<b>2.1.2Voluntary Diversion: The BlueBox Program . . . 21</b>
<b>What Happened to “Reduce” and “Reuse”? . . . 22</b>
<b>2.1.3</b><i><b>First Law: Environmental Protection Act . . . 22</b></i>
<i><b>2.1.4 Second Law: Waste Diversion Act, 2002 . . . 23</b></i>
<b>2.2</b><i><b>Key Elements of the Waste Diversion Act, 2002 (WDA) . . . 23</b></i>
<b>2.2.1</b><i><b>The WDA Shifted Some Responsibility to</b></i> <b>Steward Organizations . . . 23</b>
<b>2.2.2 Diffused Direction and Oversight: The Minister andWaste Diversion Ontario . . . 24</b>
<i><b>2.2.3 The WDA Increased Funding, Helped Grow the Blue Box . . . . 24</b></i>
<i><b>2.2.4 The WDA Expanded the Number of Recycling Programs . . . . 25</b></i>
<b>Alternative Industry-Run Recycling Programs . . . 25</b>
<b>Beer and Alcohol Container Deposit-Return Programs . . . . 26</b>
</div><span class="text_page_counter">Trang 22</span><div class="page_container" data-page="22"><b>2.0.1 When Does Waste Need Diversion Regulation?</b>
Resources are readily recovered and reused when good economics make waste diversion pay for itself.<b>Whenmarkets work well to keep materials in use, governments should be slow to meddle.</b>For end-of-life materials with reliable market value, government waste diversion regulations (including producer responsibility schemes) may do more harm than good.<small>33</small>Only when recycling is unprofitable is government regulation (such as mandating producer responsibility or banning materials from landfill) needed to keep wastes out of landfill.
For example, privately owned scrap yards compete to recycle metal items because of the robust markets for many metals. Similarly, consumers need no laws to keep old cars out of landfill, because they can easily find someone to pay for them. End-of-life vehicles like old cars are bought and sold, disassembled and processed in an elaborate system of for-profit private companies independent of the original vehicle manufacturers. They remove parts for refurbishment and resale, sell metal frames to steel mills, etc. and send to landfill only what they cannot sell.
On the other hand, waste diversion regulation is necessary to avoid disposal of potentially recyclable materials (like textiles, tires, mattresses, plastics, hazardous wastes, etc.) when the cost of recycling is higher than the revenue that it can generate. For such materials, imposing responsibility back on the original producer may be the best answer until a consistent profit can be made from recycling. Good government policy should ultimately work towards creating<b>a profitable market for all end-of-life materials</b>that we use (see Part 6.1.5).
<b>2.0 What is “Waste</b>
Waste diversion has historically been the term used in Ontario for preventing waste from going to a land-fill or incinerator. Recently, government has changed its language and replaced this term with “resource recovery” to emphasize the importance of not just diverting waste from landfill, but also reutilizing the materials. Whether called “waste diversion” or “resource recovery,” these efforts include what is often summarized as the “3Rs”:
• <b>Reduce the generation of waste through</b>
reduced consumption.
• <b>Reuse products that already exist.</b>
• <b>Recycle the remaining materials that</b>
cannot be reused.
There is sometimes a 4<small>th</small><b>“R”, for energy Recovery</b>
from incineration. The role of energy recovery in waste diversion has been contentious in Ontario (see Box
<i>“What about the Fourth R, Recovery?” in Part 4.2).</i>
</div><span class="text_page_counter">Trang 23</span><div class="page_container" data-page="23">2.1<b>A Brief History of WasteDiversion in Ontario</b>
2.1.1<b>Why Diversion?</b>
Ontario had a waste disposal capacity crisis in the late 20<small>th</small>century: more and more waste, with less and less landfill space. A growing quantity of waste, coupled with the difficulty of siting new landfills, created<b>an urgent need to divert materials fromlandfills,</b>even though waste diversion typically costs more than landfill.
<b>2.1.2 Voluntary Diversion:The Blue Box Program</b>
Throughout the 1970s and 1980s, the government tried, with little success, to curb the growth in disposable beverage containers, which were replacing refillable containers<small>38</small><i>(see What Happened to</i>
<i>“Reduce” and “Reuse”?). Around this same time,</i>
Ontario’s flagship recycling program, the Blue Box, emerged as a voluntary initiative.<small>39</small>Gradually, more and more municipalities began to offer residential Blue Boxes as part of their waste collection, in order to save scarce landfill space. However, waste diversion was modest and funding was always a challenge. market may exist for one product and not for a closely related one. For example, consider batteries. Lead acid (car) batteries are the most completely recycled consumer product in North America, with an estimated recycling rate of over 95%.<small>34</small> This is not due to government regulation or to any waste diversion program. Rather, used lead acid batteries stay out of landfill because there is a reliable market for them. Lead smelters compete to purchase such batteries, to melt them down for use in new batteries. Other entrepreneurs compete to collect such batteries and to sell them to the smelters, making a profit along the way. Even if lead acid batteries end up at a landfill, landfill operators pick them out for resale.
The situation is entirely different for other classes of batteries, such as the small single-use batteries that power flashlights, toys and television remotes. Because of high processing costs and low yields, recycling these batteries costs money.<small>35</small>The consequence? Diversion rates for single-use batteries were about 5% up until 2009,<small>36</small>meaning that the toxic metals and acids in these batteries almost always went to landfill.
In these widely different economic circumstances, no “one size fits all” policy would work. Ontario’s waste oversight body (Waste Diversion Ontario) unwisely considered lumping all types of batteries together into a single waste diversion program that would have cannibalized the existing lead acid battery market and created an uneven playing field among the competing businesses, in order to subsidize single use battery collection. This proposal was rejected. Instead, two single-use battery diversion programs, one mandatory and one voluntary, have now pushed Ontario diversion rates for single use batteries up to 33%.<small>37</small>
</div><span class="text_page_counter">Trang 24</span><div class="page_container" data-page="24"><b>What Happened to “Reduce” and“Reuse”?</b>
Historically, Ontario – like most other jurisdictions – has focussed heavily on the third and lowest priority R: recycling. Relatively little attention has been paid to the first two Rs (reducing the generation of waste in the first place and reusing used products and packaging).<small>40</small>
The reasons are illustrated by the Ministry of the Environment and Climate Change’s (MOECC’s) attempts to minimize carbonated beverage (soda pop) waste packaging. Decades ago, the beverage industry started switching from refillable glass bottles to “once-through” containers, such as cans and plastic bottles. Manufacturers, retailers and consumers preferred the new containers, which were lighter, unbreakable, cheaper to ship and easier to stack. Once-through containers also avoided the deposit-return system, and the messy process of storing, returning and cleaning empties.
There were, of course, consequences. Local bottlers were forced out of business, and consumers started discarding heaps of beverage containers as waste and litter, saddling municipalities with the costs of waste disposal and litter cleanup.
preserve the market for refillable glass soda bottles. It adopted and tried to enforce a law that required reusable bottles and a law requiring equal adver-tising for soda in refillable bottles, but it could not stem the tide of the new disposable containers.
Eventually, the MOECC abandoned the fight. The ministry ultimately compromised by setting only minor limits to non-refillable containers (and stopped enforcing even those),<small>41</small>coupled with an agreement from the beverage industry to partially fund a municipal collection program for non-reusable beverage containers. The rest of the cost was left to municipalities and their taxpayers. This set the stage for the Blue Box program that provides curbside pickup of household printed paper and packaging, plastic and cans from most Ontario single family homes. It also set<b>a powerfulprecedent: Ontario would only make industrypay part of the cost</b>of end-of-life management of the wastes they cause consumers to create, and then only for residential waste. Municipalities would be left to pay the rest.
<i><b>2.1.3 First Law: Environmental</b></i>
<i>The Environmental Protection Act (EPA) is Ontario’s</i>
first and main law used to regulate waste manage-ment in the province,<small>42</small>and included some early waste diversion regulations. In 1994, Ontario
<i>adopted the ‘3Rs’ regulations under the EPA, which</i>
remain in force today:
• The first 3R regulation (O. Reg. 101/94) requires municipalities with a population over 5,000 to offer curbside residential collection of: most plastic, glass and aluminum bottles and other packaging (such as jars, tins and containers);
paper (such as newspaper); and cardboard. These materials are generally collectively referred to as “paper and packaging.”
• The other 3R regulations (O. Reg. 102/94, O.Reg. 103/94, and O. Reg. 104/94) require some large industrial, commercial and institutional facilities to: conduct waste and packaging related audits and prepare reduction workplans; separately collect some common recyclables; and make reasonable efforts to ensure that source separated wastes are reused or recycled.
<i><b>2.1.3 First Law: Environmental Protection Act</b></i>
</div><span class="text_page_counter">Trang 25</span><div class="page_container" data-page="25">diversion programs (distinct from those created
<i>under the Waste Diversion Act, 2002), including</i>
the collection program for pharmaceuticals and sharps,<small>43</small>and the Beer Store bottle deposit program
<i>(see box, Beer and Alcohol Container Deposit-Return</i>
<i><b>2.1.4 Second Law: Waste Diversion</b></i>
<i><b>Act, 2002</b></i>
Despite the 3Rs regulations, packaging and other waste kept increasing throughout the 1990s,
<b>funding for the Blue Box program was a constantchallenge, and diversion rates remained modest.</b>
In the absence of a strong market for collected materials, more funding was needed to increase diversion. Therefore, in 2002, the province adopted
<i>a new law, the Waste Diversion Act, 2002 (WDA)</i>
to expand waste diversion programs in Ontario.
<i>The WDA was intended “to promote the reduction,</i>
reuse and recycling of waste and to provide for the development, implementation and operation of waste diversion programs.”<small>45</small><i>The WDA and its</i>
regulations required industry to fund 50% of the Blue Box program, and set diversion targets for the Blue Box (the original target was to achieve 50% diversion by 2006, later increased to 60% by 2008).
<i>The WDA eventually added three other provincially</i>
mandated, industry-funded recycling programs: municipal hazardous or special waste; used tires; and waste electrical and electronic equipment (see Part 2.2.4).
<i>The WDA was repealed in November 2016, whenthe Resource Recovery and Circular Economy Act,</i>
<i>2016 (RRCEA) came into effect.</i>
<b>2.2 Key Elements of the</b>
<i><b>Waste Diversion Act,2002</b></i>
<i><b>2.2.1 The WDA Shifted Some</b></i>
<b>Responsibility to StewardOrganizations</b>
<i>The WDA was Ontario’s first legislative foray towards</i>
“extended producer responsibility” (EPR). The theory of EPR is to hold the manufacturers or importers of products responsible (financially and/or physically) for the end-of-use management (e.g., reuse, recycling and/or disposal) of their products and/or packaging, rather than either the individual who used the prod-uct or municipal governments.<small>46</small>
<i><b>A key feature of WDA diversion programs were</b></i>
<b>Industry Funding Organizations (IFOs).</b>IFOs were statutory corporations representing and funded by all companies with a commercial connection to a designated waste, called “stewards.”<b><small>b</small></b> IFOs developed and operated most waste diversion programs, except for the Blue Box. The Blue Box program continued to be operated by municipalities, as required by O. Reg. 101/94, with partial funding from Steward-ship Ontario (the IFO for the Blue Box). Each IFO collected data and set and collected fees from its stewards (e.g., the electronics IFO would collect fees from manufacturers and retailers like Sony, Dell and Best Buy) to cover some or all of the costs of diverting the designated product or packaging from the waste stream. The IFOs controlled the data they collected, and kept much of it confidential. This limited their accountability to stewards, to Waste Diversion Ontario (WDO), to municipalities and to the public.
The diversion programs could include: activities to reduce, reuse and recycle the designated waste; research and development related to recycling the designated waste; activities to develop and promote end markets for the resulting recycled materials; and educational and public awareness activities.
<b><small>b</small></b><i>“Stewards” was the preferred term for responsible entities under the WDA. The Ontario government seems to have abandonedthis term, instead favouring “producers” for responsible entities under the RRCEA (though it is largely the same entities affectedunder both laws). Accordingly, in this report, we use “stewards” when speaking in the context of WDA responsibilities, and</i>
otherwise use “producers.”
</div><span class="text_page_counter">Trang 26</span><div class="page_container" data-page="26"><b>2.2.2 Diffused Direction and Oversight:The Minister and Waste DiversionOntario</b>
<i><b>Responsibility for the success of WDA diversion</b></i>
<b>programs was diffuse.</b>
WDO, a non-government corporation, had primary
<i>oversight duties under the WDA. WDO oversaw the</i>
development, implementation and operation of diversion programs, and reported to government on their effectiveness. For the first ten years, WDO was run by a board that represented industry, municipal-ities and other interested parties, but was dominated by stewards.<small>47</small>In 2012, the Minister of the Environment and Climate Change changed the WDO board to a “skills-based” board that he appointed.<small>48</small>WDO was funded by stewards through their IFOs.
The Minister provided broad-brush policy direction, but left most details to the WDO and the IFOs. The Minister: “designated” certain wastes by regulation (i.e., determined which wastes should be diverted); triggered the creation of diversion programs; and “requested” that certain components be included in diversion program plans (such as program targets, accessibility, and promotion and education). The Ministry had exclusive responsibility for enforcing
<i>compliance with the WDA, and could charge the</i>
cost back to the IFOs.
Each waste diversion program required formal approval from the WDO and from the Minister. But although the Minister had to approve each program plan, the Minister could only request, not compel, changes to an approved plan. Once approved, IFOs were responsible for running the programs, except for the Blue Box program, which continued to be delivered by municipalities, primarily at public expense.
<i><b>2.2.3 The WDA Increased Funding,</b></i>
<b>Helped Grow the Blue Box</b>
<i>The WDA and its regulations required industry to</i>
fund 50% of the Blue Box program. Increased funding helped Ontario’s Blue Box program capture a wide variety of materials (see Figure 2.1).
FIGURE 2.1. What’s in the Blue Box.
Source: Continuous Improvement Fund, Co-Ordinated Waste Composition Studies Update.
Capture rates vary among the different Blue Box materials, and remain higher in single-family homes than in multi-unit residential buildings (see Figure 2.2).
FIGURE 2.2. Capture rates for Blue Box materials, for single-family and multi-residential homes.
Source: Continuous Improvement Fund.
<small>Non-Blue Box MaterialsSteel & Aluminum Cans</small>
</div><span class="text_page_counter">Trang 27</span><div class="page_container" data-page="27"><i><b>2.2.4 The WDA Expanded the Number</b></i>
<b>of Recycling Programs</b>
In addition to the Blue Box, the government required WDO to set up three new recycling programs, each operated by an IFO:
<b>• A used tires program, operated by Ontario Tire</b>
<b>• A waste electrical and electronic equipment</b>
<b>(WEEE) program, operated by Ontario Electronic</b>
Stewardship; and
<b>• A municipal hazardous or special waste</b>
<b>(MHSW) program, operated by Stewardship</b>
Ontario (which collects single-use batteries and pressurized cylinders under the “Orange Drop” program);<small>49</small>other household hazardous wastes are operated through alternate diversion
<i>programs (see Alternative Industry-Run Recycling</i>
<i>All of the WDA programs have been successful at</i>
diverting additional wastes. The Blue Box program has remained Ontario’s best known and best loved program, and the most successful of its kind in Canada. The Blue Box has diverted an impressively large amount of material, only surpassed (by weight) in recent years by the growth in voluntary municipal programs for organic waste (see Part 3.1.3 for more on organic diversion).
<i>FIGURE 2.3. Relative diversion rates of each WDA</i>
program, plus household organic (i.e., food and yard waste) as a comparator. Note: for the hazardous waste and electronics programs, because of the nature of these materials, collection rates are used in lieu of diversion rates.
Source: Created by the ECO, using data from
If a steward, or group of stewards, wanted to operate their own funding organization and diversion program – separate and apart from the designated IFO – they could apply to WDO to do so.
WDO approved diversion programs for eight categories of household hazardous wastes,<small>50</small>
which provided alternate diversion programs to the Stewardship Ontario-run program, for:
• Used paints (operated by Product Care Association);
• Pesticides, solvents and fertilizers (operated by Product Care Association);
• SodaStream’s CO<sub>2</sub>cylinders (operated by SodaStream); and
• Antifreeze, empty oil containers and used oil filters (operated by Automotive Materials Stewardship).
In each of these cases, stewards believed it was to their advantage to operate their own
</div><span class="text_page_counter">Trang 28</span><div class="page_container" data-page="28">hazardous wastes weigh comparatively little, diverting these materials from landfill provides disproportionate
<b>environmental and health benefits. The tire program,for example, cleaned up stockpiles of old tires</b>
<b>around the province, which had posed a significantfire and environmental risk, as illustrated by the</b>
1990 Hagersville tire fire.
Similarly, electronic and hazardous waste contain toxic chemicals that can contaminate landfill leachate, or, in the case of hazardous materials flushed down drains or poured down sewers, can contaminate water sources. A 2009 study found that waste diversion programs operating in Ontario in 2007 provided an annual benefit of nearly $1 billion in avoided environmental and health costs (e.g., the impacts associated with carcinogens, toxics, ocean acidification and climate change).<small>54</small>
Photo of the 1990 Hagersville tire fire, which burned for 17 days, drove 4,000 people from their homes, and cost the province $15-$25 million.<small>53</small>
(Photo credit: Ted Brellisford, The Hamilton Spectator.)
Two of Ontario’s most successful waste diversion programs, with remarkable recovery rates of 88% (beer containers) and 78% (liquor containers), are producer-responsibility programs that operate
<i>outside the WDA. The Beer Store’s deposit-return</i>
program, which is industry-operated and funded, diverted 268,000 tonnes of packaging (mostly glass bottles and metal cans) from landfill in 2016, about 70% of which were refillable bottles (the remainder are recycled).<small>55</small>The Ontario Deposit Return Program for wine, cooler and spirit
containers, which is paid for by the Liquor Control Board of Ontario (LCBO) and operated by the Beer Store, diverted over 111,000 tonnes of packaging from landfill in 2016.<small>56</small>
These deposit-return systems provide a sufficient financial incentive to many consumers to return their own containers; other containers are
collected and returned for profit by private-sector entrepreneurs. Many of the remaining containers end up in municipal Blue Boxes – about 37% of the glass in Blue Boxes is deposit-return material.<small>57</small>
<b>Beer and Alcohol Container Deposit-Return Programs</b>
</div><span class="text_page_counter">Trang 30</span><div class="page_container" data-page="30">Part 3:
Problems with the
<i>Waste Diversion Act</i>
Despite almost four decades of recycling,
<i>including 15 years of the Waste Diversion Act,</i>
<i>2002, Ontario has not had great success</i>
meeting its waste diversion targets. Diversion rates have stagnated and the mountain of waste continues to grow. Part 3 explores the main reasons
for this failure. The province needs to learn from these failures in order
<i>to make a success of Ontario’s new Resource Recovery and Circular</i>
<i>Economy Act, 2016 (RRCEA) and Strategy described in in Parts 4 and 5</i>
of this report.
<b>The old law didn’twork. Waste diversionstagnated at 25% andtaxpayers still pay toomuch.</b>
</div><span class="text_page_counter">Trang 31</span><div class="page_container" data-page="31"><b>PART 3:</b>
<i><b>PROBLEMS WITH THE WASTE DIVERSION ACT</b></i>
<b>3.0Waste Diversion has Stagnated . . . 30The Evolving Tonne . . . 30</b>
<i><b>under the WDA . . . 31</b></i>
<b>Eco-fee Debacle Halted Expansion of Extended</b>
<b>Producer Responsibility . . . 32</b>
<b>3.1.4 Non-Residential Waste Has Been All But Ignored. . . 343.2Economic Barriers . . . 343.2.1Rising Blue Box Costs . . . 353.3Structural Problems . . . 373.3.1EPR Only Partially Realized . . . 373.3.2 Governance, Transparency & Accountability. . . 37</b>
</div><span class="text_page_counter">Trang 32</span><div class="page_container" data-page="32"><b>The Evolving Tonne</b>
Calculating precise waste generation and diversion statistics is challenging, due in part to the changing composition of materials. Waste – both disposed and diverted – is typically measured by weight (even though the number, type and volume of materials is usually more relevant for diversion and disposal costs). For years, the amount of heavy materials (like news-papers, magazines and glass jars) in the Blue Box has
been plunging, while the amount of light, thin and complex plastics has dramatically risen. Similarly, innovation has led to significant reductions in the weight of electronic wastes. This shift from heavy to lighter, more complex materials is referred to as the “evolving tonne”.
Just as happened with soda bottles (see Part 2.1.2),
<b>3.0 Waste Diversion has</b>
In 2004, the province set a goal of recycling or composting 60% of all waste instead of sending it to landfill by 2008.<small>58</small>The many Ontarians who make diligent use of their Blue Box, electronics return opportunities, and/or “green bin” composting programs may think that the province has met this goal.
In fact,<b>Ontario has not made significant gains overthe past two decades in increasing the percentageof waste recycled and composted.</b>Although the total amount (by weight) of waste recycled and composted did grow by 26% between 2004 and 2014,<small>59</small>as a percentage of all waste (by weight), the amount diverted grew only marginally. Ontario’s total waste diversion rate still hovers around 25%, far short of the province’s 60% target.<small>60</small>
<i>Several shortcomings and challenges with the WDA</i>
contributed to this stagnation: most wastes were never designated under the Act, economic barriers persisted, and structural problems limited effective-ness. We explore each of these issues in this Part.
FIGURE 3.1. Waste diversion by the numbers.
Source: Created by the ECO using data from Statistics
</div><span class="text_page_counter">Trang 33</span><div class="page_container" data-page="33">manufacturers often prefer lighter products and packaging, which can save them money, consume fewer raw materials and require less energy to transport. But these lighter, thinner, more complex plastics and other packaging materials also increase recycling costs (see Figure 3.2).<b>The evolvingtonne has been the main driver of growing costsin the Blue Box system.</b><small>61</small>For example, it used to take 35,000 plastic water bottles to recover 1 tonne
of plastic; now it takes almost 70,000 bottles. The reduced weight of wastes diverted through the Blue Box and electronics programs alters the reported diversion rates (i.e., the amount of diverted waste as a percentage of all waste), even if there has been no change in the proportion of recyclable materials on a per item basis.<small>63</small>Although we know it exists, the total impact of the evolving tonne on diversion numbers has yet to be reliably quantified.
FIGURE 3.3. How much of Ontario’s total waste stream does the Blue Box actually divert? In 2014, the Blue Box successfully diverted 65% of all residential paper and packaging waste; however, most of Ontario’s paper and packaging waste is produced by the industrial, commercial and institutional (IC&I) sector, which is not included in the Blue Box. Source: Created by the ECO, using data from Stewardship Ontario and
<i>MOECC’s 2013 Waste ReductionStrategy.</i><small>65</small>
3.1<b>Most of Ontario’sWastes Were Never</b>
3.1.1<b>Blue Box is Bigger in Our Heartsand Minds than in Reality</b>
Ontario’s long-running municipal Blue Box program, which provides residential curbside collection of printed paper (such as newspaper), cardboard, and most plastic, glass and aluminum packaging (such as jars, bottles, tins and containers) – generally referred to collectively as “paper and packaging” – is the province’s signature waste diversion program.
<b>The Ontario public is deeply attached to the BlueBox.</b>In a 2011 survey conducted by Stewardship Ontario, 75% of respondents reported that the Blue Box was their primary environmental effort.<small>64</small>Even more respondents (80%) stated that the Blue Box has changed the way their households operate. Whether or not packaging is Blue Box-friendly influences Ontarians’ decisions on which products to
buy, and is the key measure by which they assess a manufacturer's environmental commitment.
While Ontario’s Blue Box program is among the best in the world, its role in the hearts and minds of Ontarians is much larger than its actual environmental impact. Much as we love it,<b>the Blue Box collectsless than 8% of Ontario’s total waste stream</b>(see Figure 3.3), and some Blue Box materials cost an
<i>extraordinary amount to recycle (see The Evolving</i>
<i>Tonne box in Part 3.0).</i>
In addition, not everything collected in the Blue Box is diverted from landfill. For example, a tonne of clean newspaper typically yields between 80 to 86% recy-cled fibre.<small>66</small>Whereas a tonne of aseptic containers (e.g., juice boxes) often yields only 35% to 60% of a tonne of recovered paper fibre and much of the remaining material is ultimately landfilled.<small>67</small>
<i><b>under the WDA</b></i>
<small>Blue Box diverts 65%of this waste, but only</small>
</div><span class="text_page_counter">Trang 34</span><div class="page_container" data-page="34"><i><b>3.1.2 WDA Mandated Diversion for</b></i>
As described in Part 2.2.4, the government only
<i>mandated four recycling programs under the WDA:</i>
Blue Box, used tires, household hazardous wastes, and electronics.<b>The Ontario government has not</b>
<b>introduced any new diversion programs under the</b>
<i><b>WDA since 2009,</b></i>primarily due to the “eco-fees” debacle of 2010 (see box).
<i><b>3.1.2 WDA Mandated Diversion for Only a Handful of Materials</b></i>
The result is that<i><b>about 85% of Ontario’s waste was never designated under the WDA</b></i>(see Figure 3.4), and many high-priority materials (which are subject to diversion programs in other jurisdictions), have been left without mandated, producer-funded diversion programs. These high-priority materials include:
• Food waste
• Rechargeable batteries
• Fluorescent bulbs and tubes (although recently passed federal legislation may soon require a
• Furniture and bulky items
• Construction and demolition waste
<b>Eco-fee Debacle Halted Expansion of</b>
The household hazardous waste (MHSW) program began well with Phase 1 in July 2008.<small>68</small>However, the poorly planned expansion of the program to Phase 2 in July 2010 met with enormous backlash. At the same time as a confusing rollout of the harmonized sales tax (HST), some (but not all) retailers started charging consumers a visible “eco-fee” on the purchase of everyday hazardous items such as household cleaners, pharmaceuticals, fire extinguishers, rechargeable batteries and compact fluorescent light bulbs.<small>69</small>Even though similar fees were already in place for other items such as tires, the public responded with wide-spread outrage over this new fee that some called a “tax.”<small>70</small>(For more details, see the ECO’s July
<i>2010 Special Report: Getting it Right: Paying for</i>
<i>the Management of Household HazardousWastes.)</i>
The controversy led the government to immediately suspend the expansion of the producer-funded program.<small>71</small>Instead, the province (i.e., Ontario taxpayers) funded the separate collection and management of Phase 2 materials until September 2014.<small>72</small>As of October 2014, the costs for managing Phase 3 materials<small>73</small>, and several Phase 2 materials, reverted to municipalities if they chose to continue voluntarily collecting these wastes – which several municipalities did.
The government later re-introduced a producer-funded program for one category of the Phase 2
<i>hazardous wastes, but not under the WDA. Since</i>
2012, Ontario Regulation 298/12 under the
<i>Environmental Protection Act has required the</i>
producers of pharmaceuticals and sharps to collect and manage these products at no cost to consumers.
<b>Eco-fee Debacle Halted Expansion of Extended Producer Responsibility</b>
</div><span class="text_page_counter">Trang 35</span><div class="page_container" data-page="35"><b>3.1.3 Too Much Organic Material Going</b>
<b>to Landfill</b>
<b>Organics (such as food and yard waste) make upabout 30% of Ontario waste</b><small>76</small>and are a significant
<i>source of greenhouse gases (see Part 4.2.1, Focus</i>
<i>on Climate). Yard waste collection is mandatary for</i>
municipalities over 5,000 people,<small>77</small>but food waste collection is not. To conserve landfill space, some large municipalities voluntarily offer curbside collection of residential food waste, usually called “green bin” programs.
In 2015, about 40% of Ontario’s organic waste (representing 1.34 million tonnes, or 11% of the total waste stream) was diverted from landfill, i.e. processed in composting or anaerobic digestion facilities (see Figure 3.5).
Most smaller municipalities are reluctant to increase organic diversion because green bin programs are expensive and are funded entirely by municipalities. In addition, it is challenging to site and operate organics management facilities due to onerous MOECC requirements for odour control and community concerns about odour. Long wait times for MOECC approvals also discourage such facilities (although the ministry has committed to improve its approvals processing time).
Another challenge is<b>the lack of strong end markets</b>
for the compost, digestate and biochar that is produced through organic diversion programs. Although these products can be valuable sources of nutrients for farmers, home owners, municipalities and landscapers, increasing the amount of material produced will require an equivalent expansion in the market for such materials.<small>78</small>
FIGURE 3.4. Composition of waste stream in Ontario by material type, indicating the portion of material categories covered by programs mandated under
<i>the Waste Diversion Act, 2002, now repealed.</i>
Note: not all household hazardous wastes are covered
<i>under the WDA.</i>
Source: Created by the ECO, using data from
<i>MOECC’s 2013 Waste Reduction Strategy, and data</i>
from Stewardship Ontario with regard to paper and packaging.<small>75</small>
FIGURE 3.5. Diverted organic waste, as a percentage of all waste (2013).
Source: Data from the MOECC’s 2013 Waste Reduction Strategy and the WDO municipal datacall information
<b><small>IC&I: Paper & Packaging, 33%</small></b>
<b><small>Blue Box: Paper &Packaging, 12%</small></b>
<b><small>Personal Electronics, 1%</small></b>
<b><small>Household hazardous, 0.5%</small></b>
<b><small>Tires, 1%</small></b>
</div><span class="text_page_counter">Trang 36</span><div class="page_container" data-page="36"><b>3.1.4 Non-Residential Waste Has</b>
<b>Been All But Ignored</b>
The single biggest factor in Ontario’s poor waste diversion record is the lack of attention to non-residential waste. While Statistics Canada cites single-family residences in Ontario at relatively strong diversion rates (about 37%) (other data suggests it may be as high as 47%<small>79</small>), diversion rates in the industrial, commercial and institutional (IC&I) and construction, renovation and demolition (CRD) sectors are much lower (about 15%).<small>80</small>In total, over twice as much residential waste is recycled than non-residential waste, even though the IC&I and CRD sectors generate more waste (see Figure 3.6).
FIGURE 3.6. Total waste generated and diverted (million tonnes) for industrial, commercial & institutional (IC&I) and construction, renovation and demolition (CRD) sectors and for residential sector.
Source: Statistics Canada (data for 2014).
This disparity in diversion rates is largely because Ontario imposes few obligations on IC&I and CRD operations, and those that do exist for IC&I (under the “3Rs” regulations, see Part 2.1.3) are rarely enforced.<small>81</small>The IC&I sector includes a huge number of properties – everything from factories to retail malls to restaurants, universities, hospitals, and even many multi-residential buildings (such as condominium towers)<small>82</small>– so<b>weak requirements for IC&I have amassive impact on Ontario’s overall diversion rates.</b>
CRD sectors have never been included in any programs or funding from stewards to divert recy-clable paper and packaging from IC&I facilities or CRD sites, even though much of the paper and packaging wastes from these sectors is the same as the Blue Box wastes generated by households. Without funding or programs from stewards, and with minimal obligations to divert their own waste, IC&I and CRD businesses often choose the least costly option – in many cases shipping their waste to low-cost landfills in the United States.
<b>3.2 Economic Barriers</b>
Government intervention can influence economic
<i>signals to help drive waste diversion. The WDA,</i>
however, did not address the fundamental cost discrepancy in managing waste:<b>landfilling inOntario is generally cheaper than recycling, andout-of-province landfills are cheaper still</b>(see Figure 3.7).
Even though the recycling process often yields usable materials that can be sold, the market price garnered for materials rarely covers the costs of recycling. Except for aluminium cans, which are often picked out of Blue Boxes by individuals, the materials collected in diversion programs cannot be sold for as much as it costs to collect and process them. As shown in Figure 3.2 above, the cost-to-revenue ratio is especially high for complex light-weight materials, such as multi-layer aseptic cartons (often referred to by the tradename “Tetra Pak”).
The higher cost for recycling relative to landfilling discourages the voluntary establishment of new recycling programs, or the addition of non-mandated materials to an existing program. In some cases, waste generators voluntarily pay to recycle lower-value materials (such as construction waste). Fee-based voluntary recycling programs are better than no recycling program, but the expense typically limits participation.
<small>IC&I and CRD SectorsResidential Sector</small>
<small>Waste Not DivertedWaste Diverted</small>
</div><span class="text_page_counter">Trang 37</span><div class="page_container" data-page="37">In addition to cheap disposal, on the revenue side of the equation,<i><b>the WDA failed to create stable,</b></i>
<b>reliable and broad markets for recycled materials</b>. Such markets are key to sustainable, cost-effective waste diversion programs. The province has had minimal success in encouraging such markets, and both the province and producers have generally failed to use their procurement power to support them.
<b>3.2.1 Rising Blue Box Costs</b>
Economic issues affect multiple programs, but were particularly visible for the Blue Box. The WDO documented numerous problems with the Blue Box program, mostly driven by its unexpected, dramatic rise in costs.<small>83</small>
<i>When the WDA was adopted, stakeholders believed</i>
that the Blue Box program would become financially self-sustaining within 5 years (i.e., that the sale of collected materials would cover collection and recy-cling costs). This did not happen. Instead, both cost per tonne of collected materials and total Blue Box costs climbed rapidly (reaching hundreds of millions of dollars per year), far higher and faster than revenues from sale of materials (see Figure 3.8).
FIGURE 3.8. Ontario Blue Box gross costs and revenue, over time.
Source: Continuous Improvement Fund.
One key reason for the escalating costs was the expansion in difficult-to-recycle packaging materials
<i>(see The Evolving Tonne in Part 3.0). In addition,</i>
because of O. Reg. 101/94, almost every municipality ran its own Blue Box, whether it made economic sense to do so or not. Understandably, smaller and more remote communities had much higher costs, sometimes due in part to duplicated effort, and to smaller than optimal processing facilities (see Figure 3.9). Because different municipalities accepted different materials into their respective Blue Boxes, markets were fragmented and consumer confusion increased contaminant levels.
transportation and processing costs.
<i>Source: Created by ECO, based on data from the MOECC Discussion Paper: Addressing Food and Organic Waste in Ontario, (2015).</i>
<small>Verified Gross CostsVerified Revenue</small>
</div><span class="text_page_counter">Trang 38</span><div class="page_container" data-page="38">FIGURE 3.9. Costs of operating municipal Blue Box programs across Ontario.
Source: AMO, Municipalities’ Report to Waste Diversion Ontario on Blue Box Funding (2015).
The<b>rising costs were a near-constant source of strife,exacerbated by the unique funding arrangement ofthe Blue Box program</b>, which required municipalities to pay all program costs and then to seek partial reimbursement from stewards two years later. The
ties 50% of the total net cost of operating Ontario’s Blue Box program, and WDO devoted nearly six person-months every year verifying every cost that municipalities reported, which municipal governments had already certified as accurate. Even after this elaborate certification and verification process, stewards challenged municipal cost claims every year.
By 2013, the relationship between Blue Box stewards and municipalities broke down into an acrimonious arbitration over the amount that stewards owed to municipalities. Municipalities were ultimately awarded the $115 million they claimed for their 2012 costs.<small>84</small>
Municipalities also showed that between 2003 and 2014 they had paid $233 million more than a true 50% (which alone was more than $1 billion).<small>85</small>Even this amount understated the impact of Blue Box costs on municipal taxpayers.<small>86</small>
On its face, the Blue Box cost-sharing arrangement runs contrary to the principle of extended producer responsibility; instead of stewards bearing the full cost of waste from their products, the Blue Box put significant financial burden on municipal taxpayers. Ontario is the only province that allowed stewards to pay so small a share of the Blue Box costs for their products and packaging (see Table 3.1).<small>87</small>
Source: Kelleher Environmental and Love Environment Inc., Comparison of Ontario Blue Box Program Costs With Other TABLE 3.1. Provincial Comparison of Costs and Performance.
(2015 Projected (2015 Projected (2013 (2013 Performance) Performance) Performance) Performance)
access to printed paper and packaging recycling
Net Cost Per Capita Paid $27 (100%) $7.50 (75%) $15.20 (80%) $9.50 (50%) By Stewards/Producers
</div><span class="text_page_counter">Trang 39</span><div class="page_container" data-page="39"><b>3.3 Structural Problems</b>
<i>Other failings of the WDA contributed to Ontario’s</i>
low diversion rates.<i><b><small>c</small></b></i>
<b>3.3.1 EPR Only Partially Realized</b>
<i>The WDA never implemented true extended</i>
producer responsibility (EPR) – where producers are fully, financially and legally, liable for managing
<i>end-of-life materials. The WDA was only a partial</i>
step towards EPR. This half-measure placed an unfair cost on municipalities, while doing little to encourage more sustainable product and packaging design by industry.
<i>Under the WDA, stewards were not individually</i>
liable for meeting any performance outcomes. Instead, the IFOs – a regulated monopoly – operated most diversion programs, whose performance targets were both weak and unenforced. Stewards’ only obligation was to pay a stewardship fee to their IFO.<i><b>The WDA did not incent waste reduction or</b></i>
<b>better environmental design</b>.<small>88</small>For example, because all stewards of a particular product paid the same fee to their IFO regardless of their product’s cost to recycle, there was no financial incentive to improve the design of their product to increase reuse or recyclability (i.e., the fee paid for an easily recyclable television was the same as that paid for a very difficult to recycle television). The IFO structure also gave no financial incentive to stewards to use end-of-life materials in their products or packaging.
The IFO structure allowed stewards to pass on their recycling costs to consumers, rather than internalize these costs as envisioned in an EPR system. The individual stewards in the electronics, hazardous waste and tire programs were each charged a set “per item” or “per kilogram” fee by their IFO, which was easily passed on to customers. Tire stewards pay “tire stewardship fees” (e.g., currently $3.30 per
and diverting used tires, which is directly passed on to consumers via a levy paid on purchase. Stewards of electronic goods similarly pass on the full amount of their steward fees as “environmental handling fees” charged to consumers at the point of sale.
Further, stewards were only held liable for managing a portion of their designated wastes. IFOs were only required to pay for managing the wastes that were captured by the diversion program. This fact, combined with low diversion targets, created a disincentive to collect and divert more materials. The costs of dealing with wastes that should have gone into the program but instead ended up as litter, in sewage, or in municipal landfills were borne entirely by municipalities and their taxpayers. Additionally, for the Blue Box program, even for those materials that were properly collected and diverted, stewards only covered part of the program costs, with the rest covered by municipalities (see Part 3.2.1).
<b>3.3.2 Governance, Transparency &</b>
Inadequate governance, transparency and account-ability among the WDO, the IFOs, municipalities and the MOECC led to distrust among stakeholders and frustrated progress.<small>89</small>
<b>No one was clearly accountable for either policyor results</b>; blurred and overlapping responsibilities allowed each party to blame someone else. By giving most program oversight to the WDO, the government attempted to reduce its own role in, and duck responsibility for, waste diversion. This satisfied no one, and did not spare the government from either lobbying or criticism.<small>90</small>
<i><b><small>c</small></b>The problems in this section are specific to the now-repealed Waste Diversion Act, 2002, and we therefore discuss them in the</i>
past tense. However, in many cases, they will continue to affect program operation at least until all existing diversion programs
<i>are fully transitioned to the RRCEA.</i>
</div><span class="text_page_counter">Trang 40</span><div class="page_container" data-page="40">hindered in several ways. For example:
• <i>The WDA lacked clarity on the respective</i>
responsibilities of the WDO, the Minister and the IFOs. The resulting confusion often left WDO struggling.
• WDO had an inherent conflict of interest: how could it impartially oversee stewards’ IFOs and their program plans, when stewards were the only source of WDO’s funding, as well as of most of its staff and board? WDO always struggled with limited financial resources, and dependence on stewards for those resources.
• The lack of clear and enforceable performance targets for IFOs meant there was no definitive standard against which to measure the IFOs (and thus little incentive for IFOs to reduce waste and increase recyclables).
• Only the ministry could enforce the Act, and it rarely took any enforcement action.
• WDO had no direct access to data about stewards, making it difficult to take informed action.
• WDO had neither data from nor authority over the service providers (e.g., waste haulers) who handled most recyclable materials, further reducing WDO’s ability to oversee the entire waste sector.
effectiveness of WDO’s board. Initially, the board consisted of representatives of stakeholder groups, primarily stewards. The board was vulnerable to domination by the largest industry actors, making it difficult for those representing non-business interests to be heard. In 2012, the Minister changed the board to be skills-based, stating that a skills-based board better reflected “modern governance practices.”<small>91</small>
Similarly, in the case of IFOs, stewards with smaller market share stated that, while they had no choice about funding the organization, they were entirely excluded from decision making about how to spend the money. The process for setting and using stew-ard fees was highly complex and opaque to many stakeholders, and the underlying data was often kept secret. In addition, some stakeholders felt that the IFOs did not sufficiently consult with all affected stakeholders during development of new diversion program plans.
</div>