unit 5 accounting principles 5038
Bạn đang xem bản rút gọn của tài liệu. Xem và tải ngay bản đầy đủ của tài liệu tại đây (1.17 MB, 32 trang )
<span class="text_page_counter">Trang 1</span><div class="page_container" data-page="1">
<b> ASSIGNMENT 2 FRONT SHEET </b>
<b>Qualification BTEC Level 4 HND Diploma in Business </b><b>Unit number and title Unit 5: Accounting Principles (5038) </b>
<b>Submission date </b> 16/8/2022 <b>Date received (1<small>st</small> submission)</b> 16/8/2022
</div><span class="text_page_counter">Trang 3</span><div class="page_container" data-page="3">
<b>Summative Feedbacks: </b>
<b>Resubmission Feedbacks:</b><b>Internal Verifier’s Comments:</b>
</div><span class="text_page_counter">Trang 4</span><div class="page_container" data-page="4"><b>Signature & Date:</b>
</div><span class="text_page_counter">Trang 5</span><div class="page_container" data-page="5">Contents
<b>Task 1: Producing Financial Statements ... 4 </b>
<b>Task 2: Analysing and Interpreting Financial Statements ... 6 </b>
1. Brief about the company ... 6
2. Financial performance of the company ... 6
</div><span class="text_page_counter">Trang 7</span><div class="page_container" data-page="7"><b>Task 1: Producing Financial Statements </b>
15/12/2020, ABC owes its employees unpaid wages for the two weeks: 10 days @ $700 Employees wages for 1 day is 700. Therefore, 10 days is 7000.
On December 1 , 2020, ABC purchased equipment for $16,900, by cash. <small>st</small>
</div><span class="text_page_counter">Trang 9</span><div class="page_container" data-page="9">Depreciation Expense 275
<b>Income Statement: For the Month Ended December 31, 2020 </b>
<b>Balance Sheet (31/12/2020) </b>
<b>Training fees earned</b> $ 123,900.00
<b>Tuition fees earned</b> $ 43,400.00
<b>Operating Expenses</b>
<b>Depreciation expense, Professional library</b>
<b>Depreciation expense, Equipment</b> $ 275.00
</div><span class="text_page_counter">Trang 10</span><div class="page_container" data-page="10"><b>Capital </b>
<b>Total Liabilities and EquityEquity</b>
<b>150,125.00$ </b>
<b>150,125.00$ </b>
26,000.00$
7,000.00$
12,500.00$
104,625.00$
</div><span class="text_page_counter">Trang 11</span><div class="page_container" data-page="11"><b>Task 2: Analysing and Interpreting Financial Statements </b>
<b>1. Brief about the company </b>
Saigon - Hanoi Beer Joint Stock Company was established on July 6, 2007. As a member of Saigon Beer Alcohol Beverage Corporation. With a capacity of 90 million liters of beer per year, the company's products include: Saigon Beer cans 333, Saigon red beer 355, Bottled beer 333, Saigon draft beer.
With a team of highly qualified authorities and employees, modern equipment and machinery, and understanding of how to promote Vietnam's strong intellectual and creative resources, the country is well-positioned to swiftly grasp new technologies. During the business process, SABECO-HANOI always takes "Food quality and safety and food hygiene and safety create prestige and sustainable development" as the top standard to come to customers.
Saigon - Hanoi Beer Joint Stock Company thinks that its capacity and experience will enable it to satisfy all of Saigon Beer Alcohol Beverage Corporation's requirements, and it looks forward to working with customers, including you. together to contribute to the development of a modern Beer, Alcohol, and Beverage business, as well as the enrichment of the country.
Sector:
- Brewing beer, wine, and soft beverages, as well as selling them.
- Beer, wine, soft drinks, flavorings, and juices for beer and wine manufacturing import and export Sabeco's total assets by the end of December 2021 reached more than VND 30,487 billion, an increase of more than VND 3,112 billion compared to the beginning of the year. Accounting for the largest proportion in the asset structure is short-term financial investment with a total value of VND 16,991 billion. Inventories increased sharply, by the end of the period more than 1,668 billion VND, an increase of 15% compared to the same period in 2020.
<b>2. Financial performance of the company </b>
</div><span class="text_page_counter">Trang 12</span><div class="page_container" data-page="12"><b>INFORMATION OF SABECO'S DATA </b>
<b>Net sales revenue </b> 26,373,746,293,858 27,961,323,837,011 (1,587,577,543,153) -6%
<b>Assets at the beginning of the </b>
<b>Assets at the end of the period </b> 30,487,024,372,425 27,374,972,775,358 3,112,051,597,067 11%
</div><span class="text_page_counter">Trang 13</span><div class="page_container" data-page="13"><b>Average Assets </b> 28,930,998,573,891.50 27,168,724,434,701.50 1,762,274,139,190 6%
<b>Shareholders'equity at the </b>
<b>beginning of the period </b> 21,215,276,390,928 20,076,247,056,364 1,139,029,334,564 6%
<b>Shareholders'equity at the end </b>
<b>beginning of the period </b> 69,331,890,605 157,654,572,653 (88,322,682,048) -56%
<b>Accounts receivable from customers-short-term at the </b>
<b>end of the period </b> 100,965,921,832 69,331,890,605 31,634,031,227 46%
<b>Accounts receivable from customers-long-term at the </b>
<b>beginning of the period </b> 5,988,013,018 6,005,003,018 (16,990,000) 0%
<b>Accounts receivable from customers-long-term at the end </b>
<b>Net credit sales </b> 182,258,838,473 238,979,479,294 (56,720,640,821) -24%
<b>Accounts Receivable - term at the beginning of the </b>
<b>Accounts Receivable - </b>
<b>short-term at the end of the period </b> 467,956,130,071 590,846,416,109 (122,890,286,038) -21%
<b>Accounts Receivable - term at the beginning of the </b>
</div><span class="text_page_counter">Trang 14</span><div class="page_container" data-page="14"><b>long-period</b> 11 958 390 566 9 110 080 970 2 848 309 596 31%
<b>Accounts Receivable - </b>
<b>long-term at the end of the period </b> 12,640,850,386 11,958,390,566 682,459,820 6%
<b>Average account receivable </b> 541,700,893,566 590,261,632,781 (48,560,739,215) -8%
<b>Account payable at the </b>
<b>beginning of the period </b> 6,159,696,384,430 6,886,229,037,681 (726,532,653,251) -11%
<b>Account payable at the end of </b>
<b>the period </b> 7,892,238,669,264 6,159,696,384,430 1,732,542,284,834 28%
<b>Average account payable </b> 7,025,967,526,847.00 6,522,962,711,055.50 503,004,815,792 8%
<b>Net credit purchases </b> 17,097,179,748,156 18,013,396,057,629 (916,216,309,473) -5%
<b>Current assets </b>
22,877,033,322,264 19,513,381,452,440 3,363,651,869,824 17%
<b>Current liabilities </b> 7,258,020,535,153 5,173,043,219,872 2,084,977,315,281 40%
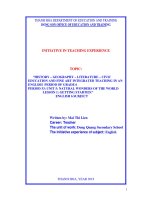
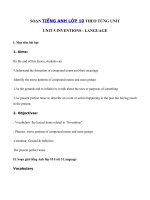
</div><span class="text_page_counter">Trang 15</span><div class="page_container" data-page="15"><b>Gross profit margin: This indicator shows how much gross profit the enterprise earns for each dollar of </b>
revenue generated, after deducting the cost of goods sold. Thus, Sabeco's Gross profit margin at the end of 2021 is 28.85% and at the end of 2020 is 30.40%. That means in 2021, with 100 dong of revenue generated, Sabeco will get 28.85 dong in gross profit and in 2020 it will get 30.40 dong in gross profit. Although Sabeco's 2021 decreased by 0.02 times compared to 2020 due to increased input material costs, the slower decrease in cost of goods caused the Gross profit margin to shrink to 28.85%, equivalent to a gross profit of VND 7,609 billion, down 10% compared to 2020 but overall, Sabeco's Gross Profit margin ensures competitiveness in the market and is still higher than other companies in the same industry.
<b>Net profit margin is the profit after tax that the company earns from each dollar of revenue and Operating </b>
profit shows how much operating profit the business earns, after deducting all costs for production activities. Profit after tax in 2021 is 14.90%, down 0.03 times compared to 2020 is 17.66% and Operating profit at the end of 2021 is 18.60%, down 0.03 times compared to 2020 is 22.09%. This was recorded as Sabeco's lowest
Gross Profit margin 28.85% 30.40% (0.02)Operating Profit 18.60% 22.09% (0.03)Net Profit margin 14.90% 17.66% (0.03)
<b>Profitatbility</b>
</div><span class="text_page_counter">Trang 16</span><div class="page_container" data-page="16">net profit margin and operating profit since 2015, mainly due to a lack of revenue from beer sales, as well as
<b>increased receivables. </b>
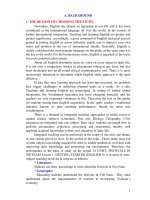
<b>4. Return ratios </b>
<b>Return on Assets (ROA) is an indicator of return on wealth/assets. In 2021, ROA is 13.58% down 0.05 times </b>
compared to 2020 is 18.17%. Based on ROA index, Sabeco knows exactly how much capital to invest as well
Return on Assets (ROA) 13.58% 18.17% (0.05)Return on Equity (ROE) 17.94% 23.91% (0.06)
Return Ratios
</div><span class="text_page_counter">Trang 17</span><div class="page_container" data-page="17">as how much net profit it brings. But the above indicator shows a decrease in ROA, which shows that Sabeco is using assets less efficiently than in the past.
<b>Return on Equity is the return on equity capital. In 2021, ROE reached 17.94%, down 0.06 compared to </b>
23.91% in 2020. This means that the company has lower earnings than in the past. The reason is that Average STOCKHOLDERS EQUITY 2021 increased by 1,139 billion VND but net profit decreased by 1,007 billion VND. It is necessary to consider whether the amount of capital that the enterprise has spent has taken full advantage of business opportunities in the market, to see if the ROE of this enterprise is likely to increase or decrease in the following years.
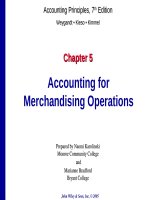
<b>5. Efficiency Ratios</b>
<b> </b>
<b>Assetes Turnover Ratio: It is 103% in 2020 and will decrease by 0.12 times in 2021. The reason for the low </b>
total asset turnover is that SABECO maintains a high balance of short-term financial investments, even with a large proportion of fixed assets. While this amount may help improve the liquidity of the company, SABECO should still consider cutting this investment as this is a way to determine that the rate of return on short-term investment can be good. than investing in capital expenditures.
With the <b>inventory turnover,</b> SABECO has a high turnover as a result of a better control in raw material, in bothpurchasing and maintaining process. Higher inventory turnover also means that SABECO will have increase <b>Day's Sales in Inventory</b>, from 27.14 days in 2020 to 32.44 days in 2021. So the increase in Day's Sales in Inventory will affect the quality of products, or the time when the whole market is fluctuating complicatedly
Inventory Turnover 1205% 1140% 0.65Accounts Receivable Turnover 34% 40% (0.07)Account Payable Turnover Ratio 32% 33% (0.02)Asssets Turnover Ratio 91% 103% (0.12)Day's Sales in Inventory 32.44 27.14 5.31
Efficiency Ratios
</div><span class="text_page_counter">Trang 18</span><div class="page_container" data-page="18"><b>Accounts receivable turnover: As for receivable, SABECO seems not to make a lot of credit sales. Looking </b>
atthe receivables turnover of this company, this is simply extraordinary. It can be impliedfrom these two latter ratio that while HABECO and SAIGON BEER have to rely oncredit sales policy to enlarge their market share, SABECO is maintaining a stablecustomer group. At the time being, it is undeniably a good sign. However, in thefuture, SABECO should have a more flexible policy on credit sales or else it may haveencounter a risk that its customers will choose other providers.
<b>Accounts payable turnover: The payable turnover of SABECO has decreased by 0,02 times in 2021, but it </b>
may not a problem if we combine thisratio with the liquidity ratio which will be mentioned in the next part. A reasonableexplanation for this decrease may be because the company has negotiated differentpayment
<b>arrangements with its suppliers </b>
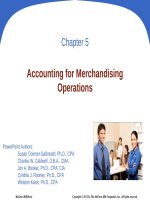
</div><span class="text_page_counter">Trang 19</span><div class="page_container" data-page="19"><b>6. Liquidity Ratios </b>
<b>Current Ratio: This ratio reflects the number of times short-term assets covershort-term liabilities and is a </b>
fairly accurate indication of a company's ability to serviceits current obligations. With the case of SABECO, we can see that the current ratio isbetter over the time as it has increased by 70% after 3 years but 2021 will be reduced due to covid 19 but not significantly by 0.62 times. In 2019, current assets ofSABECO can even cover its current liabilities 3 times, which means that in the short-term, SABECO will not have to encounter financial difficulty. The current ratio of SABECO, when comparing with its competitors, is muchbetter.
<b>Quick ratio: </b>Current ratio can reflect the company’s ability to service its currentobligations, however, it is not likely that the users can rely 100% on this ratio,especially when the company is holding a large quantities of inventories and there is arisk of slow moving. Quick ratio, also known as acid test ratio, will be a more reliablefigure in this case. This ratio, also known as the acid test ratio, measures
immediateliquidity - the number of times cash, accounts receivable, and marketable securitiescover short-term obligations.
With SABECO, when removing the effect of inventory, prepaid expenses, andother less liquid current assets, this company is way much farther from the safe point.The quick ratio of SABECO is respectively 338% and 286% in the period of 2 yearsfrom 2020 to 2021.
With SABECO, when removing the effects of inventory, prepaid expenses and other illiquid current assets, the company has come much further than the safe point. SABECO's quick ratio is 338% and 286 respectively for the 2-year period from 2020 to 2021. In 2021, the quick ratio has decreased by 0.52 times due to the increase in inventories due to the Covid-19 epidemic that will inflate everything in 2021. But this number still shows that Sabeco is doing well in the short term and surpassing it. outperform competitors in the same industry.
Current Ratio 315% 377% (0.62)Quick Ratio 286% 338% (0.52)
Liquidity Ratios
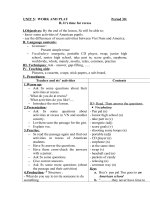
</div><span class="text_page_counter">Trang 20</span><div class="page_container" data-page="20"><b>7. Solvency Ratios </b>
<b>Solvency Ratios is the debt solvency ratio, this ratio measures and evaluates the ability of a business to pay its </b>
long-term debt or not. The solvency ratio in 2021 will reach 57%, down 0.33 times compared to 2020. The reason is due to the increase of 40% in liabilities.
Solvency Ratios 57% 90% (0.33)Interest Coverage Ratio 10065% 9698% 3.67 Debt to Equity 35% 29% 0.06 Debt to Capital 26% 23% 0.03
Solvency Ratios
</div><span class="text_page_counter">Trang 21</span><div class="page_container" data-page="21">We can reinforce this assumption when looking at the <b>interest coverage ratio</b> of SABECO. This ratio illustrates that in the case a company cannot make any profit in thefuture then how many times the company can pay it current interest expense throughit current EBIT. As for SABECO, it is 10065% and 9698% in 2020 and 2021, which is a fantastic sign when examining the solvency ratio of this company.
<b>On examining the solvency ratio, we also use some other key ratios which are Debt to Capital and Debt to </b>
<b>Equity. All three ratios indicate theproportion of debt and the corresponding balance. The higher these ratios </b>
are, theweaker solvency of the company is. However, it is not the case of SABECO when the company also maintain an amountbelow 0., this shows that the total debt of the business is less than equity and equity, which is preferred by every investor. Specifically, Debt to Equity in 2021 is 35%, increasing 0.06 times compared to 2020 is 29%, Debt to Capital in 2021 is 26%, increasing 0.03 times compared to 2020 is 23%.
<b>8. Market prospect ratios </b>
<b>Earning per share: is the profit after tax per common share of shareholders, after deducting preferred </b>
dividends. EPS is used by analysts as an indicator of a company's profitability. A share par value is 10,000 dong, so a business is considered to be doing well when it has an EPS of > 1500 dong and maintains it for many years, with an upward trend. At least, EPS must be > 1000 VND. EPS = 5,502 > 1,500 VND, and many sustainable years => Sabeco is a good company even though it decreased by 1,643 times compared to 2020.
<b>Price-to-Earning Ratio: is a measure of a market institution's value relative to earnings when calculated </b>
down to a unit of assets. The Price to Earning Ratio remains unchanged in 2020 and 2021. Sabeco's P/E remains high, >15 as Sabeco is one of the leading players in the industry, high P/E shows investor
expectations from which the stock will be higher in the future. Therefore, it can be assured that investors will continue to invest heavily in Sabeco in the near future.
Earning per share 5,502 7,145 (1,643.00)Price-to-Earnings Ratio 0.03 0.03 0.00
Market Prospect Ratios
</div><span class="text_page_counter">Trang 22</span><div class="page_container" data-page="22"><b>9. Conclusion </b>
In conclusion, SABECO is showing a positive result and setting out a promisingfuture for the investors. It has confirmed the position of a leading company in thisindustry with an exceptional financial performance. The capital structure of thecompany is far higher than the safe point with high liquidity, sufficient ability to paythe debt and a well-structured source of capital.
2020 is also a milestonefor SABECO when the divestment of the state capital will be 100% completed, morepeople will want to invest on the company and a bright prospect is opening. However,the appearance of newcomers, the issuance of Decree 100 and the emergence of COVID 19 pandemic are some threats that can hold SABECO back. If the company canovercome all these obstacles, SABECO will be not only a leader in Vietnam but also achallenger in the foreign market.
</div>