TRANSPARENT GLASSES AND GLASS-CERAMICS IN THE TERNARY SYSTEM TEO2-NB2O5-PBF2
Bạn đang xem bản rút gọn của tài liệu. Xem và tải ngay bản đầy đủ của tài liệu tại đây (2.02 MB, 16 trang )
<span class="text_page_counter">Trang 1</span><div class="page_container" data-page="1">
<b>HAL Id: hal-03134515</b>
Submitted on 8 Feb 2021
<b>HAL is a multi-disciplinary open access</b>
archive for the deposit and dissemination of entific research documents, whether they are pub-lished or not. The documents may come fromteaching and research institutions in France orabroad, or from public or private research centers.
<b>sci-L’archive ouverte pluridisciplinaire HAL, est</b>
destinée au dépôt et à la diffusion de documentsscientifiques de niveau recherche, publiés ou non,émanant des établissements d’enseignement et derecherche franỗais ou ộtrangers, des laboratoirespublics ou privộs.
<b>Transparent glasses and glass-ceramics in the ternarysystem TeO2-Nb2O5-PbF2</b>
Juliana Santos Barbosa, Gislene Batista, Sylvain Danto, Evelyne Fargin,Thierry Cardinal, Gael Poirier, Fabia Castro Cassanjes
<b>To cite this version:</b>
Juliana Santos Barbosa, Gislene Batista, Sylvain Danto, Evelyne Fargin, Thierry Cardinal, et al..Transparent glasses and glass-ceramics in the ternary system TeO2-Nb2O5-PbF2. Materials, 2021, 14(2), 317 (15 p.). �10.3390/ma14020317�. �hal-03134515�
</div><span class="text_page_counter">Trang 2</span><div class="page_container" data-page="2"><small>Glass-Ceramics in the Ternary SystemTeO2-Nb2O5-PbF2</small><b><small>. Materials 2021, 14,</small></b>
<small>317. 16 November 2020Accepted: 4 January 2021Published: 9 January 2021</small>
<b><small>Publisher’s Note:</small></b> <small>MDPI stays tral with regard to jurisdictional clai-ms in published maps and institutio-nal affiliations.</small>
<b><small>neu-Copyright:</small></b><small>© 2021 by the authors. censee MDPI, Basel, Switzerland.This article is an open access articledistributed under the terms and con-ditions of the Creative Commons At-tribution (CC BY) license ( of Science and Technology, Federal University of Alfenas, Campus Poỗos de Caldas,MG CEP, Poỗos de Caldas 37715-400, Brazil; (J.S.B.); (G.B.); (F.C.C.)</small>
<small>2Institut de Chimie de la Matière Condensée de Bordeaux—ICMCB, Université de Bordeaux, 87 Avenue du Dr.Schweitzer, F-33608 Pessac, France; (S.D.); (E.F.); (T.C.)</small>
<b><small>*</small></b> <small>Correspondence: </small>
<b>Abstract:</b>Transparent fluorotellurite glasses were prepared by melt-quenching in the ternary system
up to 35 mol% in the tellurite matrix without loss of glass forming ability. Such glass compositionsexhibit a wide optical window from 380 nm to about 6 µm. Crystallization properties were carefully
doping of these glass compositions also promotes a more efficient nucleation step under suitable
These new fluorotellurite glass compositions are promising as luminescent hosts working in themiddle infrared.
<b>Keywords:</b>glass; glass-ceramic; fluoride; tellurite; crystallization; europium
<b>1. Introduction</b>
Oxyfluoride glasses are well-known in glass science for their famous combined erties, taking advantage of both oxide and fluoride compounds as in composite materi-als [1–5]. The final goal of oxyfluoride glasses is usually related to optical applicationssince fluoride compounds bring higher optical performances in key areas such as lumi-nescence quantum efficiencies or very low optical attenuations [6], whereas oxide glassymaterials are cheaper, easier to prepare, and more thermally and chemically stable for largepieces production or fiber drawing design [7–13]. Such optical properties can be furtherimproved when heavy metal fluoride nanocrystals are grown in the oxyfluoride glassby suitable heat-treatments. In fact, the fluoride crystalline material governs the opticalresponse whereas the oxide glassy matrix ensures the mechanical and thermal propertiesof the whole material [14–19]. Spatially-controlled precipitation of crystalline fluoridescan also induce a local refractive index variation in the so-called photothermorefractiveglasses with important associated applications such as diffraction gratings or holographicrecording [20–24].
prop-However, some important intrinsic optical characteristics of oxyfluoride glasses andglass-ceramics are also limited by the oxide glass former and cannot be overcome by simplyadding fluoride compounds. In particular, extended optical transparency in the middle
</div><span class="text_page_counter">Trang 3</span><div class="page_container" data-page="3"><b><small>Materials 2021, 14, 317</small></b> <small>2 of 15</small>
infrared, which is a key parameter for optical devices working above 3 µm, is related toharmonics of the fundamental molecular motions and is usually governed by the highfrequency modes of the oxide molecular units [25]. In this case, well-known fluorosilicate,fluoroborate, and fluorophosphate glasses and glass-ceramics do not meet these technicalrequirements and other oxide formers with lower fundamental frequency motions, i.e.,with heavier cations, must be considered. Among the known oxide glass formers, telluriumoxide TeO2is the best candidate for such purposes with the wider optical window up to6 µm [26]. Moreover, the higher atomic number of tellurium promotes other interestingoptical characteristics in tellurite glasses such as lower phonon energies and higher polariz-abilities, explaining why these glasses display strong interest as rare earth hosts [26–32]and third order non-linear optical materials [26,33–37].
However, despite the promising potentialities of transparent fluorotellurite glassesand glass-ceramics, such materials were less investigated when compared with fluorosili-cates, fluorophosphates, and fluorogermanates since large incorporations of heavy metalfluoride compounds usually induce glass devitrification. Another critical drawback oftellurite glasses for transparent glass-ceramics production is related to their dominantsurface-induced crystallization. Most reported works on this subject are devoted to highalkaline [38,39] and zinc fluoride [40–45] contents in transparent tellurite glasses without aloss of the glass forming ability. Only a few works reported on transparent tellurite glasseswith high heavy metal fluoride contents such as BaF2and PbF2up to 30 mol% [46–50].A single report describes tellurite glasses with up to 50 mol% of PbF<sub>2</sub>, even if the glassy stateof the resulting samples obtained by melt-quenching is not demonstrated [51]. Fluorotellu-rite glass-ceramics containing calcium and barium fluoride crystalline nanocrystals werealso reported but with a final translucent aspect associated to crystallites scattering [52–55].
Based on these considerations, this work intended to investigate glass formation aswell as structural, optical, and crystallization properties in the ternary system TeO2-Nb2O5-PbF<sub>2</sub>where niobium oxide acts as an intermediate compound used to increase the glassthermal stability for lead fluoride addition. Loss of starting compounds by evaporationor decomposition were investigated and synthesis parameters optimized. The effect ofeuropium doping on the crystallization mechanisms of fluorine-based crystalline phaseswas investigated for functional transparent oxyfluoride glass-ceramics. Eu<sup>3+</sup>spectroscopywas also used as a structural probe for a better understanding of the structural changesversus composition and crystallization state.
<b>2. Materials and Methods</b>
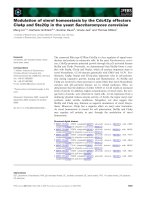
Glass formation was investigated in the ternary system TeO<sub>2</sub>-Nb<sub>2</sub>O<sub>5</sub>-PbF<sub>2</sub>. For thispreliminary investigation, starting compounds TeO2(Sigma-Aldrich, Darmstadt, Germany,99+%), Nb2O5(Sigma-Aldrich, Darmstadt, Germany 99.9%) and PbF2(Sigma-Aldrich,Darmstadt, Germany, 99.9%) were ground in an agate mortar, melted in a gold crucible at890<sup>◦</sup>C for 10 min and quenched in a cold stainless-steel mold. In this first step, the identifi-cation of the final material as glass, glass-ceramic, or ceramic was determined by the visualaspect and transparency of the sample as depicted in Figure1. Glass compositions identi-fied in our ternary system and labeled as xNbyPb where x and y represent the Nb2O5andPbF2contents (mol%) respectively along with their characteristic temperatures (Tg: glasstransition temperature, Tx: temperature at the onset of crystallization, Tc: temperatureat the peak of crystallization) are resumed in Table1. Glasses in the series (100-y)TeO2-10Nb<sub>2</sub>O<sub>5</sub>-yPbF<sub>2</sub>(0≤y≤30) were selected for further investigations. For preparing largerglass pieces with good optical quality and mechanical properties, a detailed study of massloss of the starting compounds during heating was performed to define suitable synthesisparameters (melting temperature and time): a starting powder mixture of composition65TeO2-10Nb2O5-25PbF2was analyzed using a FTIR-coupled thermogravimetric balance.These TG-FTIR measurements were performed with a TG Setsys “Evo” apparatus (SetaramInstrumentation, Caluire-et-Cuire, France) coupled on-line to a FTIR Thermo Nicolet 380spectrometer equipped with corrosive gas version (ThermoFisherScientific, Waltham, MA,
</div><span class="text_page_counter">Trang 4</span><div class="page_container" data-page="4"><b><small>Materials 2021, 14, 317</small></b> <small>3 of 15</small>
USA). In all experiments, the carrier gas was Nitrogen (Air Liquide—Alphagaz 2, with apurity of: O<sub>2</sub>< 100 ppb, H<sub>2</sub>O < 500 ppb and total hydrocarbon (CxHy) < 100 ppb) at a flowof 50 mL/min<sup>−1</sup>.
Thermo Nicolet 380 spectrometer equipped with corrosive gas version entific, Waltham, MA, USA). In all experiments, the carrier gas was Nitrogen (Air Liquide—Alphagaz 2, with a purity of: O<small>2</small> < 100 ppb, H<small>2</small>O < 500 ppb and total hydrocarbon (CxHy) < 100 ppb) at a flow of 50 mL/min<small>−1</small>.
<b>(ThermoFisherSci-Figure 1. Glass-forming domain in the ternary system TeO</b><small>2</small>-Nb<small>2</small>O<small>5</small>-PbF<small>2</small>.
<b>Table 1. Samples label, molar composition and characteristic temperatures. </b>
<b>Characteristic Temperatures (°C) </b>
<b>Figure 1.</b>Glass-forming domain in the ternary system TeO<sub>2</sub>-Nb<sub>2</sub>O<sub>5</sub>-PbF<sub>2</sub>.
<b>Table 1.</b>Samples label, molar composition and characteristic temperatures.
</div><span class="text_page_counter">Trang 5</span><div class="page_container" data-page="5"><b><small>Materials 2021, 14, 317</small></b> <small>4 of 15</small>
with a PFA (PerFluoroAlkoxy) capillary. Both gas sample cell and gas transfer line weremaintained at a constant temperature of 443 K to avoid cold surfaces and thus to preventthe condensation of evolved gases. FTIR spectra were collected with a resolution of2 cm<sup>−1</sup>, 32 scans being collected per spectrum. Based on these thermogravimetric resultsand related released species (described in the results and discussion section), meltingtemperatures and times were optimized to the lower values resulting in a homogeneousmelt before casting. According to these considerations, starting powders were ground inan agate mortar for 15 min and melted in a covered gold crucible for specific melting timesand temperatures as follows: 890<sup>◦</sup>C during 10 min for 10Nb0Pb, 890<sup>◦</sup>C during 5 min for10Nb10Pb, 870<sup>◦</sup>C during 5 min for 10Nb20Pb and 850<sup>◦</sup>C during 5 min for 10Nb30Pb.Then, the homogeneous melt was quenched in a stainless-steel mold preheated at 40<sup>◦</sup>Cbelow the glass transition temperature and annealed at this temperature for 4 h beforeslow cooling to room temperature. Eu<small>3+</small>-doped compositions were obtained followingthe same methodology (Eu<sub>2</sub>O<sub>3</sub>from Sigma-Aldrich, São Paulo, Brazil, 99.99%) using lowdoping contents of 0.1% in order to avoid energy transfer processes between Eu<sup>3+</sup>ions.The glasses were cut and polished in both sides using polishing sandpaper until a 1mm-thick glass sample is obtained. Glass-ceramics of selected compositions were preparedby heat-treatment of the pristine glasses at the onset of crystallization (Tx) for 1 h andlabeled as xNbyPb-TT for undoped samples and xNbyPb-Eu-TT for Eu<small>3+</small>-doped samples.DSC (Differential Scanning Calorimetry) measurements were performed on bulk samplesusing a DSC Maia F200 calorimeter (Netzsch-Gerätebau GmbH, Selb, Germany) between200<sup>◦</sup>C and 450<sup>◦</sup>C, since higher temperatures promote mass losses, using a heating rate of10<sup>◦</sup>C/min in sealed aluminum pans under N2flowing atmosphere. The crystallizationstudy was performed by DSC analysis on powder samples with controlled grain sizes. Theglass compositions were ground in an agate mortar and the final powder separated usingnylon sieves with mesh 63 µm, 53 µm, 45 µm, 38 µm, and 20 µm. Powders with grainsizes above 63 µm and below 20 µm were not analyzed. Raman spectra were collected inbackscattering mode on polished undoped glasses between 200 cm<sup>−1</sup>and 1000 cm<sup>−1</sup>witha LabRam Micro-Raman (Horiba Jobin-Yvon, Kyoto, Japan) working with a He-Ne laser at632.8 nm.
X-ray diffraction measurements were performed on powder samples using a Rigakuultima IV diffractometer (Rigaku Corporation, Tokyo, Japan) working at 40 KV and 30 mAbetween 10<sup>◦</sup>and 80<sup>◦</sup>in continuous step mode of 0.02<sup>◦</sup>/s. The crystalline phases were iden-tified according to X-ray powder diffraction patterns (PDF file). UV-visible transmissionand attenuation spectra were recorded between 350 nm and 2500 nm at 0.5 nm/s using aCary 7000 spectrophotometer (Agilent Technologies, Santa Clara, CA, USA). Transmissioninfrared spectra were collected between 650 cm<sup>−1</sup>and 4000 cm<sup>−1</sup>using a spectrometerCary 630 (Agilent technologies). Finally, the emission spectra of Eu<sup>3+</sup>-doped samples wererecorded in a spectrofluorimeter model Fluorolog FL3-221 (Horiba Jobin Yvon, Kyoto,Japan), equipped with CW xenon flash lamp and a photodiode detector (HORIBA PPD-850). The excited state lifetime values of Eu<sup>3+</sup>(<sup>5</sup>D0state) were determined by exponentiallyfitting the PL decay curves obtained from excitation with a pulsed flash lamp.
<b>3. Results and Discussion</b>
The glass forming ability in the ternary system TeO<sub>2</sub>-Nb<sub>2</sub>O<sub>5</sub>-PbF<sub>2</sub> is depicted inFigure1. As expected, in a preliminary analysis of the glass-forming domain, it appearsthat Nb2O5behaves as an intermediary compound since it stabilizes higher lead fluoridecontents when compared to the binary system TeO2-PbF2. In fact, 10 and 15 mol% of Nb2O5allows incorporating 35 and 30% of PbF2respectively. On the other hand, high niobiumoxide contents increase the melting point and viscosity of the final batch and should requirehigher melting times and temperatures. For this reason, glass-forming ability was notinvestigated beyond 15 mol% Nb<sub>2</sub>O<sub>5</sub>since the starting compounds do not melt properlyunder our synthesis conditions. In this sense, the series (100−y)TeO2-10Nb2O5-yPbF2seems to be the most promising for further investigations. One should note that such high
</div><span class="text_page_counter">Trang 6</span><div class="page_container" data-page="6"><b><small>Materials 2021, 14, 317</small></b> <small>5 of 15</small>
PbF<sub>2</sub>contents in tellurite glasses are barely reported and these reports do not give details ofthe synthesis conditions, final glassy state and fluoride losses [50,51]. DSC measurementswere performed on all glass compositions as presented in Figure2with characteristictemperatures resumed in Table1.
measurements were performed on all glass compositions as presented in Figure 2 with characteristic temperatures resumed in Table 1.
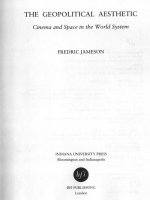
<b>Figure 2. DSC curves of glasses in the glass series (a) 5NbyPb, (b) 10NbyPb and (c) 15NbyPb. </b>
These thermal results highlight the opposite intermediary and modifier behaviors of Nb<small>2</small>O<small>5</small> and PbF<small>2</small> on the tellurite glass network since niobium insertion progressively in-creases the glass transition temperature along the three series whereas higher PbF<small>2</small> con-tents clearly promote a Tg decrease and lower glass thermal stability against devitrifica-tion within each series. Such behavior can be understood by insertion of NbO<small>6</small> units inside the tellurite network built from TeO<small>4</small> and TeO<small>3</small>, resulting in cross-linking between the tel-lurite chains and higher overall connectivity. On the other hand, fluorine addition should promote the formation of terminal Te-F and Nb-F bonds i.e., a less-connected glass struc-ture. Besides these considerations, an intense sharp crystallization event is detected in se-ries 5NbyPb and 10NbyPb at low temperatures for high PbF<small>2</small> contents whereas another weak and broad crystallization peak occurs at higher temperatures. Since such an event is related to the lead fluoride content, one can suggest that this crystalline phase contains fluorine and, in a first attempt, is attributed to a fluoride or oxyfluoride compound. In the series 15NbyPb, no crystallization is detected up to 450 °C, in agreement with the stabiliz-ing behavior of niobium, while investigations at higher temperatures were not performed as the mass loss was detected beyond 450 °C. Since this work is devoted to the study of niobium-tellurite glasses with high PbF<small>2</small> contents as well as the precipitation of fluorine-based crystalline phases for technological glass-ceramics, the series 10NbyPb was selected for further thermal, structural and optical investigations.
Owing to the well-known sublimation and evaporation tendencies of tellurium oxide TeO<small>2</small> and lead fluoride PbF<small>2</small> under heating, this work first focused on the understanding of chemical losses during melting of the starting powders in the ternary system TeO<small>2</small>-Nb<small>2</small>O<small>5</small>-PbF<small>2</small>. FTIR coupled-thermogravimetric analyzes were performed on a powder mixture of composition 65TeO<small>2</small>-10Nb<small>2</small>O<small>5</small>-25PbF<small>2</small> in an open crucible from room tempera-ture to 850 °C as a first attempt to understand the origin of mass losses during heating and melting, as depicted in Figure 3a. Upon a heating rate of 10 °C/min from room tempera-ture, one could note that mass loss of the starting powders begins around 400 °C and reaches about 10% at 850 °C with a continuous and linear mass loss at such isotherm.
<b>Figure 2.DSC curves of glasses in the glass series (a) 5NbyPb, (b) 10NbyPb and (c) 15NbyPb.</b>
These thermal results highlight the opposite intermediary and modifier behaviorsof Nb2O5and PbF2on the tellurite glass network since niobium insertion progressivelyincreases the glass transition temperature along the three series whereas higher PbF2con-tents clearly promote a Tg decrease and lower glass thermal stability against devitrificationwithin each series. Such behavior can be understood by insertion of NbO6units insidethe tellurite network built from TeO<sub>4</sub>and TeO<sub>3</sub>, resulting in cross-linking between thetellurite chains and higher overall connectivity. On the other hand, fluorine additionshould promote the formation of terminal Te-F and Nb-F bonds i.e., a less-connected glassstructure. Besides these considerations, an intense sharp crystallization event is detected inseries 5NbyPb and 10NbyPb at low temperatures for high PbF2contents whereas anotherweak and broad crystallization peak occurs at higher temperatures. Since such an eventis related to the lead fluoride content, one can suggest that this crystalline phase containsfluorine and, in a first attempt, is attributed to a fluoride or oxyfluoride compound. Inthe series 15NbyPb, no crystallization is detected up to 450<sup>◦</sup>C, in agreement with thestabilizing behavior of niobium, while investigations at higher temperatures were notperformed as the mass loss was detected beyond 450<sup>◦</sup>C. Since this work is devoted to thestudy of niobium-tellurite glasses with high PbF<sub>2</sub>contents as well as the precipitation offluorine-based crystalline phases for technological glass-ceramics, the series 10NbyPb wasselected for further thermal, structural and optical investigations.
Owing to the well-known sublimation and evaporation tendencies of tellurium oxideTeO2and lead fluoride PbF2under heating, this work first focused on the understanding ofchemical losses during melting of the starting powders in the ternary system TeO2-Nb2O5-PbF<sub>2</sub>. FTIR coupled-thermogravimetric analyzes were performed on a powder mixtureof composition 65TeO<sub>2</sub>-10Nb<sub>2</sub>O<sub>5</sub>-25PbF<sub>2</sub>in an open crucible from room temperature to850<sup>◦</sup>C as a first attempt to understand the origin of mass losses during heating and melting,as depicted in Figure3a. Upon a heating rate of 10<sup>◦</sup>C/min from room temperature, onecould note that mass loss of the starting powders begins around 400<sup>◦</sup>C and reaches about10% at 850<sup>◦</sup>C with a continuous and linear mass loss at such isotherm.
</div><span class="text_page_counter">Trang 7</span><div class="page_container" data-page="7"><b><small>Materials 2021, 14, 317</small></b><i><b><sup>Materials 2021, 14, x FOR PEER REVIEW </sup></b></i> <small>6 of 15</small><sup>6 of 15 </sup>
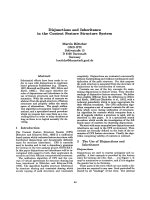
<b>Figure 3. (a) Thermogravimetry of a starting powder mixture of composition 65TeO</b><small>2</small>-10Nb<small>2</small>O<small>5</small>-25PbF<small>2</small>, correlated
measurement (grey arrow).
Coupled FTIR measurements of the evolved gases during thermogravimetry tected increasing amounts of released hydrogen fluoride HF from 400 °C to the end of the measurement, identified by a clear FTIR signature around 4000 cm<small>−1</small> as highlighted in Fig-ure 3b. Another FTIR signal centered at 1028 cm<small>−1</small> appears at the beginning of mass loss between 350 °C and 650 °C but could not be attributed with specific reported molecular vibrations related to our starting compounds. However, a report on the reaction of molten Nb<small>2</small>O<small>5</small> with gaseous F<small>2</small> identified several gaseous niobium oxyfluoride of general formula NbOxFy, which are precisely released between 350 °C and 550 °C. In this sense, one can suggest that fluoride ions from lead fluoride react with niobium oxide in this temperature range. Such complex niobium oxyfluoride species could be at the origin of our IR signal at 1028 cm<small>−1</small> [56].
de-These results highlighted a significative mass loss of fluorine upon heating, justifying our choice to use the lowest melting temperatures and times able to produce a homoge-neous melt for each composition as detailed in the experimental section. Keeping in mind that all compositions containing PbF<small>2</small> in the 10NbyPb series were melted for 5 min be-tween 850 °C and 890 °C, thermogravimetric data of the isotherm allowed to estimate a mass loss around 1.2% for a 5 min heating step at 850 °C. Thus, for a starting powder mixture of composition 65TeO<small>2</small>-10Nb<small>2</small>O<small>5</small>-25PbF<small>2</small> and considering that all fluorine is lost as HF produced by reaction between H<small>2</small>O or hydroxyls and PbF<small>2</small>, a 1.2% mass loss of the starting mixture gives a final molar composition 65TeO<small>2</small>-10Nb<small>2</small>O<small>5</small>-20PbF<small>2</small>-5PbO.
Raman spectroscopy performed on the polished undoped glasses (Figure 4) in the series 10NbyPb also supported our previous structural hypothesis depicted from thermal data. For Raman measurements, additional glass compositions were prepared in the ter-nary system TeO<small>2</small>-Nb<small>2</small>O<small>5</small>-PbF<small>2</small>. Sample 3Nb0Pb of composition 97TeO<small>2</small>-3Nb<small>2</small>O<small>5</small> presents the lowest niobium oxide content required for glass formation and represents a glass com-position close to pure TeO<small>2</small> which cannot be vitrified alone under classical quenching con-ditions. The other intermediary compositions 10Nb5Pb, 10Nb15Pb, and 10Nb25Pb were prepared for a better visualization and understanding of the Raman spectral changes. The spectrum of 3Nb0Pb is dominated by three broad signals centered at 450 cm<small>−1</small>, 660 cm<small>−1</small>and 740 cm<small>−1</small>. These tellurite bands are well-known and largely described in the literature as being due to bending modes of Te-O-Te bridges, stretching modes of seesaw TeO<small>4</small> units and stretching modes of pyramidal TeO<small>3</small> units respectively [57–59]. In other words, the glass network of a “pure” TeO<small>2</small> glass is built from 3D chains of interconnected TeO<small>4</small> and TeO<small>3</small>. By adding 10 mol% of Nb<small>2</small>O<small>5</small> (sample 10Nb0Pb), the Raman spectrum is very similar but with a shift of the band at 660 cm<small>−1</small> to higher frequencies, mainly attributed to a richer
<b>Figure 3.(a) Thermogravimetry of a starting powder mixture of composition 65TeO</b><sub>2</sub>-10Nb<sub>2</sub>O<sub>5</sub>-25PbF<sub>2</sub>, correlated
measurement (grey arrow).
Coupled FTIR measurements of the evolved gases during thermogravimetry detectedincreasing amounts of released hydrogen fluoride HF from 400 <sup>◦</sup>C to the end of themeasurement, identified by a clear FTIR signature around 4000 cm<sup>−1</sup>as highlighted inFigure3b. Another FTIR signal centered at 1028 cm<sup>−1</sup>appears at the beginning of mass lossbetween 350<sup>◦</sup>C and 650<sup>◦</sup>C but could not be attributed with specific reported molecularvibrations related to our starting compounds. However, a report on the reaction of moltenNb<sub>2</sub>O<sub>5</sub>with gaseous F<sub>2</sub>identified several gaseous niobium oxyfluoride of general formulaNbOxFy, which are precisely released between 350<sup>◦</sup>C and 550<sup>◦</sup>C. In this sense, one cansuggest that fluoride ions from lead fluoride react with niobium oxide in this temperaturerange. Such complex niobium oxyfluoride species could be at the origin of our IR signal at1028 cm<sup>−1</sup>[56].
These results highlighted a significative mass loss of fluorine upon heating, justifyingour choice to use the lowest melting temperatures and times able to produce a homoge-neous melt for each composition as detailed in the experimental section. Keeping in mindthat all compositions containing PbF2in the 10NbyPb series were melted for 5 min between850<sup>◦</sup>C and 890<sup>◦</sup>C, thermogravimetric data of the isotherm allowed to estimate a massloss around 1.2% for a 5 min heating step at 850<sup>◦</sup>C. Thus, for a starting powder mixtureof composition 65TeO<sub>2</sub>-10Nb<sub>2</sub>O<sub>5</sub>-25PbF<sub>2</sub>and considering that all fluorine is lost as HFproduced by reaction between H2O or hydroxyls and PbF2, a 1.2% mass loss of the startingmixture gives a final molar composition 65TeO2-10Nb2O5-20PbF2-5PbO.
Raman spectroscopy performed on the polished undoped glasses (Figure4) in theseries 10NbyPb also supported our previous structural hypothesis depicted from thermaldata. For Raman measurements, additional glass compositions were prepared in the ternarysystem TeO<sub>2</sub>-Nb<sub>2</sub>O<sub>5</sub>-PbF<sub>2</sub>. Sample 3Nb0Pb of composition 97TeO<sub>2</sub>-3Nb<sub>2</sub>O<sub>5</sub>presents thelowest niobium oxide content required for glass formation and represents a glass composi-tion close to pure TeO2which cannot be vitrified alone under classical quenching conditions.The other intermediary compositions 10Nb5Pb, 10Nb15Pb, and 10Nb25Pb were preparedfor a better visualization and understanding of the Raman spectral changes. The spec-trum of 3Nb0Pb is dominated by three broad signals centered at 450 cm<sup>−1</sup>, 660 cm<sup>−1</sup>and740 cm<sup>−1</sup>. These tellurite bands are well-known and largely described in the literature asbeing due to bending modes of Te-O-Te bridges, stretching modes of seesaw TeO4unitsand stretching modes of pyramidal TeO3units respectively [57–59]. In other words, theglass network of a “pure” TeO2glass is built from 3D chains of interconnected TeO4andTeO3. By adding 10 mol% of Nb2O5(sample 10Nb0Pb), the Raman spectrum is very similarbut with a shift of the band at 660 cm<sup>−1</sup>to higher frequencies, mainly attributed to a richerniobium environment around TeO<sub>4</sub>units. Under lead fluoride incorporation from 5 to
</div><span class="text_page_counter">Trang 8</span><div class="page_container" data-page="8"><b><small>Materials 2021, 14, 317</small></b> <small>7 of 15</small>
30 mol%, the ratio of the signal intensity at 740 cm<sup>−1</sup> with respect to the other one at660 cm<sup>−1</sup>progressively increases, supporting the previously suggested modifier behaviorof PbF2with a related conversion of TeO4to TeO3units.
niobium environment around TeO<small>4</small> units. Under lead fluoride incorporation from 5 to 30 mol%, the ratio of the signal intensity at 740 cm<small>−1</small> with respect to the other one at 660 cm<small>−1</small>progressively increases, supporting the previously suggested modifier behavior of PbF<small>2</small>with a related conversion of TeO<small>4</small> to TeO<small>3</small> units.
<b>Figure 4. Raman spectra of glass samples in the ternary system (90−x)TeO</b><small>2</small>-10Nb<small>2</small>O<small>5</small>-xPbF<small>2</small>.
Oxyfluoride units TeOxFy are also probably formed since fluoride ions are known to decrease the glass connectivity through terminal fluoride bonds. Another Raman band centered around 870 cm<small>−1</small> also appears for higher lead fluoride contents and is often at-tributed to terminal Nb-O bonds in distorted NbO<small>6</small> units. It is worthy to note that the Nb<small>2</small>O<small>5</small> content remains constant along the 10NbyPb series, but this signal is very weak for sample 10Nb0Pb when compared to 10Nb30Pb. This is another proof of the modifier be-havior of lead fluoride, which progressively breaks the 3D covalent network and pro-motes the formation of terminal Nb-O bonds. One can also suggest that Nb-F terminal bonds could be formed but their Raman signal is probably close to the Nb-O one within the broad Raman band around 870 cm<small>−1</small>.
The whole optical window of these heavy metal fluorotellurite glasses was also vestigated in the UV-visible-NIR-MIR range and is presented between 350 nm and 8 μm in Figure 5. In the UV-visible range, the UV cut-off, supposed to be governed by the bandgap energy, is best visualized in the inset of Figure 5 and it appears that lead fluoride incorporation extends the optical window from 400 nm to about 370 nm. Such behavior of an increasing bandgap energy can be understood by the formation of molecular orbitals with a higher bonding character in the valence band and molecular orbitals with a higher antibonding character in the conduction band correlated with stronger chemical bonds formed in the glass network by fluorine incorporation (terminal Te-F and Nb-F bonds). However, the absorption of other impurities from the row materials (mainly transition metals) in this wavelength range can also not be neglected. In the middle infrared part of the optical window, the transparency is limited to about 6 μm by the multiphonon ab-sorption of the tellurite network. The strong absorption band centered at 3.2 μm is due to hydroxyl groups OH, probably present through Te-OH and Nb-OH terminal bonds. The
<b>in-Figure 4.</b>Raman spectra of glass samples in the ternary system (90−x)TeO<sub>2</sub>-10Nb<sub>2</sub>O<sub>5</sub>-xPbF<sub>2</sub>.Oxyfluoride units TeOxFy are also probably formed since fluoride ions are known todecrease the glass connectivity through terminal fluoride bonds. Another Raman bandcentered around 870 cm<sup>−1</sup> also appears for higher lead fluoride contents and is oftenattributed to terminal Nb-O bonds in distorted NbO6 units. It is worthy to note thatthe Nb2O5content remains constant along the 10NbyPb series, but this signal is veryweak for sample 10Nb0Pb when compared to 10Nb30Pb. This is another proof of themodifier behavior of lead fluoride, which progressively breaks the 3D covalent networkand promotes the formation of terminal Nb-O bonds. One can also suggest that Nb-Fterminal bonds could be formed but their Raman signal is probably close to the Nb-O onewithin the broad Raman band around 870 cm<sup>−1</sup>.
The whole optical window of these heavy metal fluorotellurite glasses was alsoinvestigated in the UV-visible-NIR-MIR range and is presented between 350 nm and 8 µmin Figure5. In the UV-visible range, the UV cut-off, supposed to be governed by thebandgap energy, is best visualized in the inset of Figure5and it appears that lead fluorideincorporation extends the optical window from 400 nm to about 370 nm. Such behavior ofan increasing bandgap energy can be understood by the formation of molecular orbitalswith a higher bonding character in the valence band and molecular orbitals with a higherantibonding character in the conduction band correlated with stronger chemical bondsformed in the glass network by fluorine incorporation (terminal Te-F and Nb-F bonds).However, the absorption of other impurities from the row materials (mainly transitionmetals) in this wavelength range can also not be neglected. In the middle infrared partof the optical window, the transparency is limited to about 6 µm by the multiphononabsorption of the tellurite network. The strong absorption band centered at 3.2 µm is dueto hydroxyl groups OH, probably present through Te-OH and Nb-OH terminal bonds.The wide optical window of these fluorotellurite glasses is a key parameter for opticalapplications up to 3 µm reached by silicate and phosphate glasses.
</div><span class="text_page_counter">Trang 9</span><div class="page_container" data-page="9"><b><small>Materials 2021, 14, 317</small></b> <small>8 of 15</small>wide optical window of these fluorotellurite glasses is a key parameter for optical appli-cations up to 3 μm reached by silicate and phosphate glasses.
<b>Figure 5. Optical window of glass samples in the (a) UV-visible-near infrared and (b) middle infrared ranges between 350 </b>
and 8000 nm.
The crystallization properties were further investigated by comparing the thermal behavior of undoped and Eu<small>3+</small>-doped glass samples in the series 10NbyPb as presented by the DSC curves in Figure 6. Although Eu<small>3+</small> doping does not modify the thermal prop-erties in compositions 10Nb0Pb and 10Nb10Pb, as better seen by the glass transition tem-peratures in Table 1, the low temperature crystallization event is highly influenced by Eu<small>3+</small>
in the glass network: whereas crystallization could not be detected for the undoped position 10Nb20Pb in the temperature range 250–450 °C, the doped glass composition ex-hibits a sharp and intense crystallization event around 355 °C and another weaker and broader event above 400 °C, such behavior being very similar to the thermal events de-tected for undoped glass compositions with 30 and 35 mol% PbF<small>2</small> (Figure 2).
<b>com-Figure 5.Optical window of glass samples in the (a) UV-visible-near infrared and (b) middle infrared ranges between 350</b>
and 8000 nm.
The crystallization properties were further investigated by comparing the thermalbehavior of undoped and Eu<sup>3+</sup>-doped glass samples in the series 10NbyPb as presented bythe DSC curves in Figure6. Although Eu<sup>3+</sup>doping does not modify the thermal propertiesin compositions 10Nb0Pb and 10Nb10Pb, as better seen by the glass transition temperaturesin Table1, the low temperature crystallization event is highly influenced by Eu<small>3+</small>in theglass network: whereas crystallization could not be detected for the undoped composition10Nb20Pb in the temperature range 250–450<sup>◦</sup>C, the doped glass composition exhibits asharp and intense crystallization event around 355<sup>◦</sup>C and another weaker and broaderevent above 400<sup>◦</sup>C, such behavior being very similar to the thermal events detected forundoped glass compositions with 30 and 35 mol% PbF2(Figure2).
<b>Figure 6. DSC curves of undoped and Eu</b><small>3+</small>-doped glass samples.
In the case of sample 10Nb30Pb, Eu<small>3+</small> doping promotes a shift of about 14 °C of the first crystallization event to lower temperature whereas the high temperature crystallization peak remains unchanged. Hence, one should emphasize the nucleating behavior of euro-pium for precipitation of the low temperature crystalline phase, which was already at-tributed to a fluoride or oxyfluoride phase. Nucleating species are usually used to promote a preferential volume nucleation with homogeneously distributed crystallites in the glass bulk. Such crystallization mechanism is required for the production of transparent glass-ceramics. As demonstrated in Figure 7a, heat-treatments for 1 h at Tx were able to crystallize only the low temperature phase through a phase separation mechanism since the high tem-perature crystallization event was not affected by such treatment. In addition, DSC meas-urements performed on powder samples with controlled grain sizes (Figure 7b) pointed out that the position and intensity of the first crystallization event is not dependent of the surface area, which is a characteristic behavior of volume crystallization.
</div><span class="text_page_counter">Trang 10</span><div class="page_container" data-page="10"><b><small>Materials 2021, 14, 317</small></b> <small>9 of 15</small>
In the case of sample 10Nb30Pb, Eu<small>3+</small>doping promotes a shift of about 14<sup>◦</sup>C of thefirst crystallization event to lower temperature whereas the high temperature crystalliza-tion peak remains unchanged. Hence, one should emphasize the nucleating behavior ofeuropium for precipitation of the low temperature crystalline phase, which was alreadyattributed to a fluoride or oxyfluoride phase. Nucleating species are usually used to pro-mote a preferential volume nucleation with homogeneously distributed crystallites in theglass bulk. Such crystallization mechanism is required for the production of transparentglass-ceramics. As demonstrated in Figure7a, heat-treatments for 1 h at Tx were able tocrystallize only the low temperature phase through a phase separation mechanism sincethe high temperature crystallization event was not affected by such treatment. In addition,DSC measurements performed on powder samples with controlled grain sizes (Figure7b)pointed out that the position and intensity of the first crystallization event is not dependentof the surface area, which is a characteristic behavior of volume crystallization.
<b><small>Figure 7. (a) DSC curves of samples 10Nb30Pb and 10Nb30Pb-Eu before and after heat-treatment and (b) DSC curves of</small></b>
<small>sample 10Nb30Pb for different granulometries. </small>
<small>The glass-ceramic samples 10Nb30Pb-TT and 10Nb30Pb-Eu-TT were also ized for a better overview of their crystalline/glassy relative composition and transpar-ency. X-rays diffraction patterns of both glass-ceramics are presented in Figure 8 and the</small>
<small>with our previous assumption that the intense low temperature crystallization event should contain fluorine. These thermal and structural data support a phase separation </small>
<small>of the nucleation and growth steps. Based on these results, it is assumed that the same crystalline phase is precipitated in both samples but the number of nuclei for this phase </small>
<small>glass-ceramics between 350 nm and 2500 nm as well as the samples visual aspect. Along this wavelength range, attenuation of incident light through the samples is promoted by both scattering and absorption mechanisms. Whereas the undoped glass-ceramic exhibits </small>
<small>glass-ceramic prepared under the same heat-treatment conditions is highly transparent and similar to the precursor glass samples. This increasing loss in transparency for sample 10Nb30Pb-TT is attributed to light scattering of the lead oxyfluoride crystallites related to</small>
<small>centers in the doped sample with an associated lower overall growth rate and smaller lead fluoride crystallites with very low scattering effects.</small>
sample 10Nb30Pb for different granulometries.
The glass-ceramic samples 10Nb30Pb-TT and 10Nb30Pb-Eu-TT were also ized for a better overview of their crystalline/glassy relative composition and transparency.X-rays diffraction patterns of both glass-ceramics are presented in Figure8and the diffrac-tion peaks could be attributed to tetragonal lead oxyfluoride Pb2OF2, in agreement withour previous assumption that the intense low temperature crystallization event shouldcontain fluorine. These thermal and structural data support a phase separation mechanismbetween Pb<sub>2</sub>OF<sub>2</sub>and the residual glassy phase with a preferential volume crystallization aswell as the ability of Eu<sup>3+</sup>to act as a nucleating agent for a better control of the nucleationand growth steps. Based on these results, it is assumed that the same crystalline phaseis precipitated in both samples but the number of nuclei for this phase growth is muchhigher in the Eu<sup>3+</sup>-doped glass. Indeed, Figure9presents the UV-visible-NIR attenuationspectra of both undoped and Eu<small>3+</small>-doped precursor glasses and final glass-ceramics be-tween 350 nm and 2500 nm as well as the samples visual aspect. Along this wavelengthrange, attenuation of incident light through the samples is promoted by both scattering andabsorption mechanisms. Whereas the undoped glass-ceramic exhibits a low transparencyand increasing attenuation for shorter wavelengths, the Eu<sup>3+</sup>-doped glass-ceramic preparedunder the same heat-treatment conditions is highly transparent and similar to the precursorglass samples. This increasing loss in transparency for sample 10Nb30Pb-TT is attributedto light scattering of the lead oxyfluoride crystallites related to larger crystallite sizes. It is
</div>