THE EFFECT OF REFORESTATION ON THE CARBON SEQUESTRATION CAPACITY OF A DEGRADED DRYLAND IN BINH THUAN, VIETNAM
Bạn đang xem bản rút gọn của tài liệu. Xem và tải ngay bản đầy đủ của tài liệu tại đây (7.81 MB, 105 trang )
<span class="text_page_counter">Trang 1</span><div class="page_container" data-page="1">
<b>MASTERARBEIT / MASTER’S THESIS </b>
Titel der Masterarbeit / Title of the Master‘s Thesis
„The effect of reforestation on the carbon sequestration capacity of a degraded dryland in Binh Thuan, Vietnam“
verfasst von / submitted by
<small> Geographie / Geography </small>
<small>Betreut von / Supervisor: </small>
<small>Mitbetreut von / Co-Supervisor: </small>
<small>Ass.-Prof. Mag. Dr. Robert Peticzka </small>
<small>Mag. Dr. Erich Inselsbacher </small>
</div><span class="text_page_counter">Trang 2</span><div class="page_container" data-page="2"><b>Erklärung </b>
Hiermit versichere ich,
• dass ich die vorliegende Masterarbeit selbstständig verfasst, andere als die angegebenen Quellen und Hilfsmittel nicht benutzt und mich auch sonst keiner unerlaubten Hilfe bedient habe,
• dass ich dieses Masterarbeitsthema bisher weder im In- noch im Ausland in irgendeiner Form als Prüfungsarbeit vorgelegt habe
• und dass diese Arbeit mit der vom Begutachter beurteilten Arbeit vollständig übereinstimmt.
Wien, am 19.05.2017
</div><span class="text_page_counter">Trang 3</span><div class="page_container" data-page="3">In addition, a big thanks goes to Axel Mentler and Alena Rabitz from University of Natural Resources and Life Sciences (BOKU) in Vienna. My colleague Alena Rabitz was doing her thesis about organic farming in Binh Thuan at the same time and we supported each other in the organization and research for the theses. Axel Mentler from the Institute of Soil Research at BOKU helped me with the planning and the analyses of the soil sampling. He always gave good input and had great ideas for my research. In addition, he helped me with the analyses of the soil samples in the laboratory.
Without the support I received within Vietnam it wouldn’t have been possible to conduct this thesis. I want to express my gratitude to the supervisors and staff of the Faculty of Chemistry of Vietnam National University – Hanoi University of Science. In particular, I would like to acknowledge the access to the laboratory in Hanoi and the strong support given by my supervisors Tien Duc Pham and Tu Binh Minh, the Dean of Faculty of Chemistry Le Thanh Son and Nguyen Manh Ha, who supported me in the laboratory in Hanoi.
I also would like to thank Chu Dinh Binh from Hanoi University of Science and Technology who was my first contact in Vietnam and who supported me with the organization of my research and continuously stayed in touch with me.
I would also like to thank my friend Le Thi Bich Phuong for her assistance and for translating Vietnamese to English during the field trip in Binh Thuan for a whole month. She always did her best to support me while writing this thesis.
Finally, I want to thank the officials in Vietnam, particularly in Binh Thuan, for giving me permission to do research and to share information for this Master´s thesis.
Alexander Hollaus, University of Vienna, May 2017
</div><span class="text_page_counter">Trang 4</span><div class="page_container" data-page="4"><b>Abstract </b>
Land degradation in drylands, also called desertification, caused by human impacts and climatic factors, results in a decline of ecological functionality as well as socioeconomic problems. Moreover, land degradation releases carbon (C) from soil and vegetation into the atmosphere in the form of carbon dioxide where it acts as a greenhouse gas, contributing to global warming. Thus, action is required to reduce dryland degradation in order to mitigate climate change. A key measure used for C sequestration and ecosystem restoration is reforestation. Understanding the potential of reforestation for the storage of C in vegetation and soil is essential if this action is to be applied to combat desertification. The purpose of this Master’s thesis is to examine the interactions between reforestation and C sequestration during the restoration of a dryland area in Binh Thuan, Vietnam. The study area, Hoa Thang commune, is prone to land degradation because of its semiarid/sub-humid climate and geology. Especially the coastal plains are dominated by degraded consolidated and unconsolidated sandy soils. Thus, a comparison between the C content in the soil and vegetation of degraded, reforested as well as natural forest areas can show the sequestration potential of C through reforestation. Soil samples were taken in the study area and analyzed in the laboratory for total C content as well as other soil characteristics to determine soil fertility. Additionally, a remote sensing analysis of the research area was carried out to create a potential C sequestration map. The results indicate high C
<i>sequestration potential in Acacia mangium plantations compared to Azadirachta indica </i>
plantations and barren land during the first 10 years. Tree species used for plantations are, along with the age of the forest, a major factor determining the C storage capacity. Nonetheless, natural forests store a higher proportion of C in soil and contribute to higher biodiversity. Human impact on the C storage potential in plantations and natural forests is very high since logging for timber or charcoal production was observed to cause a decrease in biomass and soil C. In conclusion, reforestation in the research area could potentially help in sequestering C and mitigating dryland degradation, provided that human impact is reduced.
<b>Zusammenfassung </b>
Landdegradierung in Trockengebieten, auch Desertifikation genannt, wird durch menschliche Aktivitäten und klimatische Faktoren verursacht und führt zu einem Rückgang der ökologischen Funktionalität und zu sozioökonomischen Problemen. Darüber hinaus wird durch die Landdegradierung Kohlenstoff (C) aus Boden und Vegetation in die Atmosphäre in Form von Kohlendioxid freigesetzt, wo es als Treibhausgas wirkt und die Klimaerwärmung verstärkt. Daher müssen Maßnahmen in den Trockengebieten getroffen werden, um die Auswirkungen der Degradierung auf den globalen Klimawandeln abzuschwächen. Eine Schlüsselmaßnahme für die Sequestrierung von C und die Wiederherstellung des Ökosystems ist die Wiederaufforstung. Es ist daher wesentlich ein Verständnis für die Zuverlässigkeit und das Potenzial dieser
</div><span class="text_page_counter">Trang 5</span><div class="page_container" data-page="5">Schlüsselmaßnahme für die Speicherung von C in Vegetation und Boden zu entwickeln. Das Ziel dieser Masterarbeit ist es, diese Wechselwirkungen zwischen Wiederaufforstung und C-Sequestrierung bei der Restauration eines Trockengebiets in Binh Thuan, Vietnam, zu untersuchen. Das Untersuchungsgebiet, welches die Gemeinde Hoa Thang umfasst, ist wegen seines semiariden/sub-humiden Klimas und der Geologie anfällig für Landdegradierung. Vor allem die Küstenebenen werden von degradierten konsolidierten und unkonsolidierten sandigen Böden dominiert. Ein Vergleich zwischen dem C-Gehalt in Boden und Vegetation von degradierten Flächen und aufgeforsteten sowie natürlichen Waldgebieten soll die Speicherkapazität von C durch Wiederaufforstung zeigen. Im Untersuchungsgebiet wurden Bodenproben genommen und im Labor auf den Gesamt-C-Gehalt sowie andere Bodenmerkmale analysiert, um die Bodenfruchtbarkeit zu bestimmen. Zusätzlich wurde eine Fernerkundungsanalyse des Forschungsgebiets durchgeführt, um eine C-Sequestrierungskarte zu erstellen. Die Ergebnisse zeigen ein hohes C-Sequestrierungspotential in Acacia mangium Plantagen im Vergleich zu Azadirachta indica Plantagen und degradierten Flächen in den ersten 10 Jahren nach der Wiederaufforstung. Baumarten, die für die Wiederaufforstung verwendet werden, sind neben dem Alter des Waldes ein wichtiger Faktor in der C-Speicherkapazität. Die natürlichen Wälder speichern einen höheren Anteil an C im Boden und tragen zu einer höheren Biodiversität bei. Die Auswirkung der menschlichen Aktivitäten auf den C-Speicher in Plantagen und natürlichen Wäldern ist aufgrund der Holz- und Holzkohleproduktion sehr hoch, was zu einer Abnahme der Biomasse und des C-Gehalts im Boden führt. Zusammenfassend sieht man, dass die Wiederaufforstung im Forschungsgebiet dazu beitragen kann, die Degradierung von Trockengebieten zu verringern und die Sequestrierung von C zu verbessern, wenn die
<b>menschlichen Einwirkungen reduziert werden. </b>
<b>Bản tóm tắt </b>
Suy thoái đất ở các vùng đất khơ cằn, cịn được gọi là sa mạc hóa, gây ra bởi các tác động của con người và các yếu tố khí hậu, dẫn đến sự suy giảm chức năng sinh thái cũng như các vấn đề kinh tế xã hội. Hơn nữa, sự thoái hoá đất thải carbon (C) khỏi đất và thực vật vào khí quyển dưới dạng carbon dioxide, nơi nó hoạt động như một khí nhà kính và góp phần làm nóng tồn cầu. Vì vậy, cần thiết hành động để giảm sự xuống cấp của vùng đất khô hạn nhằm giảm nhẹ sự thay đổi khí hậu. Một biện pháp quan trọng được sử dụng để củng cố và phục hồi hệ sinh thái C là tái trồng rừng.
Hiểu được tiềm năng tái trồng rừng đối với việc cô lập C trong thực vật và đất đai là rất cần thiết nếu hành động này được sử dụng để chống hoang mạc hóa. Sự hiểu biết này cũng có thể được sử dụng để dự đốn kịch bản biến đổi khí hậu trong tương lai. Mục đích của luận án Thạc sỹ này là xem xét các tương tác giữa trồng rừng và giữ đất trong quá trình khơi phục vùng đất khơ ở
</div><span class="text_page_counter">Trang 6</span><div class="page_container" data-page="6">Bình Thuận, Việt Nam. Khu vực nghiên cứu, xã Hịa Thắng, có xu hướng bị thối hố đất do khí hậu khơ cằn, thiếu nước và địa chất.
Các vùng đồng bằng ven biển đặc biệt bị chi phối bởi đất cát củng cố và chưa được củng cố. Như vậy, việc so sánh hàm lượng C trong đất và thực vật của các khu vực rừng bị suy thoái, tái trồng rừng cũng như rừng tự nhiên có thể cho thấy tiềm năng cơ lập C thơng qua việc trồng lại rừng. Các mẫu đất được lấy ở khu vực nghiên cứu và phân tích trong phịng thí nghiệm với tổng hàm lượng C cũng như các đặc tính đất khác để xác định độ màu mỡ của đất. Ngồi ra, một phân tích từ vệ tinh không gian của 10 năm trước cho khu vực nghiên cứu đã được thực hiện để tạo ra một bản đồ C tích lũy tiềm năng. Kết quả cho thấy tiềm năng cô lập C cao ở đồn điền Acacia mangium so với rừng trồng Azadirachta indica và đất trống trong 10 năm đầu. Các loài cây trồng được sử dụng cho trồng rừng, cùng với độ tuổi của rừng, là yếu tố chính xác định khả năng lưu trữ C. Tuy nhiên, rừng tự nhiên có tỷ lệ C trong đất cao hơn và góp phần vào sự đa dạng sinh học cao hơn. Tác động của con người lên tiềm năng lưu trữ C trong các đồn điền và rừng tự nhiên rất cao do việc khai thác gỗ hoặc sản xuất than đã làm giảm sinh khối và đất C. Kết luận rằng trồng rừng ở khu vực nghiên cứu có thể giúp giảm thiểu sự thối hóa đất khơ và cải thiện hấp thu của C, với điều kiện con người giảm tác động không tốt tới đất, rừng và các điều kiện tự nhiên khác ở khu vực này.
</div><span class="text_page_counter">Trang 7</span><div class="page_container" data-page="7">DBH Diameter at Breast Height DOC Dissolved Organic Carbon BL Barren Land Class (Barren) EC Electrical Conductivity E<small>4</small>/E<small>6 </small> Fulvic Acid/Humic Acid Ratio
FAO Food and Agriculture Organization of the United Nations NF Natural forest Class (nForest)
MARD Ministry of Agriculture and Rural Development, Vietnam NDVI Normalized Density Vegetation Index
nForest Natural forest N<small>tot</small> Total Nitrogen
</div><span class="text_page_counter">Trang 8</span><div class="page_container" data-page="8">3.5. Soil Chemical and Physical Analysis ... 13
3.6. Estimation of Carbon Sequestration ... 15
4.1.2. Plantation A. mangium 2yr ... 18
4.1.3. Plantation A. mangium 5yr ... 20
4.1.4. Plantation A. indica 7yr ... 20
4.1.5. Plantation A. indica 10yr ... 20
</div><span class="text_page_counter">Trang 9</span><div class="page_container" data-page="9">4.2.7. Cations ... 25
4.2.8. Total Nitrogen ... 27
4.2.9. Total Carbon ... 28
4.2.10. C:N Ratio ... 30
4.2.11. Dissolved Organic Carbon (DOC) ... 30
4.2.12. Humic Acid to Fulvic Acid Ratio (E4/E6) ... 31
4.2.13. C Storage ... 32
4.2.14. Comparison of Soil TC Content Analyses of Hanoi and Vienna ... 34
<b>5. Discussion ... 35 </b>
5.1. Effect of Tree Species and Biomass on Soil C ... 36
5.2. Effect of Soil Properties on Soil C ... 40
5.3. Carbon Stock in Hoa Thang ... 42
</div><span class="text_page_counter">Trang 10</span><div class="page_container" data-page="10"><b>1. Introduction </b>
Drylands, occupying approximately one third of the total land area of the globe, are very sensitive terrestrial ecosystems and prone to land degradation. In drylands one major limiting factor which affects soil fertility and biomass production is the lack of water because of frequently high evapotranspiration due to high temperature and low rainfall. (Loik, et al., 2004; FAO, 2004b) Generally, there is a lower biomass productivity, which results in low soil organic matter (SOM) and nutrient concentration in soil (Lal, 2001a). SOM in drylands usually reaches a content of 0.5-1.6% (SOC ~0.2-0.8%) (Lal, 2003; Lal, 2002).
The degradation of drylands through human and climatic impacts, also known as desertification, influences local ecosystem functionality and thus decreases the quality of soil and vegetation. (D’Odorico, et al., 2013; Lal, 2011) All drylands, especially semiarid types, are prone to desertification which could lead to a loss of soil aggregation (Lavee, et al., 1998; Taghizadeh-Mehrjardi & Akbarzadeh, 2013), disruption of the biogeochemical cycles of for example carbon, nitrogen and phosphorus (Graaff, et al., 2014; D’Odorico, et al., 2013; Schlesinger, et al., 1990), a change in water and energy balance (Houérou, 2002; Nicholson, et al., 1998; D’Odorico, et al., 2013) and a decrease in agricultural productivity (Kassas, 1995). Furthermore, carbon (C) stored in biomass and soil is released through different maladjusted land use practices into the atmosphere in the form of CO<small>2 </small> (Lal, 2001a; FAO, 2004b). The impacts of human activities consist mainly in the reduction of vegetation cover, leading to an increase in soil erosion by wind and water resulting in a displacement of material and to CO<small>2 </small>emissions (Houerou, 1996; Mensching, 1990; D’Odorico, et al., 2013). The rate of C released from soil respiration and biomass decay depends on the activity of microbiological decomposition as well as on erosion processes. These factors are strongly influenced by desertification. (FAO, 2004b; Batjes & Sombroek, 1997) However, degraded drylands have the potential to store C by way of adapted land use practices (Lal, 2001a) because of a long residence time of SOM due to the slow turnover time of organic matter (Lal, 2004) and the huge land area, occupied by drylands (FAO, 2004b; Lal, 2001b; Keller & Goldstein, 1998). Thus drylands can be used to sequester C from the atmosphere by biomass production and uptake of organic substances from soil. Soil can store three times more carbon than plant biomass (Batjes & Sombroek, 1997). Therefore, increasing the capacity of dryland ecosystems to sequester C is a key measure to reduce greenhouse gas emissions and thereby mitigate global climate change (FAO, 2004b).
Possible actions to improve and retain C storage in dryland areas is to maintain forests or to reforest degraded land (Li, et al., 2013). The starting point for international reforestation and deforestation reduction programmes were in the 1970s when the degradation of drylands appeared on the agenda of the UN and in the public consciousness for the first time. (Kassas, 1995; Thomas, 1993; Hermann & Hutchinson, 2005; Houérou, 2002; Thomas, 1997) Programmes, such as the United Nations Collaborative Programme on Reducing Emissions from
</div><span class="text_page_counter">Trang 11</span><div class="page_container" data-page="11">Deforestation and Forest Degradation (UN-REDD) – established in 2008 – were implemented to reduce C emission from deforestation by supporting national governments to conserve forest areas. Furthermore, the application of reforestation or afforestation measures to combat desertification and support C sequestration are well funded by international organizations and development agencies, such as the UNFCCC and UNCCD. Based on the international cooperation, conservation and sustainable management of forests as well as the enhancement of the C forest stock are aims in the REDD+ concept. Therefore, extensive national action plans are created and are financially supported in Vietnam and other countries to determine and to restore the C stock in biomass and soil. Vietnam is one of the pioneer countries participating in such programmes. (UN-REDD; UNEP, 2014) The country has to cope with strong erosion and leaching after deforestation due to its monsoonal and tropical/subtropical climate and loses a huge amount of productive soil every year (Global Mechanism of the UNCCD, 2008). Thus, Vietnam already implemented, after years of severe deforestation, national reforestation actions in the 1990ties, such as the Five Million Hectares Rehabilitation Program (5MHRP) (McNamara, et al., 2006).
The southeastern coastal area of Vietnam is a particularly semiarid/sub-humid region with a long lasting dry season in winter due to the orographic situation. Furthermore, the geological genesis and the sandy soils make the area prone to land degradation. This region is affected by desertification owing to the massive deforestation in the 1970s and subsequent extensive agricultural cultivation as well as increasing soil erosion through aeolian processes and massive rainfall events during the summer season. (Gobin, et al., 2012) Reforestation programmes in the region have already been carried out since Vietnam ratified the UN Convention to Combat Desertification in 1998 and are intended to reduce the spread of sand dunes, as well as to increase the quality of the soil and to maintain ecosystem functionality (UNCCD, 2002; Nguyen & Catacutan, 2012). An additional aim of these programs is to increase C storage in the forest areas and reducing C emissions to the atmosphere (UNEP, 2014; UN-REDD).
However, it remains unclear how effective such reforestation measures for C storage in soil and vegetation in degraded drylands are (Dang & Do, 2014). This Master's thesis aims to obtain data on C content in this ecosystem and investigate the question: How do reforestation measures for combating land degradation affect total C content in soils and vegetation during the first years of forest growth in the communal area of Hoa Thang (Binh Thuan, Vietnam)? The hypotheses for the study are that
(i) after reforestation, C content in soils increases, but remains at a lower level than other degraded and non-degraded areas in Vietnam with ecosystems other than drylands, (ii) in the first ten years following reforestation C is mainly stored in the tree biomass, (iii) the C content in degraded soils is lower compared to soils under plantation and natural
forest.
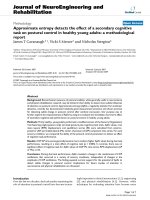
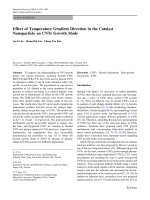
</div><span class="text_page_counter">Trang 12</span><div class="page_container" data-page="12">To answer the research question, soil samples were taken in a field mission and above- and belowground biomass estimations were conducted in six different classes to create a C storage change timeline from barren land (BL) to plantation (P) to continuously forest covered land (natural forest, NF). The research design is built on a model that claims that natural forest, because of its climax state of forest succession, has the highest and degraded barren land the lowest potential of C storage. Thus, the C pool of biomass grows after the establishment of a forest by increasing tree density and tree growth (Figure 1). Furthermore, higher biomass production contributes more C to the soil pool. Additionally to the enhanced C production in biomass, increased soil fertility and vegetation cover will reduce the loss of C from soils through leaching and erosion. These conditions are also true for plantations which are artificially planted. Therefore, the further the forest succession, the higher the biomass on a site and the higher the C storage in the biomass and soil pools.
<i><small>Figure 1: Model of forest succession with higher biomass in older forest stands and thus increased C in biomass and soil (drawing by Affendi Belawan 2016). </small></i>
<small>C storage in biomass and soil pools increases with the succession of forest through higher tree density and tree growth </small>
<small>Low potential of C storage </small>
<small>High potential of C storage </small>
</div><span class="text_page_counter">Trang 14</span><div class="page_container" data-page="14">formed by Cretaceous dacitic and rhyolitic hard basement rocks, which emerge at some places on the surface in the form of inselbergs. The basement rock is overlaid by marine and reworked aeolian sand accumulations. (Quy, et al., 2001; Nguyen, et al., 2009) The sand was mainly deposited as a coastal barrier succession in the late Pleistocene in the last interglacial maximum (Oxygen Isotope Substage 5) and in Holocene times at the last sea level peak (7 ka ago) as a result of the marine transgression. Further aeolian reworking with overlying processing of the sand deposits occurred in the Last Glacial Maximum (28 – 19 ka). In Hoa Thang three main sand types of red, white and yellow colour appear at the surface, where the former was deposited in the Pleistocene with underlying white marine sand which can be seen at the surface in deep erosion valleys. This sequence forms the inner barrier and extends over most of the area. The yellow sand was deposited in the Holocene and forms the outer barrier succession mostly along the coast line. At some places the inner barrier shapes the coast line because of coastal erosion. The barrier systems reach a height of around 160 m APSL with consolidated sand to active dune fields. (Murray-Wallace, et al., 2002) Thus, the geomorphology of the area shows gently slopes, deep cut in valleys and gullies as well as sand dunes and aeolian sand accumulation. Groundwater can be found in two aquifers with different depths ranging from 20-40 m and 60-90 m (Nguyen, et al., 2009). In depressions, close to the dune field groundwater fed lakes, such as Bau Trang (lake), emerge at the surface. River systems are very short and are mostly close to the coast line. The main soil types in this area are haplic and rhodic Arenosols. Arenosols can be divided according to the Vietnamese soil classification into three sandy soil units: white and yellow sand dunes soils; red sand dunes soils; and sandy marine soils. (MARD, 2002) Arenosols are characterized by sandy texture and a weak development of layers. Permeability of these soils is mostly high and water holding capacity as well as the nutrient storage potential is very low. Thus, nutrients are generally stored in the biomass of vegetation and in the soil organic matter. (IUSS Working Group WRB, 2015) The land use/cover in the research area ranges from active dune fields to pasture, agriculture for annual and perennial crops as well as forestry for timber and charcoal production (Gobin, et al., 2012). Thus, forest cover in the area is fluctuating very fast because of the clear cut after a plantation rotation. In Vietnam natural forest and plantations with timber and non-timber products are classified as production forest. The dry tropical natural secondary forest in the study area, called Rung Nhu, is used as protection forest in the core parts and as production forest in the outer parts. (Mant, et al., 2013) During the time of the Vietnam war, the forest was used as hiding place for soldiers. After the war a massive clearing of the forest started. Thus, forest cover decreased after 1975 until the end of the 1990s, since then reforestation programmes have been implemented (UNESCO, 2012). Nonetheless, signs of tree cutting and charcoal production can be found in many localities. Reforestation occurs mainly in the form of monoculture production forest with tree species adapted to the semiarid climate, such
<i>as Acacia mangium and Azadirachta indica. On abandoned sites natural vegetation succession </i>
can establish.
</div><span class="text_page_counter">Trang 15</span><div class="page_container" data-page="15"><b>3. Methods </b>
For the examination of the C storage in biomass and soil in the research area a remote sensing analysis, a field trip for forest inventory and soil sampling as well as soil analyses in the laboratory were conducted. For the analyses of C sequestration capacity C content in soil was examined in 3 classes – barren land (BL), plantation (P) and natural forest (NF) – to detect a change of the C content over time, with the class barren land as initial and natural forest as climax stage of vegetative succession. In the class plantation, subclasses of different forest ages – 2, 5, 7 and 10 year-old – were selected during the remote sensing analysis. At the 12 examined plots – 3 in BL, 4 in NF and 7 in P (1 plot in the subclass 2-year-old P; 2 in the others) – 2 to 3 soil profiles were taken with a core drill (Pürckhauer) (Table 1). At 10 of the 14 plots a forest inventory was conducted. The distribution of the sample sites was organized so that the BL and NF plots were directly adjacent to the P plots selected in the remote sensing analysis (Figure 2).
<i><small>Table 1: Overview of plots for soil sampling and forest inventory with coordinates, forest vegetation, soil type and soil colour. x marks plots with conducted forest inventory; DD: Decimal Degrees. </small></i>
<b><small>Plot ID </small></b>
<small>(years) </small>
<small>Soil Profile </small>
<small>Forest Inventory </small>
<small>Forest Vegetation </small>
<small>Soil </small>
<small>see species list in Annex: Table 20 </small>
<small>Haplic Arenosol </small>
<small>light brown </small>
<i><small>indica </small></i> <sup>Haplic Arenosol </sup>
<small>reddish yellow </small>
<i><small>Acacia mangium </small></i>
<small>Haplic Arenosol </small>
<small>yellowish red </small>
<i><small>indica </small></i> <sup>Haplic Arenosol </sup>
<small>yellowish red </small>
<b>3.1. Field Sites </b>
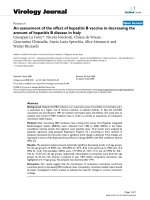
During the field trip in April 2016 – at the end of the extended dry season influenced by recent El Niño phenomena (FAO, 2016) – the field sites (Figure 3) chosen in the remote sensing analysis were tested. The examination plots in every class were selected randomly. The natural forest and barren land class act as reference sites for the plantation plots assuming that the environmental conditions (e.g. soil properties) of nearby plots are similar. Thus, plantation plots 1P and 2P are related to 3NF (natural forest) and 1BL (barren land) – cluster east – as well as 4P, 5P, 6P, 7P are clustered with 4NF and 3NF – cluster west. For 3P only the barren land class 2BL – cluster central – acts as reference site, because of no natural forest in the proximity.
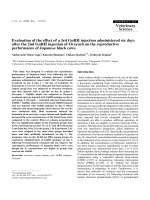
</div><span class="text_page_counter">Trang 16</span><div class="page_container" data-page="16"><i><small>Figure 3: Top: Natural forest plots (Rung Nhu) 4NF (left) and 2NF (right); Bottom: Plantation (2P) of 7-years-old A. </small></i>
<i><small>indica trees (left) and barren land (2BL) with plantation (3P) of 2-years-old A. mangium trees in the background. </small></i>
</div><span class="text_page_counter">Trang 17</span><div class="page_container" data-page="17">natural vegetation was reestablished. Hence, vegetation cover is not as dense as it is at other places. The NF class represents the climax succession of natural vegetation.
<b>3.1.2. Barren Land </b>
The class barren land (BL) is characterized by scattered grass and shrub cover and is either used for pasture or has no particular use (Figure 3). Gully and aeolian erosion as well as sand accumulations and soil compaction are visible and indicate land degradation in the research area.
<b>3.1.3. Plantation </b>
Plantations are planted monocultural forests – also in terms of the FAO forest definition – with fast growing tree species (Figure 3) classified as production forest in Vietnam (MARD, 2010). The examined plantations were classified in four subclasses of different plantation ages where tree
<i>species of Acacia mangium (2 and 5-years-old) and Azadirachta indica (7 and 10-years-old) are </i>
planted in rows. For the remote sensing analysis classes are labeled as “plantation + age” since not all identified plantations in the research area are planted with the same tree species. In the plot analysis classes are labeled with “(plantation +) tree species + age”. Generally, plantations
<i>of A. mangium are cleared after a rotation of 7-15 years in Vietnam (MARD, 2010). At the </i>
10-year-old plantation, trees were thinned out and new trees were growing. This indicates that the forest is used continuously and protection forests are in a steady transition without reaching a climax situation.
<b>3.1.4. Agricultural Land </b>
In the research area agricultural land is cultivated with perennial crops such as dragon fruit, mango, cassava and cashew as well as annual crops like peanuts and sweet potatoes. For this study agricultural areas were integrated in the remote sensing analysis for the estimation of the C storage capacity. Data about Total Carbon (TC) content are not further investigated.
<b>3.2. Remote Sensing Analysis </b>
For the remote sensing analysis Landsat 5 and 8 as well as Aster images were collected over the research area for the month of April for the last 11 years. In the case of unavailability of a particular year’s image for April, images from January to March were selected. Aster data were used for the selection of the sampling site, because of their higher resolution and thus improved identification of forest or non-forest areas. Sample site selection was done by calculating the normalized difference vegetation index (NDVI) following Equation 1 from ASTER data in the time from 2005 until 2016 - where images were available. (Nguyen, et al., 2012; Lu, 2006)
<i><small>Equation 1: </small></i>
𝑁𝐷𝑉𝐼 = <sup>(𝑁𝐼𝑅 − 𝑅𝐸𝐷)</sup>(𝑁𝐼𝑅 + 𝑅𝐸𝐷)
<i><small>NDVI Normalized Difference Vegetation Index NIR Near-infrared Band </small></i>
<i><small>RED Visible Red Band </small></i>
</div><span class="text_page_counter">Trang 18</span><div class="page_container" data-page="18">Through a change analysis of NDVI between years the development of the forest cover could be estimated and chronologically categorized (Equation 2). Since for the research qualified ASTER images were not available for every year, additional high resolutions images from Google Earth were visually analysed for the establishment of forest vegetation at a plot.
<i><small>Equation 2: </small></i>
∆ 𝑁D𝑉𝐼 = 𝑁𝐷𝑉𝐼<sub>𝑖</sub>− 𝑁𝐷𝑉𝐼<sub>𝑖+𝑗</sub>
<i><small>∆ NDVI Change in Normalized Difference Vegetation Index </small></i>
<i><small>NDVIiNormalized Difference Vegetation Index in the base year i </small></i>
<i><small>NDVIi+j Normalized Difference Vegetation Index j years after the base year i</small></i>
This method allowed the age of a plantation to be identified, ± 2-3 years. The data time series of Landsat 5 and 8 enabled further analyses to be conducted and interpreted for forest or non-forest areas based on these images. Thus, the year that the forest was established could be calculated with an uncertainty of one year (Annex: Chap. 4). The next step included a transformation of the NDVI to forest or non-forest land. For each image NDVI values for forest and non-forest were selected individually since NDVI values are dependent on satellite and environmental conditions. The histogram of the NDVI distribution was visually interpreted and natural breaks were used as a first classification method between forest and non-forest area. Additionally, known forest area with low NDVI were taken as the lowest NDVI value of forest land. Every area with higher values was classified as forest and with lower values as non-forest. Agricultural areas, settlement areas, lakes and natural forest areas – for a further step to distinguishing natural forests from plantations – were manually excluded from the NDVI analyses for plantation by simply leaving out the main areas of their distribution based on field experience. Furthermore, it was also a requirement that the established forest still existed during the field trip in April 2016. Thus, the resulting map from the change analyses represents the establishment year contrasted to the reference year (April 2016) image. The change analyses for the C sequestration map included time ranges for every class. Thus, 10-year-old plantations represent established forests in 2006 till 2004, 7-year-old from 2006 till 2009, 5-year-old from 2009 till 2013 and 2-year-old from 2013 to 2016. Therefore, the area of established forest in a previous year could be smaller in 2016 because deforestation may have occurred in the interim. During the field trip the classes were validated and the plots were randomly selected from the different classes. After ground data collection, C data from soil sampling and biomass estimation (Chap. 3.3, 3.4) from the plots were integrated with the GIS data and extended over the research area to estimate the total C sequestration capacity. In the resulting map land cover can be differentiated into natural forest (e.g.Rung Nhu), plantations with the age of 2, 5, 7, and 10 years, barren land, lakes and agriculture. All analyses were done with ArcGIS 10.4 and with Python 2.7.10.
</div><span class="text_page_counter">Trang 19</span><div class="page_container" data-page="19"><b>3.3. Biomass Estimation </b>
Biomass was estimated through forest inventory and allometric equations for the tree species and forest type following the description of FAO (2004a). Total biomass for one plot (i) was calculated by adding aboveground biomass (AGB<i><small>(i)</small></i>), belowground biomass (BGB<i><small>(i)</small></i>) and litter biomass (B<small>Litter</small><i><small>(i)) </small></i>(Equation 3):
<i><small>Equation 3: </small></i>
<i><small>Btot(i)Biomass total for plot i </small></i>
<i><small>AGB(i) Aboveground Biomass for plot i BGB(i) Belowground Biomass for plot i BLitter(i) Litter Biomass for plot i </small></i>
For the calculation of AGB tree diameter at breast height (DBH) and tree height was measured for every tree and shrub at the randomly selected 10x10 m plot in the 5 forest stands. DBH were taken at 1.30 m (breast height) by determining the perimeter with a measuring tapeline and calculating the diameter. Tree height was measured with a laser distance meter or – if not possible – with an inclinometer from eye level (1.70 m) up to the top of the crown. For inclinometer assessment, additional tree-to-measurement position distance was measured to calculate the tree height by trigonometry (Equation 4). For the laser distance meter method only 1.70 m were added to the measured distance to the crown because the distance between the observer and the tree was small and deviations from the real tree height negligible.
<i><small>Equation 4: </small></i>
𝐻𝑡 = tan 𝛼 ∗ 𝑑 + ℎ𝑚
<i><small>Ht Tree height d Distance to tree </small></i>
<i><small>𝛼 Angle to top of the crown hm Measuring height </small></i>
Tree species were identified in the field, corroborated by literature and expert communication. With the information about the vegetation and climate data, natural forest was classified into sub-evergreen, dense dryland forest (Tran, et al., 2012) for the selection of the allometric equation, although the term semi-dense shrub land can be used for the transition area to the adjacent barren land - where sampling plots are located (see also remarks in methods: Chap. 3.1.1.) In a further step, appropriate allometric equations were collected for all different forest types from literature based on DBH, height, species, ecoregion and rainfall. The equations for the natural forest were derived from comparing different allometric formula. One equation is provided from a study by UN-REDD which developed biomass allometric equations for deciduous forests close to the research area (Hung, et al., 2012). In addition, two generally accepted equations from FAO (2004) and two equations from Chave et al. (2005) were tested. The equation which was closest to the mean value between all equations was chosen for the further analyses. Thus, the equation
</div><span class="text_page_counter">Trang 20</span><div class="page_container" data-page="20">from Chave et al. (2005) was selected to calculate AGB for the natural forest class (Equation 5). The equation was developed for dryland forests with rainfall below 1,500 mm/year and a long lasting dry season. The equation includes diameter (D), height (H) and wood density (p). (Chave, et al., 2005) For wood density 0.57 g/cm<small>3</small> was applied as an average value for tropical forests (FAO, 1997).
<i><small>Equation 5 (Chave, et al., 2005): </small></i>
𝐴𝐺𝐵<sub>𝐹𝑁</sub>= exp(−2.187 + 0.9160 𝑥 𝑙𝑛(𝑝𝐷<sup>2</sup>𝐻))
<i><small>AGBNF Aboveground Biomass for the Natural forest class (kg) p Wood density (g/cm3) </small></i>
<i><small>D Diameter (cm) H Height (m) </small></i>
Since primary biometric variables (e.g. DBH, height, wood density) play an important role in the biomass calculation species-specific allometric equations were chosen from literature for the
<i>different plantations (Ali, et al., 2015). Thus, for the Acacia mangium plantations in the age of 2 </i>
and 5 years an allometric equation from Miyakuni et al. (2004) was applied and includes diameter at breast height (DBH) as a variable (Miyakuni, et al., 2004) (Equation 6).
<i><small>Equation 6 (Miyakuni, et al., 2004): </small></i>
<i><small>Equation 7 (Bohre & Chaubey, 2016): </small></i>
𝐴𝐺𝐵<sub>𝐴𝑖</sub> = stem wood volume x WD x BEF
<i><small>AGBAi Aboveground Biomass of Azadirachta indica (kg) WD Wood Density (g/cm3) </small></i>
<i><small>BEF Biomass Extension Factor Equation 8 (Bohre & Chaubey, 2016): </small></i>
𝑉<small>𝐴𝑖</small> = −0.068 + 0.008𝐷 + 4.191 𝑥 10 − 5𝐷<sup>2</sup>2𝐻 − 1.038 𝑥 10 − 9
<i><small>VAiVolume of Azadirachta indica D Diameter Breast Height (cm) WD Height (m) </small></i>
</div><span class="text_page_counter">Trang 21</span><div class="page_container" data-page="21">After AGB calculation BGB was estimated by applying shoot to root ratio from the literature (Equation 9). For natural forest sites a factor of 0.40 was selected because of the high amount of
<i>shrub vegetation at the plot (IPCC, 2006). For the A. mangium plantations a ratio of 0.23 was used following a study in a degraded A. mangium stand in Indonesia (Syahrinudin, 2005). For the A. indica site the ratio was set to 0.27 derived from a study about root biomass at a research farm </i>
in India (Das & Chaturvedi, 2008).
<i><small>Equation 9: </small></i>
𝐵𝐺𝐵 = 𝐴𝐺𝐵 𝑥 𝑆𝑅
<i><small>BGB Belowground Biomass (kg) AGB Aboveground Biomass (kg) SR Shoot-to-Root Ratio </small></i>
AGB and BGB for each tree in kg was summed up for every plot of 100 m<small>2</small> and divided by 10 to obtain tonnes per hectare (t/ha).
Litter biomass was estimated at one plot in every class by taking litter from randomly selected subplots of an area of 0.25 m<small>2</small> (0.5x0.5 m). The samples were air dried and weighed. Additionally, during the field survey litter cover in percent was estimated for the plots. Litter biomass was calculated by multiplying the weight with the litter cover in percent (Equation 10).
<i><small>Equation 10: </small></i>
<i><small>BlitterLitter Biomass (kg/ha) Lw Weight of Litter per plot (kg) Lc Litter cover of the plot (%) </small></i>
Total biomass was calculated by adding the three compartments of biomass, AGB, BGB and B<small>litter</small>, together.
<i><small>Equation 11: </small></i>
𝐵<sub>𝑡𝑜𝑡</sub>= 𝐴𝐺𝐵 + 𝐵𝐺𝐵 + 𝐵<sub>𝑙𝑖𝑡𝑡𝑒𝑟</sub>
<i><small>Btot Total Biomass (t/ha) AGB Aboveground Biomass (t/ha) BGB Belowground Biomass (t/ha) Blitter Litter Biomass (t/ha)</small></i>
<b>3.4. Soil Sampling </b>
Soil samples were taken at every plot. Sampling spots in the plots were chosen at three places under different impact factors of (i) close to tree/non-tree, (ii) low/medium/high litter cover and (iii) low/medium/high occurrence of roots to get a range of conditions which can influence soil properties. The soil was taken with a one-meter drill (Pürckhauer) with a core diameter of 2 cm. Sampling depth was 1 m from soil surface. Since the soil had a low coherence and was falling out of the drill during extraction from the ground the drill was inserted into the soil at an angle of
</div><span class="text_page_counter">Trang 22</span><div class="page_container" data-page="22">between 70° to 90° into the soil surface. Furthermore, to mitigate the loss of soil from the drill during extraction, the soil falling out from the top 0 to 15 cm was captured using a shovel. The sampling depth was at an interval of 5 cm until a depth of 30 cm and after this in 10 cm steps. Additionally, because of the soil loss from the drill from the top layers, bulk samples were collected with a shovel from the top 30 cm in intervals of 5, 10, 15 and 30 cm. Therefore, a hole approximately 30 cm deep was dug and samples were taken with the shovel on the side wall of the hole. Soil samples from the drill method and the bulk samples were collected in plastic bags, marked with a sample ID, air dried for 48 hours, sieved using an analytical sieve of a 2 mm mesh size according to the Austrian Standard (ÖNORM) L-1060 (2004) and finally transported to the laboratory. For the analyses representative composite samples for the soil depth of 0-5, 5-10, 10-20, 20-40, 40-60, 60-100 cm were combined from the taken samples.
<b>3.5. Soil Chemical and Physical Analysis </b>
Soil analyses were carried out at the Faculty of Chemistry of the Vietnam National University - Hanoi University of Science (VNU-HUS) in Hanoi, Vietnam, the Department of Soil Science at the University of Natural Resources and Life Sciences (BOKU) in Vienna, Austria and the Department of Geography at the University of Vienna, Austria.
One part of the Total Carbon (TC) analyses was conducted at VNU-HUS. Air dried soil samples were first homogenized and manually grounded. The TC content in the solid soil samples was examined by the catalytically aided combustion oxidation at 900°C with the Shimadzu TOC-V<small>CPH</small>
and the Shimadzu Solid Sample Module SSM-5000A.
Further analyses for TC, dissolved organic carbon (DOC), total nitrogen (N<small>tot</small><i>), pH, electrical </i>
conductivity (EC), water extractable anions (WEA), acid extractable cations (AEC) and soil colour were carried out at BOKU. Previous to TC analyses, soil samples were first tested for inorganic C (SIC) components with 10% HCl. Samples were grounded and homogenized with a ball mill (Retsch MM 2000) for 5 minutes. TC and N<small>tot</small> were examined following the Austrian Standard L-1080 (1989) and Austrian Standard L-1095 (2002), respectively, with a Carlo Erba Elementary-Analyser CNS NA1500. The applied method was dry combustion at 1800 °C with a sample weight of 1.5-1.8 mg. Analysis of the pyrolysis gases was done with a GC-TCD system and recorded with Agilent Chemstation 32.
There was no reaction of the soil on the applied 10% HCl test, thus SIC content was negligible which means that TC is equal to OC (Equation 12).
</div><span class="text_page_counter">Trang 23</span><div class="page_container" data-page="23">For the DOC, pH, EC and WEA analyses a water extract in the ratio of 1:10 was produced by filling up the weighted soil sample (3 g) with deionized water to 30 ml and leaving it overnight before shaking with an end-over-end tumbler (GFL 3015 shaker) for one hour. After shaking, samples were gravimetrically filtered through a folded filter paper (Whatmann TM, #40). The suspension was centrifuged and decanted.
DOC in the water extract was determined with a PerkinElmer 2300 EnSpire Multimode Plate Reader by UV absorbance at a wavelength of 245 nm in accordance with Brandstetter et al. (1996). Furthermore, the spectral adsorption coefficient at 400 nm (E<small>4</small>) and 600 nm (E<small>6</small>) was analyzed to characterize the origin of DOC and the degree of humification as the ratio of humic to fulvic acid. A low ratio indicates higher content of humic acid and a higher ratio a higher content of fulvic acid (Canellas & Faỗanha, 2004; Martin-Neto, et al., 1998). The applied method and calculation of the ratio of the extinction (E<small>4</small>/E<small>6</small>) followed the described approach of Schinner et al. (1993).
The soil acidity (pH) as well as electrical conductivity (EC) was determined in the water extract at 25°C with a pH-meter (Mettler Toledo and <small>SevenGo DuoTM SG23</small>) by following Austrian Standard Procedure L-1083 (1989) and with a conductometer (WTW LF 191) by applying Austrian Standard Procedure L-1092 (1993), respectively.
Water extractable anions (Cl, NO<small>3</small>, PO<small>4</small>, and SO<small>4</small>) were analyzed by a liquid ion chromatic system from Metrohm 881 Compact IC pro according to Austrian Standard L-1092 (1993).
Acid extractable cations were analyzed with aqua regia acid digest for nutrients. Using atomic absorption spectroscopy (AAS Perkin Elmer PinAAkle 800T) element (Ca, Mg, K and Na) concentrations were measured. Water extractable anions and acid extractable cations were only spot-checked in this study.
Soil colour was determined with the air dried soil in the laboratory with a standard Munsell soil colour chart according to Austrian Standard L-1071 (2005).
Soil physical analyses were carried out at the University of Vienna. Bulk density for three representative combined soil samples from the first 0-30 cm were simulated in the laboratory by filling up a cylinder (volume: 20 cm<small>3</small>) with the soil and weighing it. After subtracting the weight of the cylinder bulk density was calculated (Equation 13) by:
<i><small>Equation 13: </small></i>
𝐵𝐷 = <sup>𝑚</sup>𝑉
<i><small>BD Bulk Density of the soil sample (g.cm3) m Mass of the soil sample (g) </small></i>
<i><small>V Volume of the cylinder (cm3) </small></i>
In addition, for the three composite samples particle size distribution was analyzed by wet sieving and sedimentation following the approach of Austrian Standard L-1061-2 (2001).
</div><span class="text_page_counter">Trang 24</span><div class="page_container" data-page="24"><b>3.6. Estimation of Carbon Sequestration </b>
The determination of the C sequestration capacity of the six classes was done by calculating C storage in biomass and soil for each plot. C in biomass was simply calculated (Equation 14) by applying a factor of 0.475 (FAO, 2015), since Schlesinger observed that C content in oven dried biomass is between 45 to 50% (Schlesinger, 1991).
<i><small>Equation 14: </small></i>
𝐶<sub>𝐵</sub>= 0.475 𝑥 𝐵
<i><small>CBCarbon (t/ha) B Biomass (t/ha) </small></i>
C storage in soil was calculated for each layer by multiplying the TC content of the layer with the representative bulk density of the class, layer height as well as area (Equation 15) and summed up for one profile (Baldock, 2009; Justine, et al., 2015).
<i><small>Equation 15: </small></i>
𝐶<sub>𝑆𝑡𝑜𝑟𝑎𝑔𝑒 𝑖</sub> = 𝐶<sub>ℎ 𝑖</sub> 𝑥 𝐵𝐷<sub>𝑐𝑙𝑎𝑠𝑠</sub> 𝑥 𝐷<sub>ℎ</sub> 𝑥 𝐴
<i><small>CStorage i Carbon storage in layer i (t/ha) Ch iCarbon Content of layer i (%) BDclass Bulk Density of the class (g/cm3) DhDepth of Layer i (m) </small></i>
<i><small>A Area 1ha (m2) </small></i>
C storage at class level was calculated by adding the mean values of soil C and biomass C together and expressed in tonnes C per hectare (tC/ha). Furthermore, for plantation classes a simple linear regression analysis was conducted between C storage and age of the plantations to apply correction of species-specific influences on the C storage of a certain age since every age is only represented by one species. Results from the regression were used for the total C stock calculation and map. The C stock for one class was calculated by multiplying C storage values derived from the regression with the extent of the class area derived from the satellite analysis (Equation 16).
<i><small>Equation 16: </small></i>
𝐶<sub>𝑠𝑡𝑜𝑐𝑘 𝑖</sub>= (𝐶<sub>𝑆 𝑖</sub>+ 𝐶<sub>𝐵 𝑖</sub>) 𝑥 𝐴<sub>𝑖</sub>
<i><small>Cstock i Carbon stock in Class i (t) </small></i>
<i><small>CS iTotal Carbon in Soil in Class i(t/ha) CB iTotal Carbon in Biomass in Class i (t/ha) Ai Area of Class i (ha) </small></i>
Summing up all C stocks of the classes results in the estimated overall C stock capacity of Hoa Thang.
</div><span class="text_page_counter">Trang 25</span><div class="page_container" data-page="25"><b>3.7. Statistical Analyses </b>
Statistical methods were applied to the data set using SPSS 24 as well as MS Excel. Significance threshold for all tests was at p <0.05. Besides descriptive analyses of variables, the data were tested whether certain conditions for statistical tests are complied with. To test for normal distribution a Kolmogorov-Smirnov and a Shapiro-Wilk test were both applied. A Levene test was used to test variables for homogeneity of variances across groups. Since data violated normal distribution or couldn’t reach homogeneity of variance comparison between groups (classes) were analysed with a non-parametric Kruskal-Wallis test. After differences between groups were significant by analyses of variance, alterations between specific groups were examined with a Post-hoc test of pairwise comparison. For pairwise comparison variances between groups had to reach an adjusted significant level to be meaningful.
Correlation and linear regression models were applied for the relationship between the variables. For regression, outliers were eliminated by hierarchical cluster analyses or by the SPSS unusual cases tool. If the non-normal distribution of data or the assumption of homoscedasticity was not reached data were transformed with square root function to reach conditions for regression analyses. Correlation was applied with a non-parametric Spearmen’s rho for non-normal distributed data.
Applied statistical tests and raw data are presented in the Annex. Boxplots show with the box weight the 1<small>st</small> and 3<small>rd</small> quartile and with the thick middle line the median. Whiskers indicate 1.5 times the interquartile. Error bars in bar plots show the standard error (SE). Values in brackets after results represent the standard error.
</div><span class="text_page_counter">Trang 26</span><div class="page_container" data-page="26"><b>4. Results </b>
<b>4.1. Remote Sensing Analyses </b>
Based on the NDVI calculation of the satellite data analysis of Landsat 5 and 8 images the net forest area (gain and loss) increased by 2,230.92 ha from a total of 8,112.06 ha to 10,342.98 ha in Hoa Thang in the time from 2005 to 2016 (Table 2). Thus, in the 11 years of observation the loss of forest by conversion to non-forest land was 779.59 ha and the gain of forest land was 3,010.52 ha. Overall the forest area increased by 202.81 ha/a.
<i><small>Table 2: Extent of land use areas in Hoa Thang in ha during the examined time range. Plantation extent indicates the change of plantation areas from the previous examined year to the given. </small></i>
<small>(ha) </small>
<small>Forest (ha) </small>
<small>Plantation extent (ha) </small>
<small>Agriculture (ha) </small>
<small>Lake (ha) </small>
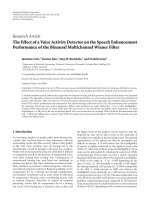
</div><span class="text_page_counter">Trang 27</span><div class="page_container" data-page="27">contribution from plantations. The extent of the plantation areas is used here as a multiplier for the calculation of the C stock in the plantation class (Figure 5). For the natural forest class the forest area excluding plantations is used for C stock calculation. The natural forest area covered 7,749.61 ha in 2016, mainly represented by Rung Nhu and woody shrub land close to the coast and sand dune area.
<b>4.1. Biomass Estimation 4.1.1. Natural Forest </b>
Total biomass for the natural forest class is on average 36.74 t/ha (±9.14) including three plots of conducted forest inventories, whereby one plot in the class has more than double (61.22 t/ha) of the biomass compared to the others (23.67 and 25.13 t/ha). Biomass distribution in the three compartments is 2.45 t/ha (7%) in the litter, 9.78 t/ha (27%) in the belowground and 24.44 t/ha (66%) in the aboveground biomass (Figure 4; Annex: Figure 32). Stem density varies in the plots from 11,000 stem/ha for 1NF to 7,800 stems/ha for 2NF and 4,700 stems/ha for 3NF. Thus, the average stem density is 7,833 stems/ha. The average height is 270 cm and the mean diameter is 4.92 cm. The tree height and diameter do not vary strongly from the average.
<i><small>Figure 4: Biomass distribution in the tree compartments AGB, BGB and Blitter.Am: Acacia </small></i>
<i><small>mangium; Ai: Azadirachta indica; nForest: Natural </small></i>
<i><small>forest. </small></i>
<b>4.1.2. Plantation A. mangium 2yr </b>
<i>In the 2-year-old plantation class – planted with A. mangium trees - total biomass at the single </i>
investigated plot is 20.48 t/ha with 3.22 t/ha (16%) of B<small>litter</small>, 3.30 t/ha (16%) of belowground and 14.03 t/ha (68%) of aboveground biomass (Figure 4, Annex: Figure 33). Stem density is 1,700 stems/ha and average height and diameter are 403 cm and 6.41 cm, respectively.
<small>0102030405060708090</small>
</div><span class="text_page_counter">Trang 28</span><div class="page_container" data-page="28"><i><small>Figure 5: Map of the distribution and extent of the examined classes in Hoa Thang commune.</small></i>
</div><span class="text_page_counter">Trang 29</span><div class="page_container" data-page="29"><b>4.1.3. Plantation A. mangium 5yr </b>
<i>The 5-year-old plantation class with A. mangium trees has a mean total biomass of 71.72 t/ha </i>
(±9.13). The biomass is distributed to 4.85 t/ha (6%) in B<small>litter</small>, 12.50 t/ha (20%) in belowground and 54.35 t/ha (74%) in aboveground biomass (Figure 4, Annex: Figure 34). Average values of height and diameter are 727 cm and 12.85 cm, respectively. Stem density is 1,100 stems/ha.
<b>4.1.4. Plantation A. indica 7yr </b>
<i>Biomass in the plantation 7yr class with A. indica trees is distributed to 5.04 t/ha (6%) to B</i><small>litter</small>, 16.05 t/ha (20%) to belowground and 59.28 t/ha (74%) to aboveground biomass (Figure 4, Annex: Figure 35). Thus, mean total biomass is 80.32 t/ha (±18.65) for this class. Trees in the plantations have an average height and diameter of 540.51 cm and 12.99 cm, respectively by a stem density of 1,100 stem/ha.
<b>4.1.5. Plantation A. indica 10yr </b>
<i>In the plantation 10yr class – planted with A. indica trees – stem density is 800 stem/ha with a </i>
mean height and diameter of 496 cm and 14.89 cm, respectively. B<small>litter</small> had 3.24 t/ha (4%), belowground has 16.24 t/ha (20%) and aboveground biomass has 60.17 t/ha (76%) (Annex: Figure 36). This is a mean total biomass of 79.65 t/ha (±27.47) for the 10-year-old plantation class (Figure 4).
<b>4.2. Soil Analyses 4.2.1. Soil Colour </b>
The appearance of the soil colour in the research area can be separated into three main colour types: red, white and yellow (MARD, 2002). The soil colours for the examined plots are all situated in the principal hue of yellow red (YR). The soil colour at the eastern cluster of plots and the 2NF plot is in the range of 7.5YR 5/4, 5/6, 6/4, 6/6 and 7/6 for the top layers which correspond to light brown, brown, strong brown to reddish yellow colour. At all soil profiles in that cluster soil colour changes with depth into the reddish yellow range and in most cases end up with a value of 7.5YR 7/6 in 60-100 cm horizon. The western cluster of plots appears in a principal hue of 5YR and a value and chroma of 3/4, 4/6 and 5/8. This is equal to a dark reddish brown to yellowish red colour. Also, a shift to the yellowish red colour range with soil depth is present for these plots. At the central cluster in the research area plots are in the 2.5YR 4/6, 4/8 and 5/8 range which correspond to a red soil colour. At these plots value and chroma change with depth and end with the 2.5YR 4/6 value in 60-100 cm depth. The only exception was barren land which has no change in chroma and value with soil depth. Soil colour is influenced by iron oxides and their properties (e.g. crystal size). The iron minerals originate from the parent material. Red soil colour indicates the dominant presence of hematite and yellowish colour goethite. (Schwertmann, 1993)
<b>4.2.2. Particle Size Distribution </b>
Particle size analyses reveal a sand fraction of 93.76, 94.94 and 95.71% for barren land, plantation and natural forest, respectively, with the highest amount in the medium sand section
</div><span class="text_page_counter">Trang 30</span><div class="page_container" data-page="30">(Table 3; Figure 6). The silt fraction accounts for 4.41% in Barren Land, 3.63% in plantation and 2.88% in natural forest of the particle size distribution. The medium and coarse sand fraction increase from barren land (93.75%), to plantation (94.94%) to natural forest (95.71%).
<i><small>Table 3: Particle size distribution of barren land, plantation and natural forest classes following WRB classification scheme (IUSS Working Group WRB, 2015). </small></i>
<small>Particle Size(WRB Class.) </small>
<small>Barren Land (%, n=1) </small>
<small>Plantation (%, n=1) </small>
<i><small>Figure 6: Proportion of particle size distribution in the classes barren land, plantation and natural forest following WRB Classification scheme. nForest: Natural forest </small></i>
<small>0%10%20%30%40%50%60%70%80%90%100%</small>
</div><span class="text_page_counter">Trang 31</span><div class="page_container" data-page="31"><b>Class</b> <sup>Bulk Density</sup><sub>(g/cm</sub><small>3) </small>
<i><small>Figure 7: Bulk density in the three classes: Barren land, plantation and natural forest. </small></i>
<b>4.2.4. Soil pH</b>
<b><small>H2O</small></b>Soil pH<small>H2O</small> is in the range from neutral to moderately acid. Mean soil pH<small>H2O</small> is 6.39 over all classes and depth. Lowest mean values are found in the plantation Am 2yr class with a mean of 5.95 and highest in the plantation Ai 7yr class with 6.49 (Table 5, Figure 8).
<i><small>Table 5: Soil pHH2O min., max. and mean values, standard deviation (SD) and cases (n); Barren: Barren land; Am: A. mangium; Ai: A. indica; nForest: Natural forest. </small></i>
Basically, the pH<small>H2O</small><i> decreases in deeper soil layers in every class. If comparing the profiles with </i>
the same soil colour samples in the eastern and western cluster have almost the same pH<small>H2O</small>
value of 6.47 and 6.31, respectively. The red soil cluster in the central part of the research area has a lower mean value of 6.07 (Annex: Figure 36).
<small>1.41.51.61.71.8</small>
</div><span class="text_page_counter">Trang 32</span><div class="page_container" data-page="32"><i><small>Figure 8: Boxplot of soil pHH2O in the classes: Barren: Barren land; Am: A. mangium; Ai: A. indica; nForest: Natural forest. </small></i>
<i><small>Figure 9: Boxplot of electrical conductivity (EC) in the classes: Barren: Barren land; Am: A. mangium; Ai: A. indica; nForest: Natural forest </small></i>
</div><span class="text_page_counter">Trang 33</span><div class="page_container" data-page="33"><b>4.2.6. Anions </b>
Water extractable anions (Cl, PO<small>4</small>, NO<small>3</small>) were spot-checked over some randomly selected samples. Anion concentration is very low in all tested samples (Table 7; Figure 10). Cl shows a peak in the depth of 40-60 cm in barren land and plantation Ai 7yr class with 56.89 and 61.95 mg/kg, respectively. The highest peak for the natural forest class is in 5-10 cm depth with 39.40 mg/kg. In the surface layer values start at a similar level in all classes between 15.7 and 18.5 mg/kg and increase (barren land and natural forest) with depth or do not change (plantation Ai 7yr). After the peaks, Cl concentration drops to the lowest values in natural forest and plantation 7yr class with 13.10 (60-100 cm) and 9.80 mg/kg (40-60 cm), respectively. Also, in barren land Cl decreases again but remains at a higher level in 60-100 cm as in 0-5 cm.
<i><small>Table 7: Water extractable anions (WEA: Cl, NO3, PO4, SO4) with mean, standard error (SE) and cases (n) in the classes of barren land (Barren), plantation 7-year-old (Ai (7yr)) and natural forest (nForest). </small></i>
Phosphate (PO<small>4</small>) values are in the range of 2.37 and 4.50 mg/kg. In general, PO<small>4 </small>concentration decreases with depth in all classes. There are fluctuations in the top 0-10 cm with PO<small>4 </small>
concentration in barren land and natural forest in the 5-10 cm layer dropping before slightly rising in the 10-20 cm layer and dropping again in the deeper horizons. Plantation Ai 7yr class acts differently by rising in the 5-10 cm layer and decreasing after the peak to the 10-20 cm layer and do not change anymore.
Nitrate concentration in the class barren land and plantation Ai 7yr is on a low level between 7.90 to 3.35 mg/kg. In these classes the concentration does not change between 5.28 to 7.90 mg/kg till the 20-40 cm layer and decreases afterwards to 3.88 (barren land) and 3.35 mg/kg (Ai 7a), respectively. Natural forest NO<small>3</small> concentration in the 0-5 cm layer has 21.70 mg/kg and rises to the 10-20 cm layer to 42.10 mg/kg. In the 20-40 cm layer nitrate concentration decreases (5.05
<b><small>WEA (mg/kg) Class Depth (cm) </small></b>
</div><span class="text_page_counter">Trang 34</span><div class="page_container" data-page="34">mg/kg) to the values of the other classes in this depth (~5.10 mg/kg). Because of the small sample size (mostly 2 cases in each variable) standard error is very high in some cases, e.g. nitrate in the natural forest class 10-20 cm layer with 34.90 mg/kg.
<i><small>Figure 10: Water extractable anions in the three classes of barren land (Barren), plantation 7yr (Ai (7yr)) and natural forest (nForest) in the soil depth of 0-100 cm. Error bars show ±1 times standard error. </small></i>
<b>4.2.7. Cations </b>
Aqua regia extracted cations (Ca, Mg, K, Na) were also spot-checked for certain samples of barren land and natural forest class. Higher concentrations are found over all examined cations in the natural forest class (Table 8; Figure 11). Calcium (Ca) values are in the range of 3.09 and 23.73 mg/kg in 0-5 cm to 2.43 and 10.57 mg/kg in 10-20 cm for barren land and natural forest class, respectively. In barren land class Ca concentration drops further in 10-20 cm to 2.03 mg/kg. Magnesium (Mg) shows similar patterns with values of 24.93 and 116.76 mg/kg in 0-5 cm and decreases to 19.87 and 62.23 mg/kg in 5-10 cm in barren land and natural forest class, respectively. In 10-20 cm soil depth Mg drops to 1.60 mg/kg in barren land.
</div><span class="text_page_counter">Trang 35</span><div class="page_container" data-page="35"><i><small>Table 8: Aqua regia extracted cations (AEC: Ca, Mg, K, Na) with mean, standard error (SE) and cases (n) in the two examined classes of barren land (Barren, 0-20 cm) and natural forest (nForest, 0-10 cm). </small></i>
<i><small>Figure 11: Aqua regia extracted cations (Ca, Mg, Na, K,) in the two examined classes of barren land (Barren, 0-20 cm) and natural forest (nForest, 0-10 cm). </small></i>
</div><span class="text_page_counter">Trang 36</span><div class="page_container" data-page="36">This pattern is also visible in the potassium (K) values where the concentration rises within the first 0-10 cm from 64.38 to 69.61 mg/kg for barren land and 105.74 to 113.42 mg/kg in natural forest. In barren land concentration decreases in the third layer to 51.42 mg/kg.
<b>4.2.8. Total Nitrogen </b>
Mean total nitrogen (N<small>tot</small>) content in the soil ranges between 0.01% in deeper soil layers to 0.09% in the surface layer. Highest mean N<small>tot</small> content can be found in the plantation Am 5yr class (Table 9, Figure 12). Barren land N<small>tot</small> content differs significantly from plantation Am 5yr and Ai 7yr in the surface layer (0-5 cm). This significant difference between barren land and plantation Am 5yr is also visible in the 5-10 cm layer where additionally natural forest differs significantly from barren land (Annex: Table 25). In 10-20 cm, only the plantation Am 5yr class varies from barren land and plantation Am 2yr at a significant level. At soil depth deeper than 20 cm no significant difference between groups occurs.
<i><small>Table 9: Ntot content (%) with mean, standard error (SE) and cases (n) in the classes and with depth. Barren: Barren land; Am: Acacia mangium; Ai: Azadirachta indica; nForest: Natural forest. </small></i>
<b><small>Ntot </small></b><small>(%) Depth (cm) </small>
<i><small>Figure 12: Ntot content (%) in the classes and with depth. Error bars show ±1 times standard error. Barren: Barren land; Am: A. mangium; Ai: A. indica; nForest: Natural forest. </small></i>
</div><span class="text_page_counter">Trang 37</span><div class="page_container" data-page="37">The significant differences in plantation Am 5yr occur in a depth of 20-40 cm to the top layers from 0-10 cm and in plantation Ai 7yr in 10-20 cm to the top layer. In plantation Ai 10yr the top layer significantly differs from the deepest layer of 60-100 cm. In the natural forest class the 5-10 cm layer is significantly different from the layer below 40 cm. In the barren land and plantation Ai 2yr no significant changes are found with depth.
<i><small>Figure 13: Profile of TC content in the examined classes. Barren: Barren land; Am: Acacia mangium; Ai: Azadirachta indica; nForest: Natural forest. </small></i>
The boxplots (Figure 14) show an increase in TC content from barren land to the 5 years-old Am plantation, before dropping down to lower values in the 7 and 10-year-old Ai plantation classes. However, in the natural forest class the TC content rises again to the level of the 5-year-old plantation. This pattern can be seen until depth of 40 cm. Below 40 cm the TC content varies on
</div><span class="text_page_counter">Trang 38</span><div class="page_container" data-page="38">a similar level in all classes, except the plantation Am 2yr class which increases in the 60-100 cm range to 0.51%. However, variance of TC content is especially high in plantation 5yr and natural forest class.
<i><small>Figure 14: Boxplot of soil TC content (%) in the classes and with depth. Barren: Barren land; Am: Acacia </small></i>
<i><small>mangium; Ai: Azadirachta indica; nForest: Natural forest. </small></i>
</div><span class="text_page_counter">Trang 39</span><div class="page_container" data-page="39"><b>4.2.10. C:N Ratio </b>
The C:N ratio varies between 11.53 in the 60-100 cm layer in the plantation Ai 7yr to 41.23 in the plantation Am 2yr class in the 40.60 cm depth range (Table 11, Figure 15). Generally, the C:N ratio stays stable with depth and class, although the standard error increases in deeper layers.
<i><small>Table 11: C:N ratio with mean, standard error (SE) and cases (n) in the classes and with depth. Barren: Barren land; Am: Acacia mangium; Ai: Azadirachta indica; nForest: Natural forest </small></i>
<b><small>C:N </small></b>
<small>Depth(cm) </small>
<small>0-5 19.71 (1.46) 6 18.82 (1.74) 3 21.74 (1.79) 6 16.09 (1.91) 6 22.41 (1.80) 6 20.23 (1.18) 9 5-10 18.59 (2.24) 6 18.41 (1.38) 3 25.02 (0.79) 6 20.22 (2.60) 6 23.42 (1.65) 6 20.82 (1.11) 9 10-20 20.09 (2.25) 6 21.26 (1.80) 3 22.67 (1.34) 6 17.80 (1.74) 6 22.15 (2.50) 6 24.43 (1.56) 9 20-40 16.97 (2.24) 6 20.37 (2.32) 3 24.60 (1.18) 6 13.44 (1.51) 6 21.89 (1.98) 6 25.65 (3.98) 9 40-60 25.71 (5.00) 6 41.23 (21.05) 3 24.28 (3.68) 6 14.85 (2.71) 6 16.98 (2.86) 6 22.74 (4.21) 9 60-100 14.34 (2.82) 6 27.37 (7.50) 3 26.21 (8.63) 6 11.53 (1.29) 6 24.65 (9.24) 6 23.44 (3.04) 7 </small>
The lowest total mean C:N ratio at all depths occurs in the plantation Ai 7yr class with 15.65 followed by barren land with 19.23. Highest values appear in the plantation Am 2yr and Am 5yr classes with 24.58 and 24.09, respectively.
<i><small>Figure 15: C:N ratio in the classes and with depth. Error bars show ±1 times standard error. Barren: Barren land; Am: Acacia </small></i>
<i><small>mangium; Ai: Azadirachta indica; nForest: Natural forest </small></i>
<b>4.2.11. Dissolved Organic Carbon (DOC) </b>
Concentrations of DOC in the soil water solution range from 8.80 mg/l to 35.35 mg/l in plantation Am 2yr and natural forest class, respectively, in the 0-5 cm soil depth range. With forest age DOC concentration increases, but the standard error also rises (Table 12, Figure 16). Significant differences in DOC concentration can be found only between barren land (8.36 mg/l) and plantation Ai 7yr (18.50 mg/l) classes in 5-10 cm depth by a pairwise comparison. In all classes
</div><span class="text_page_counter">Trang 40</span><div class="page_container" data-page="40">DOC concentration decreases until 40 cm soil depth, significantly so in the planation Am 5yr, Ai 7yr and Ai 10yr class (Annex: Table 27).
<i><small>Table 12: DOC concentration with mean, pairwise comparison between classes (p <0.05), standard error (SE) and cases (n) in the classes and with depth. Barren: Barren land; Am: Acacia mangium; Ai: Azadirachta indica; nForest: Natural forest </small></i>
<b><small>DOC </small></b>
<small>(mg/l) </small>
<small>0-5 9.30a (1.94) 6 8.88a (2.51) 3 16.48a (2.71) 6 21.87a (4.20) 6 15.72a (1.12) 6 35.35a (14.89) 9 5-10 7.09a (1.03) 6 10.66a (1.64) 3 15.59a (3.04) 6 18.50a (2.00) 6 14.65a (2.48) 6 31.39a (13.54) 9 10-20 8.36a (1.50) 6 5.07a (0.98) 3 10.74a (1.11) 6 15.93a (3.54) 6 10.72a (1.81) 6 34.73a (17.12) 9 20-40 5.27a,b (1.64) 5 4.02a,b (0.94) 3 6.25a,b (0.58) 6 6.21a,b (0.26) 6 4.67a (0.39) 6 11.04b (1.88) 9 </small>
<small>Note: Values in the same row and subtable not sharing the same subscript are significantly different at p< 0.05 in the two-sided test of equality for column means. Cells with no subscript are not included in the test. Tests assume equal variances.1</small>
<small>1. Tests are adjusted for all pairwise comparisons within a row of each innermost subtable using the Bonferroni correction. </small>
<i><small>Figure 16: DOC concentration in the classes and at different soil depths. Error bars indicate range of ± 1 times standard error. Barren: Barren land; Am: Acacia mangium; Ai: Azadirachta indica; nForest: Natural forest </small></i>
<b>4.2.12. Humic Acid to Fulvic Acid Ratio (E4/E6) </b>
The E4/E6 ratio indicates the degree of humification by comparing the proportion of humic to fulvic acid. The mean E4/E6 ratio is in the range of 3.83 to 8.25. There are no significant differences between groups (Table 13, Figure 17). A rise in the E4/E6 ratio in either the 5-10 cm range or (as in most cases) in the 10-40 cm range exists in all classes. Higher ratios of E4/E6 indicate higher content of aliphatic chains and are related to fulvic acid. Since fulvic acid is more mobile, distribution to deeper horizons is possible. Ratios higher than 5 suggest the presence of fulvic acid. (You, et al., 1999) Only in the plantation Ai 7yr in the 20-40 cm depth range occurs one value of 3.83 and therefore characterized as humic acid (Martin-Neto, et al., 1998). However, results indicate a translocation of fulvic acid into deeper layers.
</div>