Performance dashboards measuring, monitoring, and managing your business, 2nd edition
Bạn đang xem bản rút gọn của tài liệu. Xem và tải ngay bản đầy đủ của tài liệu tại đây (3.45 MB, 339 trang )
<span class="text_page_counter">Trang 1</span><div class="page_container" data-page="1">
PERFORMANCEDASHBOARDS Praise for
WAYNE ECKERSONMEASURING, MONITORING, AND
MANAGING YOUR BUSINESS
P
erformance dashboards have become the preferred way for busy executives, managers, and staff to monitor key business metrics at a glance and move swiftly through layers of actionable information to get the insight they need to solve problems quickly, effi ciently, and effectively.Written by Wayne Eckerson, a recognized expert and consultant in the field of business
<i>intelligence, —Performance Dashboards, Second </i>
<i>Edition shows how performance dashboards </i>
focus business people on the right things to do and arm them with relevant information to do things right. Eckerson’s tips, techniques, and practical insights provide a strategic road map to help organizations turbocharge performance management initiatives with dashboard technology to optimize performance and accelerate results.
Extensively rewritten and modifi ed to refl ect
<i>changes and advances in the fi eld, the Second </i>
<i>Edition now includes: </i>
<small>■</small> All-new case studies that illustrate how to deliver operational, tactical, and strategic performance dashboards
<small>■</small> A chapter on architectural issues and options for creating scalable, high-performance performance dashboards
<small>■</small> Explanation of the MAD framework (monitor, analyze, and drill to detail) for developing performance dashboards and the Double MAD framework (model, analytics, and deliberation) that defi nes next-generation capabilities
<small>■</small> Expanded section on the best practices for managing performance dashboard projects
<small>■</small> New architectural techniques for integrating performance dashboards and cascading performance metrics across tiers of dashboards
<small>■</small> Detailed characteristics of operational, tactical, and strategic dashboards, including prominent subtypes in each category
<small>■</small> A description of dashboard functionality by type of dashboard, including navigational and analytical techniques to enhance usability and effectiveness
<small>■</small> New guidelines for designing effective dashboard displays, including an overview of visualization techniques and how and when they should be used
<small>■</small> New insights into key performance indicators (KPIs) and performance targets, as well as practical tips for brainstorming, designing, and maintaining dashboard metrics
<small>■</small> In-depth examination of the role of
performance dashboards in the BI Maturity Model
Written for IT managers but accessible to business executives, this book will serve as a testimonial to the power of performance dashboards to improve organizational effectiveness as well as a comprehensive source of best practices required to successfully implement dashboards and scorecards. Every executive and manager should have a copy of this bestseller on their bookshelf.
leader and consultant who has covered business intelligence (BI) since 1995. Eckerson has conducted numerous in-depth research studies on BI and is a noted speaker and blogger. He is the author of a popular BI Maturity Model and chair of TDWI’s BI Executive Summit, which educates business and technical executives about best practices and emerging trends in BI and performance management. He is currently director of TDWI Research and can be reached at
<i><small>(continued on back fl ap)</small></i>
<small>4-COLOR GLOSSY </small>
ISBN: 978-0-470-58983-0
“Wayne Eckerson’s book is the preeminent resource on performance dashboards. I am thrilled that Wayne has shared his vast experience in performance management and dashboards with the marketplace. He has crafted a comprehensive resource that merges leading-edge, real-world practice with strong foundations—making his book a must-read for anyone interested in performance dashboards.”
<b><small>—Dr. Barbara Wixom, Associate Professor, McIntire School of Commerce, University of Virginia </small></b>
“Wayne Eckerson is the rare breed of author who manages to translate complex topics into
<i>simple business concepts. The latest edition of Performance Dashboards covers fresh trends </i>
and uses cases in the BI world, illustrating the escalating urgency of information deployment. Indeed, Wayne’s book is like the topic it describes: comprehensive and infi nitely useful.”
<b><small>—Jill Dyché, founder, Baseline Consulting; coauthor of </small></b>
<i><b><small>Customer Data Integration: Reaching a Single Version of the Truth</small></b></i>
“Over the past decade, dashboards have had surprising staying power—and have become a
<i>common paradigm for Business Intelligence applications. Wayne’s fi rst edition of Performance </i>
<i>Dashboards provided valuable clarity and a needed context for delivering dashboard-based </i>
<i>business intelligence solutions. The Second Edition raises the bar still higher—with new content </i>
and many excellent case studies—making it required reading for both business users and IT as a means of developing a common understanding and vocabulary for Business Intelligence.”
<b><small>—Howard Dresner, author of </small></b>
<i><b><small>Profi les in Performance: Business Intelligence Journeys and the Roadmap for Change and The Performance Management Revolution: Business Results Through Insight and Action</small></b></i>
“Wayne Eckerson is the internationally renowned expert for performance dashboards—increasingly a key element in modern Business Intelligence systems. This book not only provides a comprehensive and well-structured overview of the concepts behind dashboards but also a lot of practical advice on how to succeed in their implementation. A must-read for everyone that is looking into this topic—both from a technical or a business perspective.”
<b><small>—Dr. Carsten Bange, founder and CEO, Business Application Research Center </small></b>
</div><span class="text_page_counter">Trang 4</span><div class="page_container" data-page="4"><small>Published by John Wiley & Sons, Inc., Hoboken, New Jersey.Published simultaneously in Canada.</small>
<small>No part of this publication may be reproduced, stored in a retrieval system, or transmitted in any form or by any means, electronic, mechanical, photocopying, recording, scanning, or otherwise, except as permitted under Section 107 or 108 of the 1976 United States Copyright Act, without either the prior written permission of the Publisher, or authorization through payment of the appropriate per-copy fee to the Copyright Clearance Center, Inc., 222 Rosewood Drive, Danvers, MA 01923, (978) 750-8400, fax (978) 646-8600, or on the Web at www.copyright.com. Requests to the Publisher for permission should be addressed to the Permissions Department, John Wiley & Sons, Inc., 111 River Street, Hoboken, NJ 07030, (201) 748-6011, fax (201) 748-6008, or online at of Liability/Disclaimer of Warranty: While the publisher and author have used their best efforts in preparing this book, they make no representations or warranties with respect to the accuracy or completeness of the contents of this book and specifi cally disclaim any implied warranties of merchantability or fi tness for a particular purpose. No warranty may be created or extended by sales representatives or written sales materials. The advice and strategies contained herein may not be suitable for your situation. You should consult with a professional where appropriate. Neither the publisher nor author shall be liable for any loss of profi t or any other commercial damages, including but not limited to special, incidental, consequential, or other damages.</small>
<small>For general information on our other products and services or for technical support, please contact our Customer Care Department within the United States at (800) 762-2974, outside the United States at (317) 572-3993 or fax (317) 572-4002.Wiley also publishes its books in a variety of electronic formats. Some content that appears in print may not be available in electronic books. For more information about Wiley products, visit our web site at www.wiley.com.</small>
<i><b><small>Library of Congress Cataloging-in-Publication Data:</small></b></i>
</div><span class="text_page_counter">Trang 7</span><div class="page_container" data-page="7">DASHBOARDS 1
</div><span class="text_page_counter">Trang 8</span><div class="page_container" data-page="8"><b>PART III </b> CRITICAL SUCCESS FACTORS:
</div><span class="text_page_counter">Trang 9</span><div class="page_container" data-page="9">trying to use information through technology to optimize our nesses and make our lives easier. So why have so many businesses failed and why do most organizations continue to struggle to fi nd that “ competi-tive advantage ” that will take them to the next level? If you are interested in fi nding a sustainable solution that will help you look forward to where your business should be heading versus only looking backward at where you have been, you need to look through Wayne ’ s “ Organization Magnifying Glass ” to help you focus on the future.
Whether you are just starting your career or have been in this industry
journey and offer you many techniques that Wayne has gleaned for some of the best practitioners in the fi eld on delivering real and sustainable value from your information. I have sold to, consulted with, and provided educa-tion to hundreds of organizations over the past 25 years and almost all of them struggled with putting all of the pieces of this puzzle together. As we move into the next decade and try to fi nd our way in this new economy,
Businesses are facing a new global economic environment. If our nesses are to survive, we must fi gure it out quickly.
Wayne ’ s approach and ideas to get the entire organization — both
management make this a must - have survival guide for your business.
at a minimum, read Chapter 1 and Chapter 5 , proactively commit to being an “ agent of organizational change, ” set a clear direction, and give a copy of this book to all of your team members.
Chapters 1 and 5 , ask your executive sponsors to read them, and work on developing a real partnership across your organization.
</div><span class="text_page_counter">Trang 10</span><div class="page_container" data-page="10">
will serve you well as a best practice guide to designing and delivering actionable analytic solutions and will greatly increase your personal market value.
This book will help you put the pieces of the puzzle together with an organized and systematic strategy that will position you to take full advan-tage of whatever opportunities lie ahead.
Paul Kautza Director of Education The Data Warehousing Institute
</div><span class="text_page_counter">Trang 11</span><div class="page_container" data-page="11"><b> New and Different </b>
A lot has changed since I wrote the original manuscript for this book in 2004. The book hit a sweet spot in a rapidly changing industry. Many
were selling to them — that dashboards resonated with users and were a perfect way to deliver information to the masses. People snapped up the fi rst edition and used it — much to my surprise — as a conceptual manual for how to implement a performance dashboard. Although I strove to add as much prescriptive advice as I could based on many conversations with practitioners in the fi eld, I didn ’ t have a methodology in mind when I wrote the book.
several years to write a second edition or sequel. Work and personal mitments prevented me from acceding to his requests. But I fi nally relented in 2009. Only after I signed the contract and started outlining changes did I realize how much work I had taken on. So much had changed in the intervening fi ve years that I realized I would basically have to rewrite large swaths of the book.
Thankfully, the framework that I outlined in Chapter 1 has stood the test of the time and remains basically intact. The only major change is that I have given the framework a name. It ’ s now known as the MAD frame-work, which stands for Monitor, Analyze, and Drill to Detail. The name is a conglomeration of two of the “ three threes, ” which describe the promi-nent characteristics of a bona fi de performance dashboard.
However, almost everything else has changed or advanced. While I
joined by a host of other folks, many more intelligent and informed than I am. I have leaned on them heavily, and sometimes shamelessly, to produce this second edition.
First, I ’ ve replaced the featured case studies in Part II with new ones. And instead of one case study per chapter and type of dashboard, I profi led two. There is so much variation among performance dashboards that I felt
</div><span class="text_page_counter">Trang 12</span><div class="page_container" data-page="12">it important to cast as wide a net as possible when examining actual
defi ned “ detect and respond ” and “ incent and motivate ” operational boards. I also defi ned a new type of tactical dashboard that I call a “ mashboard, ” which enables power users to create ad hoc dashboards from predefi ned report elements created with a vendor ’ s business intelligence (BI) tool. I ’ ve also defi ned a new type of strategic dashboard that features many characteristics of a Balanced Scorecard but isn ’ t one.
In Part I , I combined the chapters on business intelligence and mance management, since this is background information that most readers are familiar with. I rewrote much of the chapter on technical readiness, which delves in my BI Maturity Model. The new chapter offers a more comprehensive and logical handling of the subject. I also moved the chapter “ How to Align Business and IT, ” which proved to be one of the most popular chapters in the book, to the anchor position in Part I .
13 , “ How to Architect a Performance Dashboard, ” which discusses how to engineer the front - end interface for optimal performance and examines the pros and cons of eight architectural options. The chapters “ How to Create Effective Performance Metrics ” and “ How to Design Effective Dashboard Displays ” are almost entirely new, and I ’ m confi dent they offer practical advice for newcomers and veterans alike.
<b> Sections in the Book </b>
Performance Dashboards, ” provides the framework and context for
dashboards and describes their primary characteristics. Chapter 2 provides background on business performance management (BPM) and business intelligence and how they factor into the design and creation of perfor-
assessment for organizations preparing to implement a performance board, and Chapter 4 offers a technical readiness assessment based on a BI Maturity Model that I developed in 2004 and which has been well
tackles the thorny topic of how to establish an effective partnership between business and the information technology (IT) department, which is required to deliver a long - lasting, high - value dashboard system.
Part II , entitled “ Performance Dashboards in Action, ” adds fl esh to the conceptual framework defi ned in Part I by examining six case studies in depth, two for each type of performance dashboard. Chapter 6 compares
</div><span class="text_page_counter">Trang 13</span><div class="page_container" data-page="13">the three types of performance dashboards and explains the major teristics of each in detail. Chapter 7 examines operational dashboards at 1 - 800 CONTACTS and the Richmond Police Department. Chapter 8 looks at tactical dashboards at Rohm and Haas and Arizona State University. Chapter 9 examines strategic dashboards at Cisco and the Ministry of Works in the Kingdom of Bahrain.
Part III is titled “ Critical Success Factors: Tips from the Trenches. ” This section synthesizes recommendations and guidance from dozens of perfor-mance dashboard projects that I ’ ve researched. Chapter 10 discusses how to launch and manage a performance dashboard project. Chapter 11 exam-ines the anatomy of performance metrics and examines various methods for creating effective ones. Chapter 12 shows how to create powerful dash-board screens that communicate relevant facts quickly and concisely. Chapter 13 provides an overview of how to architect a performance dash-
Chapter 14 describes where to start a performance dashboard initiative and how to integrate multiple dashboards. Chapter 15 provides advice on how to ensure end - user adoption and use a performance dashboard to drive positive organizational change.
Finally, I recognize that it is diffi cult to examine dashboard screenshots when they are printed in black and white. Thus, I ’ ve created a Web site where you can view the color versions of all the dashboard screenshots. The Web site is www.bileader.com . It also contains links to other reports, articles, and blogs that I have written, among other resources.
<b> Acknowledgments </b>
This second edition wouldn ’ t be possible without the contributions of many people. I ’ d like to thank the many practitioners who offered their stories for inclusion in this edition, especially David Hsiao, Nanzin Shroff, and Jason Sidhu from Cisco, Mike Masciandaro of Rohm and Haas, John Rome of Arizona State University, Mark Ranford of the Kingdom of Bahrain, Jim Hill and John Williams of 1 - 800 CONTACTS, Stephen Hollifi eld of the Richmond Police Department, Dongyan Wang of NetApp, and Angela Chen at LiquidNet. Industry experts who contributed to this edition include Stephen Few, whose books and conversations shaped the chapter of designing dashboard displays; Bill Barberg, who again provide incomparable perspective on strategy management and the Balanced Scorecard methodology; and Stephen Few, who painstakingly reviewed my chapter on design and whose ideas and books proved a major source of information. I ’ d also like to thank Doug Cogswell, Andreas Lipphardt, and David Parmenter, who contributed ideas or screenshots to the book.
</div><span class="text_page_counter">Trang 14</span><div class="page_container" data-page="14">I ’ d like to thank the following people who reviewed sections of the book and provided invaluable advice: Neal Williams, Mardell Cheney, Justin Manes, Douglas Chope, Mark LaRow, Brad Peters, Kevin Scott, Mark
indebted to David Washo of Ingenium Consulting, who offered to review the book and was probably surprised when I took him up on the offer and sent him countless chapters, which he diligently read and provided welcome feedback.
Last but not least, I ’ d like to thank my wife and children, who once again patiently endured my long days, nights, and weekends hunched over my laptop writing about things they don ’ t understand, nor want to!
</div><span class="text_page_counter">Trang 15</span><div class="page_container" data-page="15"><b> A Path to Pursue False Starts </b>
<b> Business Performance Management. The original focus of this book was </b>
business performance management (BPM). Tim Burgard, my editor at John Wiley & Sons, had read an in - depth report that I wrote on the topic in 2003 and asked whether I would be interested in turning it into a book geared to business professionals. Other than the normal reservations one might have about undertaking a book project in addition to a full - time job, I was not particularly thrilled about exploring BPM in greater depth.
My initial research showed that BPM meant different things to different people. It was a broad, catch - all category of applications and technologies, including everything from fi nancial consolidation and reporting tools to planning, budgeting, and forecasting applications to dashboards and score-cards, among other things. BPM seemed to refl ect whatever vendors had in their product portfolios at the time rather than representing a distinct and compelling discipline in itself.
Conceptually, however, most people seem to agree that the purpose of BPM is to focus organizations on things that really matter. Too many organizations spread their energies and resources far and wide and conse-quently never make much progress toward achieving their strategic objectives. The theory behind BPM is that organizations need to identify the key activities that contribute most to their success and make sure they do them well. In short, the purpose of BPM is to help organizations become more focused, aligned, and effective.
<b> Dashboards and Scorecards. Thus, in the spirit of BPM, I decided </b>
to cast off BPM as a book topic and focus on something more tangible and concrete that organizations could use to implement the discipline of BPM. At the time, I did not know any companies that had implemented a BPM solution — whatever that might be — but I did notice that many com-panies were rolling out dashboards and scorecards. These applications seemed to resonate with workers up and down the organizational hierar-chy, from boardrooms to shop fl oors and from customers and suppliers.
</div><span class="text_page_counter">Trang 16</span><div class="page_container" data-page="16">Better yet, dashboards and scorecards helped companies implement the principles of BPM better than any of the other so - called BPM applications or technologies that I saw in the marketplace. Now here was a topic worth exploring!
As I investigated dashboards and scorecards, I encountered much of the same defi nitional fuzziness as I did with BPM, albeit on a smaller scale. Every “ dashboard ” I saw looked and functioned differently and served dif-ferent purposes. Some looked like reporting portals or electronic briefi ng books, while others contained mostly text and hand - entered data, and still others featured graphical dials and meters that fl ickered with real - time data. The only clarity in the fi eld came from the Balanced Scorecard com-munity, which had a powerful and evolving methodology to help organizations create, display, and manage performance data. However, since there were already many excellent books about Balanced Scorecards that covered both theory and practice, I did not see how I could add much value to the topic.
Nevertheless, I knew that organizations were putting a great deal of energy into building dashboards and scorecards using business intelligence
been researching and speaking about for the past 15 years. I fi gured that I could add value by identifying the common threads among these initia-tives, create a framework to clarify the discussion about their use, and synthesize best practices for designing, building, and growing these systems from organizations that have already done it. The result is this book.
<b> The Puzzle of Performance Dashboards </b>
<b> Defi ning Performance Dashboards. It took many hours of thought, </b>
dozens of interviews, and thousands of words to piece together the puzzle of dashboards and scorecards in a way that provides a clear and complete picture without distorting current perceptions that people have about these systems. In highly abridged form, what I came up with is this: Dashboards
measure, monitor, and manage business performance more effectively. A performance dashboard is more than just a screen with fancy per-
that is built on a business intelligence and data integration infrastructure. A performance dashboard is very different from plain dashboards or score-cards. The latter are simply visual display mechanisms to deliver performance information in a user - friendly way whereas performance dashboards knit together the data, applications, and rules that drive what users see on their screens.
</div><span class="text_page_counter">Trang 17</span><div class="page_container" data-page="17"><b> Three Applications. To fl esh out this skeletal defi nition a tad more, I </b>
came to realize that a performance dashboard is actually three applications in one, woven together in a seamless fashion: (1) a monitoring application, (2) an analysis application, and (3) a management application.
The monitoring application conveys critical information at a glance using timely and relevant data, usually with graphical elements; the analysis application lets users analyze and explore performance data across multiple dimensions and at different levels of detail to get at the root cause of problems and issues; the management application fosters communication among executives, managers, and staff and gives executives continuous feedback across a range of critical activities, enabling them to “ steer ” their organizations in the right direction.
<b> Three Layers. When I looked at the data that performance dashboards </b>
display, I discovered that it let users navigate through three layers or views of information: (1) a graphical metrics view, (2) a multidimensional view, and (3) a detailed or operational view. Users can access the performance dashboard at any of these layers, but most start at the graphical metrics view and drill down along fairly pre - defi ned pathways through the multi-dimensional and detailed views.
This layered approach meets the information and analysis needs of a majority of individuals in an organization who are not number crunchers by training and only want to use information as a tool to perform their jobs. Performance dashboards conform to the natural sequence in which these users want to interact with information. First, they want to monitor key metrics for exceptions; then, they want to explore and analyze infor-mation that sheds light on the exceptions and reveals hidden trends and issues; and fi nally, they want to examine detailed data and reports to iden-tify root causes of problems and take action to remedy the situation.
<b> New Face of BI. What I discovered in my journey is that performance </b>
dashboards are the new face of BI. They transform BI from a set of tools used primarily by business analysts and power users to a means of deliver-ing actionable information to everyone in an enterprise. Thus, performance dashboards fulfi ll the promise of BI to help organizations leverage informa-tion to increase corporate agility, optimize performance, and achieve strategic objectives.
<b> Three Types. The fi nal thing I discovered about performance </b>
strategic — that are distinguished largely by the degree to which they use the three types of applications listed above (i.e., monitoring, analysis, and management).
Operational dashboards track core operational processes and size monitoring more than analysis or management; tactical dashboards track departmental processes and projects and emphasize analysis more
</div><span class="text_page_counter">Trang 18</span><div class="page_container" data-page="18">empha-than monitoring or management; and strategic dashboards monitor the execution of strategic objectives and emphasize management more than monitoring or analysis. An organization can and should have multiple ver-sions of each type of performance dashboard, but they should integrate them using consistent metric defi nitions, shared data, and a common infrastructure.
<b> Success Factors . It is one thing to know what a performance </b>
dash-board is and another to implement one successfully. In the course of interviewing people at organizations that have deployed performance dash-boards (regardless of what they call them), I discovered many critical success factors. On a macro level, the keys to success are: (1) get proper sponsorship and resources for the project, (2) create the right metrics and standardize their meaning, (3) design a compelling graphical user interface, and (4) plan ahead to ensure end - user adoption and drive organizational change.
Beyond these major success factors, I discovered dozens of tips and techniques that often spell the difference between a successful project and
methodology for implementing a performance dashboard or a sive list of critical success factors; instead, like a good performance metric, it provides reasonable guidance for the road ahead.
<b> Who Should Read This Book </b>
This book is geared to business and technical managers who oversee formance management projects or who have been recently appointed to
including information systems and corporate policies and procedures. These managers generally have deep knowledge of their business and suitable experience managing information technology projects. Most are prime candidates to become Chief Performance Offi cers.
At the same time, business executives can benefi t by reading this book. Although it covers the technical underpinnings of performance management and dives into project management and technical details at points, the book tries to convey all concepts in plain English. Conversely, technologists will fi nd value in this book because it provides an overview of performance management concepts and a technical framework for implementing them. In addition, Balanced Scorecard professionals will fi nd the book helps them understand how Balanced Scorecards relate to and can be integrated with other types of performance dashboards in their organizations.
<b> Skim, Drill, and Examine. To help you get the most out of the next </b>
</div><span class="text_page_counter">Trang 19</span><div class="page_container" data-page="19">I know that businesspeople are busy. If you are like me, you rarely get to read an article or report from beginning to end, let alone a book. You really just want the prescriptions, the key takeaways that you can apply at work tomorrow, next week, or next month.
To accommodate your needs, I have tried to make the book as easy
example, I have made liberal use of headings, lead - ins, exhibits, captions, and sidebars so they serve as visual guideposts to the content. Glance at these markers as you fl ip through the pages, and if you spy something that catches your interest, drill down and read the text for a while. (Does this sound like a performance dashboard in book form? I hope so. That was my intent!)
<b> Feedback Please! As someone who works for an educational </b>
organi-zation, I know that the best learning occurs not in classrooms but in discussions with peers and colleagues. Once you fi nish reading (or skim-ming) this book, I hope that you take the time to send me your thoughts. Ideas do not stop evolving once they are put on paper. This book is not my fi nal word on the subject; there is always more to learn! Undoubtedly, there are numerous perspectives I did not cover and nuances I overlooked. Please help me write the next edition; send your thoughts to . Happy reading!
</div><span class="text_page_counter">Trang 21</span><div class="page_container" data-page="21"><b>The Landscape for </b>
<b>Performance Dashboards </b>
dashboards, including the “ three threes. ” Chapter 2 provides background on the disciplines of performance management and business intelligence, which intersect in the form of a performance dashboard. Chapters 3 and 4 help you evaluate the organizational and technical readiness of your
describes my BI Maturity Model, which shows how organizations evolve their BI environment, including performance dashboards. Chapter 5 zeroes in on the key to the success of any BI application, which is a strong partnership between business and the information technology (IT) department.
</div><span class="text_page_counter">Trang 23</span><div class="page_container" data-page="23"><b> Executives in Training. In the summer of 2004, I found my 11 - year - old </b>
son, Henry, and his best pal, Jake, kneeling side by side in our driveway, peering intensely at the pavement. As I walked over to inspect this curious sight, I saw little puffs of smoke rising from their huddle. Each had a mag-nifying glass and was using it to set fi re to clumps of dry grass as well as a few unfortunate ants that had wandered into their makeshift science experiment.
In this boyhood rite of passage, Henry and Jake learned an important lesson that escapes the attention of many organizations today: the power of focus. Light rays normally radiate harmlessly in all directions, bouncing off objects in the atmosphere and the earth ’ s surface. The boys had dis-covered, however, that if they focused light rays onto a single point using a magnifying glass, they could generate enough energy to burn just about anything and keep themselves entertained for hours.
By the time Henry and Jake enter the business world (if they do), they will probably have forgotten this simple lesson. They will have become steeped in corporate cultures that excel at losing focus and dissipating energy far and wide. Most organizations have multiple business units, divisions, and departments, each with its own products, strategies, pro-cesses, applications, and systems to support it. A good portion of these activities are redundant at best and confl icting at worst. The organization as a whole spins off in multiple directions at once without a clear strategy. Changes in leadership, mergers, acquisitions, and reorganizations amplify the chaos.
</div><span class="text_page_counter">Trang 24</span><div class="page_container" data-page="24"><b> Organizational Magnifying Glass. To rectify this problem, </b>
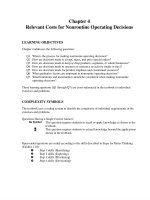
compa-nies need an “ organizational magnifying glass ” — something that focuses the work of employees so everyone moves in the same direction. (See Exhibit 1.1 .) Strong leaders do this. However, even the voice of a charismatic executive sometimes is drowned out by organizational inertia.
Strong leaders need more than just the force of their personality and experience to focus an organization. They need an information system that helps them clearly and concisely communicate key strategies and goals to all employees on a personal basis every day. The system should focus workers on tasks and activities that best advance the organization ’ s strate-gies and goals. It should measure performance, reward positive contributions, and align efforts so that workers in every group and level of the organiza-tion are marching together toward the same destination.
<b> Performance Dashboard. In short, what organizations really need is </b>
objectives, metrics, initiatives, and tasks customized to each group and individual in the organization. It provides timely information and insights that enable business users to improve decisions, optimize processes and plans, and work proactively. A performance dashboard is really a perfor-mance management system. It communicates strategic objectives and enables businesspeople to measure, monitor, and manage the key activities and processes needed to achieve their goals.
<b><small> EXHIBIT 1.1 Organizational Magnifying Glass </small></b>
<small>Companies need an “organizational magnifying glass” that focuses the energies and activities of employees on a clear, unambiguous set of goals and objectives laid out in the corporate strategy. </small>
</div><span class="text_page_counter">Trang 25</span><div class="page_container" data-page="25">To work this magic, a performance dashboard provides three main sets of functionality, which I will describe in more detail later. Briefl y, a per-formance dashboard lets businesspeople:
<b> 1. Monitor critical business processes and activities using metrics that </b>
trigger alerts when performance falls below predefi ned targets.
<b> 2. Analyze the root cause of problems by exploring relevant and timely </b>
information from multiple perspectives at various levels of detail.
<b> 3. Manage people and processes to improve decisions, optimize </b>
perfor-mance, and steer the organization in the right direction.
<b> Agent of Organizational Change </b>
A performance dashboard is a powerful agent of organizational change. When deployed properly, it can transform an underperforming organization
focus people and teams on the key things they need to do to succeed. It provides executives, managers, and workers timely and relevant informa-tion so they can measure, monitor, and manage their progress toward achieving key strategic objectives.
One of the more popular types of performance dashboards today is the balanced scorecard, which adheres to a specifi c methodology for monitor-ing and managing the execution of business strategy. A balanced scorecard is a strategic application, but, as we shall soon see, there are other types of performance dashboards that optimize operational and tactical processes that drive organizations on a weekly, daily, or even hourly basis.
<b> Historical Context. Although dashboards have long been a fi xture in </b>
automobiles and other vehicles, business, government, and nonprofi t nizations have only recently adopted the concept. The trend started among executives who became enamored with the idea of having an “ executive
from their boardroom perches. These executive information systems (EISs) actually date back to the 1980s, but they never gained much traction because the systems were geared to so few people in each company and were built on mainframes or minicomputers that made them costly to cus-tomize and maintain.
In the past 20 years, information technology has advanced at a rapid clip. Mainframes and minicomputers gave way in the 1990s to client/server systems, which in turn were supplanted by the Web this decade as the preferred platform for running applications and delivering information. Along the way, the economy turned global, squeezing revenues and profi ts and increasing competition for more demanding customers. Executives have responded by reengineering processes, improving quality, and cutting costs, but these efforts have provided only short - term relief, not lasting value.
</div><span class="text_page_counter">Trang 26</span><div class="page_container" data-page="26"><b> Two Disciplines. During the 1990s, organizations began </b>
experiment-ing with ways to give business users direct and timely access to integrated information, an emerging fi eld known as business intelligence (BI). At the same time, executives began turning to new techniques and methods to manage strategy and optimize performance, a discipline broadly defi ned as business performance management (BPM), or just performance manage-ment. (See Chapter 2 for background on BI and BPM.) Many organizations began using BI to provide the technical scaffolding to deliver information for performance management initiatives. Starting in 2000, it became clear that BI was converging with performance management to create the “ per-formance dashboard. ”
This convergence created a fl ood of interest in performance boards. A study by The Data Warehousing Institute (TDWI) in 2004 showed that a majority of organizations (51 percent) were already using a dashboard or scorecard. The same study showed that almost one - third of organizations
<i>dash-were using it as their primary application for reporting and analysis. The </i>
popularity of performance dashboards has continued to surge. In 2009, TDWI repeated the survey and found that almost three - quarters (72 percent) of organizations have deployed a performance dashboard. (See Exhibit 1.2 .)
<b> Benefi ts. The reason so many organizations are implementing </b>
perfor-mance dashboards is a practical one: They offer a panoply of benefi ts to everyone in an organization, from executives to managers to staff. Here is a condensed list of benefi ts:
<b><small> EXHIBIT 1.2 Has Your Organization Implemented a Performance Dashboard?</small></b>
<i><small> Source : TDWI Research.</small></i><small> 51%</small>
<small>Under developmento</small>
<small>Based on 437 and 495 respondents respectively.</small>
</div><span class="text_page_counter">Trang 27</span><div class="page_container" data-page="27">
strategy into measures, targets, and initiatives that are customized to each group in an organization and sometimes to every individual. Each morning when businesspeople log into the performance dashboard, they get a clear picture of the organization ’ s strategic objectives and what they need to do in their areas to achieve the goals.
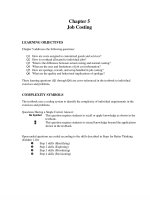
steer-ing wheel to fi ne - tune corporate strategy as they go along. Instead of veering drastically from one direction to another in response to internal issues or industry events, executives can use performance dashboards to make a series of minor course corrections along the way to their destination. (See Exhibit 1.3 .)
managers greater visibility into daily operations and future performance by collecting relevant data in a timely fashion and forecasting trends based on past activity. This helps companies avoid being surprised by unforeseen problems that might affect bottom - line results.
performance dashboards encourage staff from different departments to work more closely together, and they foster dialogue between manag-ers and staff about how to improve performance.
results, performance dashboards engender friendly competition among peer groups, improving motivation and productivity. Perfor-mance dashboards impel people to work harder out of pride and
<b><small> EXHIBIT 1.3 Charting a Course </small></b>
<b><small>Direction with a Performance DashboardDirection without a Performance Dashboard</small></b>
<small>Goal </small>
<small>A performance dashboard enables executives to chart a steady course to their destination by making a series of fine-tuned course corrections instead of veering dramatically from one direction to another in response to internal or industry events. </small>
</div><span class="text_page_counter">Trang 28</span><div class="page_container" data-page="28">desire for extra pay when compensation is tied to performance results.
consoli-date and integrate corporate information using common defi nitions, rules, and metrics. This creates a single version of business information that everyone in the organization uses, avoiding confl icts among man-agers and analysts about whose version of the data is “ right. ”
information, performance dashboards eliminate the need for redundant silos of information that undermine a single version of business infor-mation. A single performance dashboard can help an organization shut down dozens, if not hundreds, of independent reporting systems, spreadmarts, data marts, and data warehouses.
them self - service access to information and eliminating their reliance on the information technology (IT) department to create custom reports. Through layered delivery of information, structured navigation paths, and guided analysis, performance dashboards make it easy for average businesspeople to access, analyze, and act on information.
users take action to fi x a problem, help a customer, or capitalize on a new opportunity before it is too late. A performance dashboard prevents users from wasting hours or days searching for the right information or report.
When we asked organizations the degree to which their performance dashboards have had a positive impact on business results, almost half (48 percent) responded either “ very high ” or “ high. ” Another 42 percent said the impact has been “ moderate ” and only 11 percent said “ low ” or “ very low. ” Thus, performance dashboards are not only pervasive; they are effec-tive. (See Exhibit 1.4 .)
In short, performance dashboards deliver the right information to the right users at the right time to optimize decisions, enhance effi ciency, and accelerate bottom - line results.
<b> Pretenders to the Throne </b>
Although many organizations have implemented dashboards and cards, not all have succeeded. In most cases, organizations have been tantalized by glitzy graphical interfaces and have failed to build a solid foundation by applying sound performance management principles and implementing appropriate business intelligence and data integration tech-
</div><span class="text_page_counter">Trang 29</span><div class="page_container" data-page="29">score-nologies and processes. Here are the common symptoms of less than successful solutions:
<b> Too fl at. Many organizations create performance management systems, </b>
especially tactical and strategic dashboards, using Microsoft Excel, Microsoft PowerPoint, and advanced charting packages. Although these applications often look fancy, they generally do not provide enough data or analytical capabilities to let users explore the root cause of problems highlighted in the graphical indicators.
<b> Too manual. In addition, some organizations rely too heavily on </b>
manual methods to update performance dashboards that contain sizable amounts of information. Highly skilled business analysts spend several days a week collecting and massaging this informa-tion instead of analyzing it. The best performance dashboards automate the collection and delivery of information, ensuring a sustainable solution over the long term.
<b> Too isolated. Some performance dashboards source data from a single </b>
system or appeal to a very small audience. As a result, they provide a narrow or parochial view of the business, not an enterprise view. In addition, these dashboards often contain data and metrics that do not align with the rest of the organization, leading to confusion and chaos.
<b><small> EXHIBIT 1.4 To What Degree Has Your Dashboard Had a Positive Impact on </small></b>
</div><span class="text_page_counter">Trang 30</span><div class="page_container" data-page="30">In the end, performance dashboards are only as effective as the organizations they seek to measure. Organizations without central control or coordination will deploy a haphazard jumble of nonintegrated perfor-mance dashboards. However, organizations that have a clear strategy, a metrics - driven culture, and a strong information infrastructure can deliver perfor mance management systems that make a dramatic impact on performance.
<b> Composition of Performance Dashboards </b>
<b> Layered Delivery System. Every performance dashboard looks and </b>
func-tions differently. People use many different terms to describe performance dashboards, including portal, BI tool, and analytical application. Each of these contributes to a performance dashboard but is not a performance dashboard by itself. Here is my defi nition:
<i> A performance dashboard is a layered information delivery system that parcels out information, insights, and alerts to users on demand so they can measure, monitor, and manage business performance more effectively. </i>
This defi nition conveys the idea that a performance dashboard is more than just a screen populated with fancy performance graphics; it is a full - fl edged business information system designed to help organizations optimize performance and achieve strategic objectives. An equivalent, and perhaps
<i>better, term is performance management system , which conveys the idea </i>
that it is a system designed to manage business performance. Since the title
<i>of this book uses the term performance dashboards , I will stick with that </i>
term on most occasions, although I feel that the two are interchangeable.
<b> Three Threes. One of the most salient features of performance </b>
types. The “ three threes ” provide a convenient way to describe the major characteristics of performance dashboards and a litmus test to differentiate imposters from bona fi de performance dashboards.
<b> Three Applications </b>
A performance dashboard weaves together three applications in a seamless fashion. These applications are (1) monitoring, (2) analysis, and (3) man-agement. Each application provides a specifi c set of functionality. The applications are not necessarily distinct programs or code bases but sets of related functionality built on an information infrastructure designed to fulfi ll user requirements to monitor, analyze, and manage performance. (See Exhibit 1.5 .)
</div><span class="text_page_counter">Trang 31</span><div class="page_container" data-page="31"><b> 1. Monitoring. A performance dashboard enables users to monitor </b>
per-formance against metrics aligned with corporate strategy. At an operational level, users monitor core processes that drive the business on a day - to - day basis, such as sales, shipping, or manufacturing. At a strategic level, users monitor their progress toward achieving short - and long - term goals.
<i>processes and scorecards to monitor strategic goals. Dashboards and </i>
scorecards are visual display mechanisms within a performance management system that convey critical performance information at a glance. They are the lens through which users view and interact with performance data, but they are not the entire system in them-selves. Although dashboards and scorecards share many features and people use the terms interchangeably, they have unique characteristics. (See Spotlight 1.1 .)
<b><small> EXHIBIT 1.5 Performance Dashboard Applications </small></b>
<small>at a glance </small>
<small> Analyze exception conditions and drill to detail </small>
<small> Improve alignment, coordination, and collaboration </small>
<b><small> Components </small></b> <small> Dashboard Scorecard BI portal “ Right time ” data Alerts </small>
<small> Agents </small>
<small> Multidimensional analysis </small>
<small> Time - series analysis Reporting </small>
<small> What - if modeling Statistical modeling </small>
<small> Strategy maps Initiative </small>
<small>management Collaboration </small>
<small>annotation Workfl ow Usage monitoring </small>
Spotlight 1.1 Dashboards versus Scorecards
Dashboards and scorecards are visual display mechanisms in a performance management system that graphically communicate performance at a glance. The primary difference between the two is that dashboards monitor the performance of operational pro-cesses whereas scorecards chart progress toward achieving strategic goals. (See Exhibit 1.6 .)
<i><small>(Continued )</small></i>
</div><span class="text_page_counter">Trang 32</span><div class="page_container" data-page="32">A monitoring application also delivers information to users in “ right time ” — within minutes or hours in an operational activity or within days, weeks, or months for a strategic one — so users can take steps to fi x a problem or exploit an opportunity. We cover “ right time ” informa-tion delivery in Chapter 6 .
Other key elements of a monitoring application are alerts, which notify users when events exceed predefi ned thresholds of performance, and agents, which automate the responses to well - known exception conditions, such as ordering new stock when inventory falls below predefi ned levels.
<b> Dashboards. Dashboards are more like automobile </b>
dash-boards. They enable operational specialists and supervisors to monitor and act on events as they occur. Dashboards display detailed data in “ right time ” as users need to view them, usually on a daily or intraday frequency. Dashboards display performance visually, using charts or tables. Interestingly, people who monitor operational processes often fi nd visual glitz or graphics distracting and prefer to view raw data as numbers or text, perhaps accom-panied by visual graphs.
like school report cards — designed to help executives and managers track progress toward achieving goals and review performance with subordinates. Scorecards usually display weekly, monthly, quarterly, or annual snapshots of summary data. Like dashboards, scorecards also make use of charts and visual graphs but include textual commentary that interpret results, forecast the future, and record action items.
In the end, it does not really matter whether you use the term
<i> dashboard or scorecard as long as the tool helps focus users and </i>
organizations on what matters.
<b><small> EXHIBIT 1.6 Dashboards versus Scorecards </small></b>
</div><span class="text_page_counter">Trang 33</span><div class="page_container" data-page="33"><b> 2. Analysis. The analysis application in a performance dashboard enables </b>
users to explore data across many dimensions and organizational hierarchies to ascertain the root cause of an exception condition high-lighted in the monitoring layer. Performance dashboards leverage a variety of technologies to enable this analysis: online analytical process-ing (OLAP), parameterized reporting, ad hoc reporting, visual analysis using in - memory data, and predictive analytics. The analysis requires a data management infrastructure that creates clean, consistent, and integrated data, which is often modeled dimensionally and hierarchi-cally. Chapter 3 describes various types of BI tools and data warehousing (DW) and data integration tools required to support a layered delivery system.
<b> 3. Management. Performance dashboards typically support a variety of </b>
features that foster collaboration and decision making. Many mance dashboards are tailored to support executive meetings that review strategy and/or operations and performance review meetings between a manager and subordinate. The tools let managers quickly create or navigate to a desired page and print the output, if desired. In addition, many performance dashboards let users annotate charts or pages, engaged in threaded discussions, or kick off workfl ows to follow through on action items. These features, for example, enable subordinates to explain performance discrepancies and list action steps and enable executives to review, comment, and approve the action plan. In addition, most dashboards enable IT administrators to
monitoring.)
<b> Three Layers </b>
Besides three applications, a performance dashboard consists of three layers of information. Just as a cook peels layers of an onion, a performance dashboard lets users peel back layers of information to get to the root cause of a problem. Each successive layer provides additional details, views, and perspectives that enable users to understand a problem better and identify the steps they need to take to address it.
<b> Going MAD. This layered approach gives users self - service access to </b>
information and conforms to the natural sequence in which users want to handle that information: (1) monitor, (2) analyze, and (3) drill to detail, or MAD for short. That is, business users want to monitor key metrics for exceptions; then analyze information that sheds light on those exceptions; and, fi nally, drill into detailed reports before taking action. This layered approach helps users get to the root cause of issues quickly and intuitively. (See Exhibit 1.7 .)
</div><span class="text_page_counter">Trang 34</span><div class="page_container" data-page="34">The MAD framework consists of a pyramid divided into three layers. The shape of the pyramid represents both the number of metrics and number of users at each level. Typically, there are about a dozen or so metrics displayed at the top layer, each of which explodes into 10 additional metrics in the middle layer (or dimensional views), each of which then expand into 10 more metrics (or views) at the bottom layer. So a dashboard
increasing levels of granularity.
<b> Information Sandbox. Typically, performance dashboards consist of </b>
about 10 to 12 top - level metrics and 20 dimensions, creating a nice - size information sandbox for a specifi c role, subject area, or activity. This type of sandbox is big enough to provide casual users with 60 percent to 80 percent of the information they need to do their jobs on a regular basis, but not so large that they get lost in the data. Most performance dashboards provide structured navigation or drill paths that guide users from high - level
navigational clues, that show users exactly where they are in the dashboard and how to retrace their steps.
The three layers of information consist of:
<b> 1. Graphical, metrics data. The top layer provides a graphical view of </b>
performance metrics, usually in the form of charts and alerts. This layer is where users monitor information and is essentially a visual exception report. When performance exceeds a threshold, the dash-
message, or animation, or sends a message via e - mail, pager, or another channel.
<b><small> EXHIBIT 1.7 MAD Framework </small></b>
<small>Detailed DataDimensional Data</small>
<small>GraphicalData</small>
</div><span class="text_page_counter">Trang 35</span><div class="page_container" data-page="35"><b> 2. Summarized, dimensional data. The middle layer usually consists </b>
of dimensional data that lets users navigate the data by subject (e.g., customer, geography, or time) and hierarchy (e.g., country, region, or city). Dimensional analysis tools enable users to slice and dice, drill down or up, or pivot data to view exceptions and trends from any
analyses or apply various complex algorithms.
<b> 3. Detailed, transactional data. The bottom layer lets users view </b>
detailed data, such as invoices, shipments, or transactions, stored in data warehouses or operational systems. Users often need such data to understand the root cause of a problem, such as a decline in sales due to missing or incomplete orders or a salesperson who has been sick. Most data in this layer is delivered as reports or lists, which are usually displayed in a separate window.
<b> Users. Users can enter the performance dashboard at any of the </b>
layers and drill up or down. Executives typically start at the top layer, analysts at the middle layer, and workers at the bottom layer. Ideally, the performance dashboard enables users to navigate seamlessly from one layer to the next without shifting application contexts or user interfaces. In the past, developers built performance dashboards by integrating three separate toolsets: portals at the top layer, OLAP in the middle, and reports at the bottom. This created a cumbersome experience for users who were forced to switch application and software contexts when moving from one layer to the next. Today, however, many vendors offer a more seam-less navigational experience, although many stop short of supporting all three layers.
<b> Evolution of BI. Interestingly, the MAD framework also shows the </b>
evolution of BI. In the 1980s, BI was simply the bottom layer or detailed, operational, or management reports. In the 1990s, vendors began offering ad hoc query and multidimensional analysis (i.e., OLAP) tools to provide interactive access to information. Then in the 2000s, vendors began offering monitoring tools (i.e., dashboards and scorecards) to visually manage exception conditions. A performance dashboard simply stitches together all three generations of BI technology in a seamless package.
<b> User Mantra. This layered approach to delivering performance </b>
infor-mation meets the needs of most users in an organization. These so - called casual users simply want to monitor, analyze, and manage the key pro-cesses for which they are responsible and usually check information only a couple of times a week, depending on their role and responsi-
performance dashboards do a great job of adhering to the casual user mantra.
</div><span class="text_page_counter">Trang 36</span><div class="page_container" data-page="36">When you ask casual users what information they need, they typically repeat the mantra (more or less): “ Give me all the data I want, but only what I need, and only when I really need it. ” In other words, casual users do not want to be overwhelmed with too much data on a regular basis — they only want to monitor summary data that is relevant to their jobs. But when a problem occurs, they want to access all data possible to understand its full scope so they can take appropriate action.
<b> Double MAD. The functionality of performance dashboards is evolving </b>
rapidly. Next - generation performance dashboards are subsuming adjacent applications, such as planning, advanced analytics and visualization, and collaboration, to create what I call the “ double MAD ” framework. In this
<i>case, “ M ” stands for m odeling, “ A ” stands for advanced a nalytics, and “ D ” stands for d eliberate and act. (See Exhibit 1.8 .) </i>
In a double MAD performance dashboard, the graphical monitoring layer incorporates what - if modeling capabilities that enable executives and managers to change the value of one metric to see how it impacts perfor-mance of the rest of the metrics displayed in the dashboard. Since performance dashboards provide a snapshot of current performance, what - if modeling delivers a glimpse into future performance. This capability transforms performance dashboards from monitoring environments to plan-ning environments. Most performance dashboards that support this feature today use Adobe Flash to present users with a visual slider to adjust vari-ables, although HTML 5 appears poised to supplant Flash as the preferred
Chapter 13 .)
Next - generation performance dashboards will also provide more advanced analytics in the analysis layer. Today, most offer some sort of drill - down or, in the best case, a full - featured slice - and - dice OLAP environ-
<b><small> EXHIBIT 1.8 Double MAD </small></b>
<small>Detailed DataDimensional Data</small>
<small>GraphicalData</small>
</div><span class="text_page_counter">Trang 37</span><div class="page_container" data-page="37">ment for analyzing dimensional data. But some performance dashboards now incorporate visual analysis capabilities (see Chapters 2 and 6 for more detail) that enable users to visually analyze information held in memory for superfast interactive analysis. Sometimes, these double MAD dash-boards also incorporate regression and other statistical algorithms that enable users to forecast or categorize information. These predictive capa-bilities can help users segment customers, forecast revenues, and optimize processes.
support for collaboration and action - oriented activities. In terms of ration, double - MAD dashboards enable users to annotate charts and tables, engage in collaborative dialogue via threaded discussions, and kick off workfl ow processes when multiple people need to review and/or approve certain actions. These collaboration features probably will be most evident in the graphical layer of the dashboard but should permeate all layers as well. Double - MAD dashboards will also be action - oriented, enabling users to defi ne alerts that trigger actions when performance exceeds a specifi ed
and database updates.
<b> Three Types </b>
The last thing you need to know about performance dashboards is that there are three types: operational, tactical, and strategic. Each type of per-formance dashboard emphasizes to different degrees the three layers and applications previously described. Here is a quick summary of the different types of performance dashboards. (See chapter 6 for more detail.)
<b> 1. Operational dashboards mirror the description of dashboards in </b>
Spotlight 1.1 . They enable front - line workers to manage and control operational processes using detailed data that is refreshed frequently.
<i>Of the three applications, operational dashboards emphasize </i>
<i>monitor-ing more than analysis or management. Chapter 7 profi les operational </i>
Department.
<b> 2. Tactical dashboards monitor and manage departmental processes and </b>
projects. Executives use tactical dashboards to review and benchmark the performance of peer groups across the company, while managers use them to monitor and optimize processes. Tactical dashboards tend to emphasis analysis more than monitoring or management. Chapter 8 profi les tactical dashboards at Rohm and Haas and the University of Arizona.
</div><span class="text_page_counter">Trang 38</span><div class="page_container" data-page="38"><b> 3. Strategic dashboards monitor the execution of strategic objectives </b>
and frequently are implemented using the balanced scorecard odology. Executives use strategic dashboards to communicate strategy and review performance at monthly strategy or operational review meetings. Strategic dashboards tend to emphasis management more than monitoring or analysis. Chapter 9 profi les strategic dashboards at Cisco and the Ministry of Works in the Kingdom of Bahrain.
<b> Integrating Performance Dashboards. Since each type of </b>
perfor-mance dashboard serves a different purpose, most organizations have multiple versions of each type. In fact, most departments have their own operational, tactical, and strategic dashboards. Ideally, all performance dashboards share a common set of metrics and rules and are populated with data from a shared BI and DW infrastructure. In reality, most perfor-mance dashboards are built independently and use unique metrics, rules, tools, and data. Although each performance dashboard provides local value, collectively they create information chaos. Chapter 14 discusses how to deploy and integrate disparate performance dashboards, a challenging endeavor for any organization.
<b> Build or Buy </b>
A common question that people ask is whether it is better to build or buy a performance dashboard. When I wrote the fi rst edition of this book in 2004, all the companies that I profi led had built their own dashboards using custom code. However, during the past several years, many soft-ware vendors have shipped dashboard or scorecard solutions. As a result, more organizations are buying rather than building performance dash-boards. Half of the companies profi led in this edition have built their own dashboards using custom code and half have extended a BI or dash-board tool.
Our 2009 survey shows that 45 percent of companies that have deployed a performance dashboard built it from scratch, 30 percent deployed a dashboard tool without customization, and 19 percent extended a dash-board tool with custom code. So there is a trend toward leveraging vendor products to deliver performance dashboards. (See Exhibit 1.9 .)
<b> Performance Management Architecture </b>
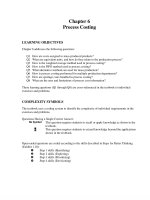
A performance management system consists of a business architecture and a technical architecture. Exhibit 1.10 shows the components of these two architectures and how they relate.
</div><span class="text_page_counter">Trang 39</span><div class="page_container" data-page="39"><b><small> EXHIBIT 1.10 Performance Management Architecture </small></b>
<b><small>EAICustom API</small></b>
<b><small>FilesWeb pagesPackaged Apps</small></b>
<b><small>Memory cache</small></b>
<small>Metrics are the linchpin that connects the business and technical architectures in a performance management system.</small>
<b><small> EXHIBIT 1.9 Build, Buy, or Extend</small></b>
<i><small> Source : TDWI Research, 2009.</small></i><small> </small>
<small>hand; Buy = Purchased a dashboard solution and deployed with minor confi guration </small>
<small>custom coding.</small>
</div><span class="text_page_counter">Trang 40</span><div class="page_container" data-page="40"><b> Metrics. The linchpin that ties the two architectures together is the </b>
metrics that defi ne leading, lagging, and diagnostic measures of business performance. On the business side, the metrics embody the organization ’ s strategy, represented by all the layers in the business architecture. On the technical side, the metrics contain rules that defi ne how to design the performance dashboard, including what data to collect and how to aggre-gate, fi lter, calculate, and display metrics.
Performance metrics are the means by which organizations measure, monitor, and manage the effectiveness of their strategy and tactics to satisfy key stakeholders. They really are the heart and soul of a performance dashboard, and organizations must take great care in deciding what metrics to display and what targets to apply to each metric. Chapter 11 dissects performance metrics and examines how to design effective ones.
<b> Business Architecture. The business architecture consists of </b>
stake-holders, strategy, resources, semantics, and metrics. To succeed, a
audience whose requirements dictate the strategy, resources, and metrics used. Semantics represent the corporate vocabulary, the words and meaning that enable stakeholders and others to communicate clearly and effectively. Semantics often prove to be the biggest stumbling block when launching
and 10 provide tips and techniques for getting buy - in from stakeholders
shows how to use the performance dashboard as an agent of organizational change and ensure adoption by stakeholders.
<b> Technical Architecture. The technical architecture consists of the </b>
components that comprise the performance dashboard. The components in each layer represent a superset of functionality. Developers select one or more components (or buy a dashboard with the requisite combination of functionality) that best serves the needs of the stakeholders. Chapter 2 examines the core components of a BI and a DW infrastructure that often
that infrastructure evolves over time. Chapter 13 describes how to architect a performance dashboard, and Chapter 12 examines how to design effec-tive dashboard screens.
Although this book recommends building performance dashboards on
strategic dashboards, which often measure objectives for which there is no ready source of data to populate the metrics. In these cases, companies will need to manually count and enter data into a spreadsheet or other tool to populate the dashboard displays. (See Spotlight 1.2 .) This is fi ne in the short term but is not usually a sustainable practice.
</div>