group assignment mas202 lo4 utilize common statistical packages to conduct statistical analysis
Bạn đang xem bản rút gọn của tài liệu. Xem và tải ngay bản đầy đủ của tài liệu tại đây (1.78 MB, 19 trang )
<span class="text_page_counter">Trang 1</span><div class="page_container" data-page="1">
<i><b>Group Assignment - MAS202</b></i>
<i><b>LO4: Utilize common statistical packages to conduct statistical analysis</b></i><b>Group 2:</b>
<b>Nguyễn Thị Quỳnh Anh - HS171205Hồ Thị Phương Thảo- HS171216Nguyễn Minh Anh- HS170963Đinh Quốc Bình- HS173058Lưu Vũ Trường Giang - HS170866</b>
<b>Lecturers: Pham Thanh Hieu</b>
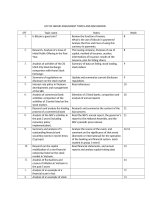
</div><span class="text_page_counter">Trang 2</span><div class="page_container" data-page="2">f. The samples and the sampling method.g. The data.
h. The survey errors.
<b>II.Part II: Descriptive Statistics Results</b>
a. The demographics information.b. The choice of graphs.
c. The maximum number of graphs.
<b>PART B: Inferential Statistics.I.Part 1 :</b>
a. Research topic.b. Research purpose.
c. Summary of your descriptive statistics
<b>II.Part 2 :</b>
a. Confidence interval.b. Hypothesis testingc. Linear regression
<b>PART C: Reference</b>
</div><span class="text_page_counter">Trang 3</span><div class="page_container" data-page="3"><b>Part A:</b>
<b>Part I: Introduction & Methodology</b>
a. What is the topic of your project? (1 short sentence)
- Statistics on average spending of current students.
b. What are the main issues you plan to address? What questions do you have about yourproject? (1 to 3 sentences)
The main issues intended to be addressed are:
+ Statistics and calculation of the average online shopping amount of students, toconclude.
+ Finally, use a linear regression problem to show how the relationship between theamount of money received from parents monthly can affect students' online shoppingdecisions.
c. What do experts think about your research issues? Provide background information on theresearch topic with in-text reliable references. (Word limit: 250 words). State your fullreferences in the reference list at the end of the report (this is not part of the word limit).
Reference :(1),(2),(3)
Experts often have different views on the issue of spending per month for students:
- Some experts recommend that students create a monthly budget and stick to it.Budgeting helps students track and control their spending, increasing their financialmanagement ability.
</div><span class="text_page_counter">Trang 4</span><div class="page_container" data-page="4">living expenses, tuition, rent, and food. The impact of these expenditures needs to becarefully considered.
- At the same time, experts also often recommend that students have a frugal and strictattitude towards unnecessary money, such as entertainment money, unnecessaryshopping, or eating out at restaurants too often.
- If possible, students should look for ways to save money such as finding sharedaccommodation options, using old textbooks or buying discounted books, and takingadvantage of student incentives that the school or agency may offer. provide.
⇒ However, each student has unique circumstances and financial goals, so spendingdecisions should be individualized based on personal financial situation and priorities.
d. Identify the two continuous variables (independent and dependent) between which youwould like to find the relationship. Explain why you are choosing these two variables. At thispoint, you must get approval from your lecturer on your chosen variables before proceedingfurther. If not, you might need to redo the whole assignment.
- The two continuous variables are:+ Amount of online shopping+ Amount received from parents
⇒ We chose these two variables because we want to calculate and conclude the relationshipbetween time spent using social networks and the spending patterns of current students. See ifspending so much time on social networks will have too much of an impact on the monthlyamount received from parents.
e. Identify the population in your research about which you'll be making inferences.
- Population: All students on the campus of FPT University Hanoi
</div><span class="text_page_counter">Trang 5</span><div class="page_container" data-page="5">- Samples in the article include:
+ Amount of online shopping+ Amount received from parents
- Sampling method: send random surveys to 52 different people.
- Summary of results: Through survey and calculation, we have the following results.
+ Representative of the Sample Data Description section (Amount of onlineshopping): We see that the lowest and highest amounts are 0 VND and 5million respectively, the standard deviation is 1,330,284.49 VND, and theaverage amount is 1,364,808 VND.
+ Use histograms: representation of finding the confidence interval (Amount ofonline shopping): We see that with 98% confidence, the population average of"Amount of online shopping" will range from 1,735,162.49 to 0.994. 454.49.g. Submit the designed questionnaire that you'll be using to collect the data if you use asurvey in your data-collecting step.
h. Identify the survey errors that might have occurred in your research while collecting data.
- Sampling Error: This occurs when the survey sample is not representative of thetarget population, leading to biased or ungeneralizable results.
</div><span class="text_page_counter">Trang 6</span><div class="page_container" data-page="6">or fail to respond to the survey, which may introduce bias if non-respondents differfrom respondents.
- Measurement Error: This error is related to problems with the survey questions orresponse options that lead to inaccurate or inconsistent responses. It can result fromambiguous wording, biased phrasing, or lack of clarity.
- Question Order Effect: The order in which questions are presented can influencerespondents' answers. Questions asked earlier may prime or influence responses tosubsequent questions, introducing bias.
- Response Bias: Respondents may actively or unconsciously provide responses that donot reflect their true opinions, due to factors such as social pressure, perceivedexpectations, or lack of motivation.
<b>Part II: Descriptive Statistics Results</b>
a,b,c. Present the demographic information. You are free in the choice of graphs. Themaximum number of graphs should be three.
<b>●Amount of online shopping</b>
</div><span class="text_page_counter">Trang 7</span><div class="page_container" data-page="7"><b>-According to the table we have Min = 0, Max = 5,000,000, Mean = 1,364,808, Q1=500,000, Q2 = 1,000,000, Q3 = 2,000,000, s = 1,330,284.49</b>
Mean =<small>𝑖=1</small> = 1.364.808
<small>𝑛∑ 𝑥</small><sub>𝑖</sub>
Median (Q2)<i>=</i> <sup>𝑛+1</sup><sub>2</sub> ranked value= <sup>52+1</sup><sub>2</sub> ranked value = 1.000.000
</div><span class="text_page_counter">Trang 8</span><div class="page_container" data-page="8">Standard deviation = <small>𝑖=1</small> = 1.330.284,49
<small>∑ (𝑥</small><sub>𝑖</sub><small>− 𝑥)𝑛−1</small>
<i><b>=</b>ranked value</i>= ranked value = 13<small>th</small> <i>=500.000</i>
</div><span class="text_page_counter">Trang 9</span><div class="page_container" data-page="9"><b>-According to the table we have Min = 0, Max = 10,000,000, Mean =2,773,076.92,Q1 =1,500,000, Q2 =3,125,000, Q3 =3,000,000, s = 1,976,044.31</b>
<b>-</b> Mean =<small>𝑖=1</small> = 2.773.076,92
<small>𝑛∑ 𝑥</small><sub>𝑖</sub>
Median (Q2)<i>=</i> <sup>𝑛+1</sup><sub>2</sub> ranked value= <sup>52+1</sup><sub>2</sub> ranked value = 3.000.000
Standard deviation = <small>𝑖=1</small> = 1.976.044,31
<small>𝑛∑ (𝑥</small><sub>𝑖</sub><small>− 𝑥)</small><sup>2</sup>
<i><b>=</b>ranked value</i>= ranked value = 13<small>th</small><i>value =1.500.000</i>
<i><b>=</b>ranked value</i>= ranked value = 40<small>th</small>value =3.000.000
⇒ Amount received from parents: Min = 0, Max = 10,000,000, Mean=2,773,076.92, Q1=1,500,000, Q2 =3,125,000, Q3 =3,000,000, s=1,976,044, thirty first
</div><span class="text_page_counter">Trang 10</span><div class="page_container" data-page="10"><b>PART B: Inferential Statistics (5%)</b>
- Furthermore, the purpose of research is also to grasp the knowledge learned and applyit in practice, making seemingly dry knowledge more effective and beneficial.
c. Summary of your descriptive statistics :
<b>●Description of sample data</b>
- Online shopping amount: Min = 0, Max = 5,000,000, Mean = 1,364,808, Q1 =500,000, Q2 = 1,000,000, Q3 = 2,000,000, s = 1,330,284.49
- Amount received from parents: Min = 0, Max = 10,000,000, Mean=2,773,076.92, Q1=1,500,000, Q2 =3,125,000, Q3 =3,000,000, s=1,976,044, thirty first
<b>●Find the confidence interval</b>
- With 98% confidence, the population mean of "chi tiêu vào TMĐT" will bebetween 1807870.2845 to 921745.7155
</div><span class="text_page_counter">Trang 11</span><div class="page_container" data-page="11">● <b>Linear regression: There is a linear relationship</b>
d. The two variables:
- The two continuous variables are:+ Amount of online shopping+ Amount received from parents
⇒ We choose these two variables because we want to calculate and conclude the relationshipbetween time spent using social networks and spending patterns of current students. See ifspending so much time on social networks will have too much of an impact on the monthlyamount received from parents.
<b>Part II:</b>
<b>1. Confidence interval:</b>
<b>a. Amount of online shopping</b>
Spending on e-commerce
</div><span class="text_page_counter">Trang 12</span><div class="page_container" data-page="12">- Have: Mean = 1364808, sample standard deviation = 1330284.49, n=52, problemformat for calculating CI for the mean with unknownσ
</div><span class="text_page_counter">Trang 13</span><div class="page_container" data-page="13">1807870.2845 to 921745.7155
<b>b. Amount received from parents:</b>
The amount of money provided by parents
</div><span class="text_page_counter">Trang 15</span><div class="page_container" data-page="15">- t_critical value =tα; 𝑑𝑓 = 𝑡0. 02; 51 = -2.108- We have the formula:
=1. 364. 808 -1.000.000/1. 330. 284, 49/ 52 = 1.978- Conclude:t_STAT =1.978, t_critical value =-2.108
Because Tstart is closer to zero than t critical, H0 cannot be rejected.
=> There is no evidence that the population's average "online shopping amount" is
</div><span class="text_page_counter">Trang 16</span><div class="page_container" data-page="16"><b>3. Linear regression:</b>
<b>a. State two variables X and Y</b>
● X=Money given by parents● Y=Spending on e-commerce
<b>b. Sample data needed for calculation (Calculate with Excel)</b>
- From the data when analyzing the data, we can calculate the values of the regressionequation. The group formulas used and calculated in Excel yield the following results:
<b>c. Calculate by hand (general calculation)</b>
- Formulas used to calculate the data. The formulas stretch throughout thecourse of the MAS202 subject :
</div><span class="text_page_counter">Trang 18</span><div class="page_container" data-page="18">between "amount of money spent on online shopping" and "amount of moneyprovided by parents" there is a linear correlation between the two variables.
+ The data points stretch around a straight line, and between "amount of onlineshopping" and "amount of parent support" there is a strong correlationbetween the two variables.
⇒ From here, it can be seen that there is a linear relationship between "amount of moneyspent on online shopping" and "amount of money provided by parents".
<b>f. Test for slope coefficient</b>
⇒ Conclusion: There is a linear relationship between two variables X and Y. That is,Reject H0
<b>C. Reference:</b>
(1) : dantri.com. Information."Fallen" with the current level of student shoppingspending. Available :
class="text_page_counter">Trang 19</span><div class="page_container" data-page="19">
(3) : laodong.vn. Information.How much do students spend each month?
Available: