ECONOMIC GROWTH CONSTRAINTS IN VIETNAM: A STUDY USING THE GROWTH DIAGNOSTIC APPROACH
Bạn đang xem bản rút gọn của tài liệu. Xem và tải ngay bản đầy đủ của tài liệu tại đây (1.48 MB, 19 trang )
<span class="text_page_counter">Trang 1</span><div class="page_container" data-page="1">
<i><b>Review paper</b></i>
UDC: 338.12.017(597)doi: 10.5937/ekonhor1601033T
It is well known that economic growth is an important factor determining socio-economic development in developing countries. It is often considered as a prerequisite for improvements in equality, education and the living environment. Thus, achieving high economic growth and maintaining sustainability is the ultimate goal for all policies in developing countries. Why a nation does not obtain as high economic growth as others, or more generally, what are the underlying factors causing diverse economic growth rates among countries, is a question that has great importance in
practice. Unfortunately, defining growth constraints is not a simple task and requires complicated academic techniques with various approaches.
The neo-classical viewpoint of the free market has laid a foundation for the policy thought for recent decades. For example, J. Williamson (1990) summarized the policy standpoint of international institutions such as the IMF and the World Bank in ten pillars. These ten neo-classical pillars were then popularly called the Washington Consensus, which had been adopted as the principles for reforming the policy manifestos for developing countries and gained success to some extent. However, the Washington Consensus soon revealed severe shortcomings. For example, the implementation of the policies and programs based on the Washington Consensus did not succeed as expected in Sub-Saharan Africa’s countries (Rodrik,
<b>ECONOMIC GROWTH CONSTRAINTS IN VIETNAM: A STUDY USING THE GROWTH DIAGNOSTIC APPROACH</b>
Nguyen Duc Thanh and Pham Van Dai*
<i>Vietnam Institute for Economic and Policy Research, Hanoi, Vietnam</i>
Recent studies have clearly pointed out a decreasing trend of Vietnam’s economic growth in the short and the medium terms. This paper presents a study applying the growth diagnostic method for Vietnam to determine growth constrains. The binding growth constrains of Vietnam are found to include a poor business environment; an underdeveloped infrastructure, especially the transportation network market; failures related to information externalities, learning externalities and coordination failures. Notably, the energy infrastructure could be a vital constraint in a near future, but is not a binding constraint at present. The inefficiency of financial intermediaries and the government’s over-investment could become a binding constraint when the economy returns to its high growth path.
<b>Keywords: Vietnam, economic growth, growth diagnostic, growth policy</b>
JEL Classification: O40, O43,O11, O12
<i>* Correspondence to: Pham Van Dai, Vietnam Institute for </i>
Economic and Policy Research, R.707, E4 Building, 144 Xuan Thuy, Cau Giay, Hanoi, Vietnam; e- mail:
</div><span class="text_page_counter">Trang 2</span><div class="page_container" data-page="2">2006). According to the focal critique, this method tends to apply the same general principles to all countries without a priority in the action list and with the eyes closed to side effects (Stiglitz, 2003).
Based on the medical concept of diagnostics, R. Hausmann, D. Rodrik and A. Velasco (2005) proposed a new approach to design an appropriate reforming policy in developing countries. The method, popularly called growth diagnostics, aims at identifying growth constraints of an economy by looking at explicit signals. Subsequently, it recommends an economic reforming program focusing on addressing growth constraints by an order of priority.
<i>Since Hausmann et al (2005), the growth diagnostics </i>
approach has emerged as a popular framework widely applied in the growth policy studies in developing countries. The World Bank carried out a pilot study applying the growth diagnostics method for 12 economies (including three economies in Asia: Bangladesh, Cambodia and Thailand) in 2005. After that, the Asian Development Bank applied the growth diagnostics to examine economic growth in the Philippines in 2007 and in Indonesia three years later. Recently, the diagnostics approach has been increasingly popular in developing countries and is recognized as an effective tool for macroeconomic and growth analysis. An advantage of the growth diagnostics approach is that it provides a clear road map for analyzing a developing economy based on its own characteristics. Thus, a growth diagnostics study can make use of various data sources from different fields, which are often ignored by the traditional econometric approach.
This paper presents a growth diagnostics study for Viet Nam. Although the growth diagnostics method is widely used throughout the world and has also been applied in the neighboring countries, as far as we know, it has not been applied to Viet Nam and this study should be the very first one. The diagnostics method should be expanded and developed in further researches, not only within the scope of economic growth, but also in other fields, such as poverty reduction, climate change prevention and the educational reform.
The remainder of this paper consists of three sections. Section 2 introduces the growth diagnostics
methodology used in this study. Section 3 applies the methodology in the context of Viet Nam. Section 4 provides the concluding remarks.
GROWTH DIAGNOSTIC FRAMEWORK
<b>The Hausmann-Rodrik-Velasco model</b>
The essential idea underlying the growth diagnostics approach is that there are different constraints, beside common weaknesses such as a poor infrastructure, the low-skilled labor and poor resources, affecting economic growth in a particular economy. Therefore, a well-designed policy should focus on a certain set of constraints instead of trying to solve all the problems simultaneously by limited resources (Hausmann, Klinger & Wagner, 2008).
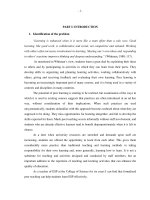
<i>R. Hausmann et al (2005) (hereafter referred to as HRV) </i>
developed a decision tree model to examine growth constraints in a developing economy (Figure 1). In the HRV decision tree model, private investment is deemed to be the single source of economic growth. Despite that, higher social investment does not always result in economic growth, especially when there is a decrease in the efficiency of investment, private investment indeed reflects the efficiency in using resources. Weaknesses such as a disrespect of private property rights, macroeconomic instability, a weak infrastructure and corruption, making an economy distorted and inefficient, could curb private investment as well. In fact, the productivity of an economy is indirectly reflected in the left branch of the HRV decision tree. Since the yield of investment determines the level of private investment, an improvement in productivity could promote private investment. In view of that, the HRV decision tree model essentially considers productivity as a key factor in economic growth.
While the left side of the HRV decision tree includes the determinants of demand for private investment, the right-hand side consists of the factors related to capital supply. The HRV model focuses on the elements of the financial market to explain why the private sector does not achieve the optimal level of investment.
</div><span class="text_page_counter">Trang 3</span><div class="page_container" data-page="3">The first step in a diagnostics growth study is to remove unnecessary constraints from the bottom of the decision tree. However, the removal process might mislead people in accepting inaccurate constraints due
<i>to a lack of data. R. Hausmann et al (2008) proposed the </i>
principles to determine growth constraints using the HRV decision tree.
<b>Diagnostic principles</b>
<i>R. Hausmann et al (2008) offers four fundamental </i>
principles for diagnosing growth constraints of an economy:
First, the shadow price of a growth constraint should
<i>be relatively high. As analyzed by R. Hausmann et al </i>
(2005), the shadow price can represent the tightness of a constraint. The shadow price is defined as a change in the objective function generated by a one-unit increase in the input. Therefore, a higher shadow
price is an indicator of the extent to which removing a constraint influences economic growth. In reality, the shadow price cannot often be directly observed, and is likely to be represented by the market price signals or the gaps between supply and demand.
Secondly, a shift in a constraint should result in a large shift in the objective function (which is private investment in this case). For example, if capital supply is a binding constraint, then an increase in capital accessibility should lead to a significant decrease in the interest rate and a large increase in private investment. Third, there should be pieces of evidence that economic entities attempt to overcome a binding constraint by themselves. This argument is based on the assumption about the rational expectation of the private sector. Economic entities in the private sector are assumed to be fully aware of the constraints hindering them and to actively respond in different ways.
<b>Figure 1 The growth diagnostic tree</b>
<i>Source: Hausmann, Rodrik & Velasco, 2005</i>
</div><span class="text_page_counter">Trang 4</span><div class="page_container" data-page="4">Fourth, economic entities which have advantages in terms of a binding constraint end up with thriving and overwhelming their competitors. This principle can be applied in two ways. An analyst may determine which sectors of an economy are performing well or are in trouble, and then seek for constraints with respect to which the well-performing sectors are less intense than their counterparts are. Alternately, he/she can begin with a constraint list and identify the sectors in which
this constraint is less intense. Finally, the performance of these sectors is compared to their counterparts to determine the tightness of the constraint.
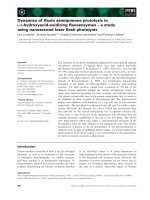
<i>R. Hausmann et al (2008) summarized the diagnostics </i>
testing list in a testing matrix (hereafter referred to as the HKW) (Table 1). In particular, the columns represent the constraints, and the rows describe the phenomena. However, it is noted that the set of the
<b>Table 1 The HKW testing matrix</b>
<b>Binding FinanceBinding social returns</b>
Low average
savings <sup>Bad finance</sup> <sup>A lack of complementary </sup>factors <sup>Low appropriability</sup> <sup>Coordination </sup>problemHuman capital The
infrastructure and public goods
Low discoveryEx ante risks Tax Low property
self-rights, crime, corruptionA high lending interest rate A low lending interest rate
A low net cash flow from banks A high net cash flow from banksInvestment elastic to the
interest rate <sup>A lack of an investment response to the interest rate change</sup>Access to external finance A low
infrastructure wrt
comparable countries
High static markups and low entry, in industries with entry costs
Monopoly power, high markups, a regulated entry
Expropriation Low
sophistication and few new industriesShort loan duration, credit
rationing <sup>Inward </sup>migration of high skills
Shocks to the infrastructure (a hurricane, a war)
Political risk,
social risk <sup>Social unrest Growth </sup>responds to new industriesA high deposit
interest rate <sup>A high spread High returns to </sup>education <sup>Tax policy risk High taxes, top </sup>marginal tax rate, corporate tax, VAT
Open conflict Few products „nearby” to move (open forest low)A negative
relation between growth and the current account
If risk is high ,
profits are low <sup>Pro-cyclical </sup>Mincerian returns
Growth elastic to the infrastructure change
Labor market
risks <sup>Restrictive </sup>labor regulations
Corruption (an illegal tax rate)Monopoly
powers: a high P/E ratio of banks
Returns decrease as education grows
High losses in
transport (ICA) <sup>A high </sup>expectation of losing future profits
The cost of doing business High returns to coordination activities
<i>Source: Hausmann et al, 2008 </i>
</div><span class="text_page_counter">Trang 5</span><div class="page_container" data-page="5">rows and the columns can be flexible. Other tests may be added to or removed from the diagnostics-testing matrix. Some tests in the matrix help us choose between the branches of the decision tree, whereas others simply check the accuracy of hypotheses.
GROWTH DIAGNOSTIC IN VIETNAM
<b>Economic growth in Vietnam: Spotlights</b>
A number of studies have shown a decreasing trend of economic growth, and short- and medium-term challenges recently arising in Vietnam’s economy (Dai & Thanh, 2012; Ohno & Thanh, 2015; Son & Chuong, 2011; Tho, 2013). N. N. Son and P. H. Chuong (2011) concluded that although Viet Nam had achieved a relatively high rate of growth over the period 2001-2010, compared to other neighboring countries and the world economy, the economic growth had largely attributed to the accumulation of the input factors. The low quality of economic growth is reflected in the low efficiency in using resources, the unstable structure of economic growth, and the low national competitive capability.
T. Tho (2013) suggested that Thailand and Malaysia had fallen into the middle-income trap because they had failed to raise their international competitiveness when approaching the upper middle-income level. Vietnam, meanwhile, might have fallen into the trap when it just reached the lower middle-income level. According to T. Tho (2013), the risks facing Vietnam include failures in developing the market factors and reforming the state enterprise, the poor quality of the policy formulation and overwhelming competition from China. H. Ohno and L. H. Thanh (2015) had a similar viewpoint and pointed out the four challenges of Viet Nam’s economy: slowing growth, asset bubbles, the exchange rate overvaluation and low competitiveness.
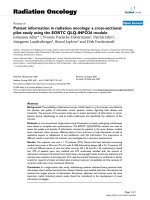
P. V. Dai and N. D. Thanh (2012) showed a downward trend in the productivity growth of Viet Nam’s economy. More importantly, the trend shows a tendency to speed up and goes against the common trend of the neighboring countries. They also pointed
out that, without substantial economic reforms, the average growth rate could stand merely around 4.8-6.2%/year over the period 2012-2015, indeed is far below the previous periods (Figure 2) (Figure 3).
<b>Financial constraints</b>
<i><b>The importance of financial constraints</b></i>
This growth diagnostics analysis follows the HRV decision tree model and goes from the top line. The capital shortage is a common issue in developing countries. According to the HKW testing matrix, the most obvious symptom of the capital shortage is a high interest rate. It can be observed that Vietnam and Indonesia have the highest lending interest rates in the developing East Asian region (Figure 4). Especially over the period from 2010 up to now, the nominal lending interest rate has continued to increase in Vietnam, which goes against the overall trend in the region. Nevertheless, after taking into account the inflation factor adjustment, the real interest rate in Vietnam is not very high, compared to the neighboring countries (Figure 5). Thus, it reveals that inflation is the main factor leading to the high lending interest rate in Vietnam.
<b>Figure 2 The average economic growth rate, </b>
1985-2012 (%)
<i>Source: The General Statistics Office of Vietnam and the World </i>
Bank Database
</div><span class="text_page_counter">Trang 6</span><div class="page_container" data-page="6">Moreover, recent studies have observed a remarkable improvement in the cash flow of Vietnamese commercial banks in recent years. Specifically, the commercial banks had been faced with serious
liquidity threats until the end of 2011. Inflation was then brought under control by the government’s package of tightening policies. Liquidity turned into a surplus, which can be evident by a decline in the interbank interest rate. Therefore, it concludes that the growth constraint might have shifted from the capital supply to the demand side.
The third test in the HKW matrix aims to determine the elasticity of the private investment level to the interest rate. When private investment is highly elastic to the interest rate, the growth constraint is likely to be on the supply side. By contrast, if the constraint is on the demand side, a change in the interest rate has a minor influence on the level of investment. The situation of Viet Nam’s economy is that the credit growth rate remains low in spite of the low interest rate. This supports the conclusion about the shift of growth constraints toward investment demand.
Notably, although weaknesses belonging to the supply side are not currently a growth constraint as the economy is in its downturn, they are rather likely to become a binding growth constraint in the next recovery phases. This assumption is supported by the test on access to credit, terms of a loan, and the risk aversion of banks. Vietnamese enterprises are mostly Note: The disparity between the growth rates of a developing
country and the US is captured at the year when its per capita
<i>GDP as the percentage of the US per capita GDP is at the same </i>
ratio as the one of Vietnam in 2012
<b>Figure 3 The disparity between a country’s economic </b>
growth rate and the U.S.
<i>Source: Authors, based on: The World Bank Database</i>
<b>Figure 4 The nominal lending rate, 2005-2012 (%)</b>
<i>Source: The IMF Database</i>
</div><span class="text_page_counter">Trang 7</span><div class="page_container" data-page="7">micro- and small-scale firms, whose accessibility to the international capital market is very limited due to the information asymmetry problem and the transaction cost. Moreover, the short loan duration and the risk aversion of banks can be barriers in accessing credit. A survey of 11 commercial banks’ financial statements shows that short-term loans account for a dominant share of the total outstanding loans (Table 2). Finally, a downturn in the property market
substantially decreases the value of collateral, which largely influences the capital accessibility of domestic enterprises.
The capital supply constraint can attribute to some reasons, such as low savings, the government’s overinvestment, and the flaws of the domestic financial market. The next test in the HKW matrix is to assess the domestic savings rate and the performance of the domestic financial market.
<b>Figure 5 The real lending rate, 2005-2012</b>
<i>Source: The IMF Database</i>
<b>Table 2 The commercial banks’ credit portfolio, 2011-2013 (%)</b>
</div><span class="text_page_counter">Trang 8</span><div class="page_container" data-page="8"><i><b>The rate of the savings and public investment </b></i>
The domestic savings rate in Vietnam stands below the average of the region (Figure 6). Barring China, which used an exceptional proportion of the GDP for savings, which is up to 52% over the period 2008-2012, other countries maintained the ratios similar to Vietnam (29%), e.g. Indonesia (31%), Malaysia (35%), the Philippines (25%), and Thailand (30%).
It should be noted that, although Vietnam’s savings rate is moderately low, the total public investment stands at a high level compared to the other neighboring economies (Figure 7). This could be a reason explaining the shortage of capital for the private sector.
The shortage of capital is also reflected in the relationship between the current account and the GDP growth. In an economy in which investment demand exceeds domestic savings, economic growth is closely tied to signals in the exchange rate and foreign capital supply. Thus, high economic growth often accompanies a capital balance surplus and a trade deficit. The inverse relationship between economic growth and a trade balance has been evident in the course of the development in Vietnam since Doi Moi (Figure 8). The calculations show that the correlation
coefficient between the proportion of the trade surplus to the GDP and the growth rate of the GDP in the 1988-2012 period is 38.4%.
In sum, it is highlighted that, although the government’s overinvestment, along with low savings, is not a binding constraint at the moment, there is a likelihood that they will be major growth constraints when the economy returns to the path of high performance.
<i><b>Financial intermediaries</b></i>
Financial intermediaries play an important role in mobilizing and allocating capital. An inefficient financial system incurs a financing cost to investors and thereby ultimately reduces private investment. The most important component of financial intermediaries in Vietnam is the commercial banks, which account for over 95% deposit and the credit of the financial intermediary system (Thanh, 2011). For this reason, this section mainly focuses on the efficiency of the commercial banks.
The large gap between the lending and savings rates in Viet Nam shows the inefficiency of financial intermediation. At the beginning of 2014, the short-
<b>Figure 6 The domestic savings rate, 2000-2012 (%)</b>
<i>Source: The World Bank Database</i>
</div><span class="text_page_counter">Trang 9</span><div class="page_container" data-page="9">term lending rate was ranging from 10% to 11%, while the short-term deposit rate was around 6% (VID Group, 2014). The gap of 4-5% was among the highest in the region (Figure 9).
A large gap between the lending and savings rates often results from two sources; that banks do not
operate efficiently or that the structure of the banking industry enables banks to make a monopoly profit. In a study on Viet Nam’s banking sector, S. Delpachitra and P. V. Dai (2015) showed that the banking sector demonstrated the characteristics of monopolistic competition with a low concentration of the market compared to other economies. For example, the market shares in terms of the total assets held by the three largest commercial banks in Viet Nam was 35% at the end of 2011, compared to 46% in India, 44% in Indonesia, 54% in Malaysia, 49% in the Philippines, and 54% in Thailand.
<i>Moreover, R. Hausmann et al (2008) proposed that </i>
the price-earnings (P/E) ratio of banks can serve as a good indicator of monopoly. A high P/E ratio reflects the profitability of a bank and hence tends to be related to monopolistic advantages. According to the Viet Capital Securities (2014), the average P/E ratio of the listed commercial banks is 11.7, which is lower than that of the other industries such as retail (13.6), tourism and entertainment (26.7), insurance (18.0), etc. This demonstrates that the monopolistic power of the commercial bank is not high. Therefore, the constraint
<b>Figure 7 The ratio of public investment to the total </b>
social investment, 2008-2013 (%)
<i>Source: The General Statistics Office of Vietnam and the World </i>
Bank Database
<b>Figure 8 Economic growth and the trade deficit, 1988-2012</b>
<i>Source: The World Bank Database</i>
</div><span class="text_page_counter">Trang 10</span><div class="page_container" data-page="10">on the capital supply side largely concerned the operational inefficiency of the commercial banks.
<b>The profitability constraint</b>
Based on the symptoms reported above, including the low real interest rate, the excess liquidity in the commercial banks, and the inelastic demand of private investment, it is likely that the expected yield of private investment will be a binding constraint to economic growth. According to the HRV decision tree model, the yield of private investment is conditional on the social return rate and the appropriability of private investors.
<i>Society wealth: Social wealth is defined as the total </i>
benefit generated by an investment for the society as a whole. Since private investors capture a certain proportion of the total social benefit, a private investment yield largely depends on the social return rate.
According to the HRV matrix, the social return rate attributes to the two factors: human resources, and the infrastructure and other public goods, which are essential for the implementation of a private investment. A deficiency of those factors would have a negative effect on productivity and would decrease the social return of an investment. The social investment level, measured in terms of percentages of the GDP, is high in Vietnam, despite the fact that it is among the lowest income countries in the region (Figure 10).
<i>The labor force: Vietnam is facing redundancy in the </i>
labor force, especially the low-skilled labor. The fact is that Vietnam has never been under the pressure of a shortage of the labor force, not even in the period 1990-2009, when the economy grew at a remarkable annual rate of 2.1 percent. Conversely, in general, labor appears to be redundant, which can be reflected in the fact that around 70 percent of the labor force works in the rural area. In a study on the demographics in Vietnam, N. T. Minh (2009) found that the share of the labor force in the total population would continue to rise in the current period and reach the peak of 70 percent in 2018. Thus, it is clear that, in terms of quantity, human resources are not a binding growth constraint in Vietnam’s economy.
Although Vietnam’s economy is not as developed as the one of its neighboring countries, its labor force has the same level as other ASEAN countries do. The percentage of the labor force completing primary education or higher education accounted for 92 percent, which is even higher than in Indonesia (91 percent), Malaysia (90 percent), and Thailand (91 percent) and just lower than in the Philippines (97 percent). Notably, the proportion of the labor force completing secondary and higher education is lower than in the neighboring countries (Figure 11). However, the lack of the high-skilled labor is not a binding constraint at the current development stage of Vietnam’s economy.
Firstly, the immigration of highly skilled labor is unpopular and there are only a small number of highly qualified foreign employees working mostly in
<b>Figure 9 The interest rate gap</b>
<i>Source: The IMF Database</i>
</div>