principles of accounting topic financial ratios analysis of cholimex food joint stock company
Bạn đang xem bản rút gọn của tài liệu. Xem và tải ngay bản đầy đủ của tài liệu tại đây (3.23 MB, 29 trang )
<span class="text_page_counter">Trang 1</span><div class="page_container" data-page="1">
FPT UNIVERSITY ___÷ư___
<b>PRINCIPLES OF ACCOUNTING </b>
TOPIC:
<FINANCIAL RATIOS ANALYSIS OF
</div><span class="text_page_counter">Trang 2</span><div class="page_container" data-page="2"><b>EXECUTIVE SUMMARY </b>
Currently, the demand of a company's financial information are diverse, which requiring financial analysis to meet the needs of interested audiences. Analyzing financial ratios is an important part of assessing a business's performance, financial health, and forecasting its future financial position. Financial ratios allow us to compare different aspects of a company's financial statements with those of other businesses across the industry to see its dividend payout and debt serviceability. Analysis of financial indicators not only determines the existence and development of enterprises, but it also has a strong impact on the economy. From the above practice, the objective of this assignment is "Analysis of financial ratios of Cholimex Food Joint Stock Company". The research content is based on the financial statements of Cholimex Food Joint Stock Company for the last three years, 2019, 2020 and 2021.
</div><span class="text_page_counter">Trang 3</span><div class="page_container" data-page="3"><b>CONTENTS: </b>
A. INTRODUCTION...4
B. FINANCIAL RATIOS ANALYSIS ... 5
I. GROWTH RATE ... 5
1. An assets’s growth rate ... 5
2. Revenue’s growth rate... 6
3. Net profit’s growth rate ... 6,7 II. PROFITABILITY RATIOS ... 7
1. Gross profit margin ratio ... 7
2. Net profit margin ratio ... 9
3. Operating margin ratio ... 10
4. Return on assets ratio ... 11
5. Return on equity ratio... 12
III. LEVERAGE RATIOS ... 14
1. Debt ratio ... 14
2. Debt to equity ratio ... 15
3. Times interest earned ratio ... 16
IV. LIQUIDITY RATIOS ... 18
1. Current ratio...18
2. Acid-test ratio...19
V. TURNOVER RATIOS ... 21
1. Assest turnover ratio... 21
2. Inventory turnover ratio ... 22
3. Days’ sales in inventory ... 23
</div><span class="text_page_counter">Trang 4</span><div class="page_container" data-page="4">5. Days sales receivable ... 26
C. CONCLUSION...26
D. RECOMMENDATION...27
REFERENCE: ... 28
<b>LIST OF FIGURE: </b>Figure 1 . An assets's growth rate--- 5
Figure 2 . Revenue’s growth rate --- 6
Figure 3 . Net profit’s growth rate --- 7
Figure 4 . Gross profit margin ratio --- 8
Figure 5 . Net profit margin ratio --- 9
Figure 6 . Operating margin ratio --- 10
Figure 7 . Return on assets --- 12
Figure 8 . Return on equity --- 13
Figure 9 . Debt ratio --- 15
Figure 10 . Debt to equity ratio--- 16
Figure 11 . Times interest earned ratio --- 17
Figure 12 . Current ratio --- 19
Figure 13 . Acid-test ratio --- 20
Figure 14 . Assets turnover ratio --- 22
Figure 15 . Inventory turnover ratio--- 23
Figure 16 . Days' sales in inventory --- 24
Figure 17 . Receivables turnover ratio --- 25
Figure 18 . Days sales receivable --- 26
</div><span class="text_page_counter">Trang 5</span><div class="page_container" data-page="5"><b>A. INTRODUCTION </b>
Cholimex Food Joint Stock Company, also known as Cholimex Food JSC, was established in 1983 with initial charter capital of eighty -one billion VND. The company's head office is at Street 7, Vinh Loc Industrial Park, Vinh Loc A Commune, Binh Chanh District, Ho Chi Minh City, Vietnam. In the process of formation and development, most notably in 2018 the company's revenue reached 1,954 billion VND, equal to 2,412% of the initial charter capital and profit after tax reached 100 billion VND. Cholimexfood has become one of the leading enterprises in Vietnam in the condiments-sauce and frozen food industry in recent years.
The general objective of this assignment is to analyze the financial position of Cholimex Food Joint Stock Company through the analysis of financial ratios for the period 2018-2021. From the above analysis, find out the potentials, business performance as well as financial risks of Cholimex Food. From there, there are correct and appropriate solutions and recommendations for the Company to improv e its operational situation and estimate its financial situation in the future. In this assignment, I use the method of comparing financial statements for the last three years, 2019, 2020 and 2021 of Cholimex Food Joint Stock Company, including: Balance Sheet, Income Statement. This method can analyze and evaluate changes in the company's operations, asset structure, capital sources, and grasp financial trends in the future. In addition, I also use the chart method to reflect financial data, describe trends, and volatility of financial indicators.
</div><span class="text_page_counter">Trang 6</span><div class="page_container" data-page="6"><b>B. FINANCIAL RATIOS ANALYSIS </b>
<b>I. GROWTH RATE </b>
<b>1. An assets’s growth rate </b>
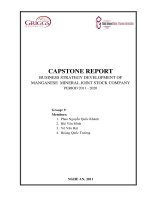
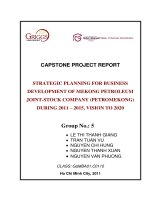
Asset growth rate is the change in assets of the current year compared to the previou s year as a percentage. Asset growth rates can gauge a company's performance and predict future performance. The formula is:
An assets's growth rate = ( Ending assets - Beginning assets ) / Beginning assets
(Source: Annual Finance report - Cholimex Food, 2022) (Source: CMF: CTCP Cholimex Food - CHOLIMEX FOOD JSC - Financial | VietstockFinance, 2022)
Figure 1. An assets's growth rate
The growth rate of assets of Cholimex Food Joint Stock Company in the period of 2018 - 2021 is shown in Figure 1. During this period, the total assets of the Company increased steadily but without a large difference. In 2018, the asset growth rate increased insignificantly, but from 2019 to 2021 this rate has decreased by more than
<small>2018201920202021Begining assets</small>
<small>(Millions of VND)</small> <sup>628299.49</sup> <sup>735746.98</sup> <sup>864707.49</sup> <sup>1011344.68</sup><small>Ending assets</small>
<small>(Millions of VND)</small> <sup>735746.98</sup> <sup>864707.49</sup> <sup>1011344.68</sup> <sup>1161803.75</sup><small>An asset's growth rate</small>
<small>(%)</small> <sup>17.10</sup> <sup>17.53</sup> <sup>16.96</sup> <sup>14.88</sup><small>13.5014.5015.5016.5017.5018.00</small>
AN ASSETS’S GROWTH RATE
</div><span class="text_page_counter">Trang 7</span><div class="page_container" data-page="7">asset value is also depreciated.
<b>2. Revenue’s growth rate </b>
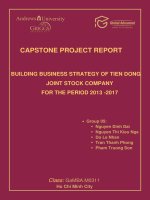
Revenue growth refers to the increase in a company's sales between periods, years, expressed as a percentage. This ratio shows how much a company has increased its revenue over a period compared to the previous period. The formula is:
Revenue’s growth rate = ( Ending revenue - Beginning revenue ) / Beginning revenue
(Source: Annual Finance report - Cholimex Food, 2022) (Source: CMF: CTCP Cholimex Food - CHOLIMEX FOOD JSC - Financial | VietstockFinance, 2022)
Figure 2. Revenue’s growth rate
Figure 2 shows that the revenue growth rate of Cholimex Food in the period of 2018-2019 decreased sharply and was not uniform. Although revenue increased steadily over the years, the revenue growth rate decreased sharply by more than 17% in the period 2018-2020, by 2021 this rate will be improved but still lower than the first year. Cholimex Food needs methods and strategies to increase sales by selling more goods, creating effective marketing strategies, etc.
<b>3. Net profit’s growth rate </b>
<small>2018201920202021Begining revenue</small>
<small>(Millions of VND)</small> <sup>1603728.29</sup> <sup>1953349.11</sup> <sup>2175757.83</sup> <sup>2263329.47</sup><small>Ending revenue</small>
<small>(Millions of VND)</small> <sup>1953349.11</sup> <sup>2175757.83</sup> <sup>2263329.47</sup> <sup>2508601.06</sup><small>Revenue's growth rate</small>
<small>(%)</small> <sup>21.80</sup> <sup>11.39</sup> <sup>4.02</sup> <sup>10.84</sup><small>0.005.0010.0015.0020.0025.00</small>
REVENUE’S GROWTH RATE
</div><span class="text_page_counter">Trang 8</span><div class="page_container" data-page="8">other words this ratio is an indicator of the true profitability of a business. It compares profit growth over periods or years, to gauge the company's business performance. The formula is calculated as follows:
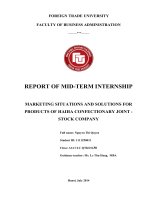
Net profit’s growth rate = ( Ending net profit - Beginning net profit ) / Beginning net profit
(Source: Annual Finance report - Cholimex Food, 2022) (Source: CMF: CTCP Cholimex Food - CHOLIMEX FOOD JSC - Financial | VietstockFinance, 2022)
Figure 3. Net profit’s growth rate
The growth rate of net profit of Cholimex Food JSC in the period 2018 -2021 decreased sharply, as shown in Figure 3. Profit after tax of the enterprise increased steadily over the years, but the growth rate decreased sharply by about 70% net profit. It can be seen that the profit earned from sales has decreased a lot compared to the first years, which may be due to the decrease in product sales, high tax costs, unoptimized cost of goods sold.
<b>II. PROFITABILITY RATIOS </b>
<small>2018201920202021Beginning net profit</small>
<small>(Millions of VND)</small> <sup>56858.99</sup> <sup>100002.63</sup> <sup>166596.48</sup> <sup>178626.33</sup><small>Ending net profit</small>
<small>(Millions of VND)</small> <sup>100002.63</sup> <sup>166596.48</sup> <sup>178626.33</sup> <sup>185987.37</sup><small>Net profit’s growth rate </small>
<small>(%)</small> <sup>75.88</sup> <sup>66.59</sup> <sup>7.22</sup> <sup>4.12</sup><small>0.0010.0020.0030.0040.0050.0060.0070.0080.00</small>
NET PROFIT’S GROWTH RATE
</div><span class="text_page_counter">Trang 9</span><div class="page_container" data-page="9"><b>1. Gross profit margin ratio </b>
Gross profit margin ratio, also known as gr oss margin ratio, is an important indicator of the profitability of a business. This indicator is calculated a s a percentage and shows how much gross profit the business generates for each dollar of revenue generated. The formula is:
Gross profit margin ratio = Gross profit / Total revenue
In which, gross profit is the differ ence between revenue a nd cost of goods sold. It is calculated by the formula:
Gross profit = Total revenue - Cost of goods sold
(Source: Annual Finance report - Cholimex Food, 2022) (Source: CMF: CTCP Cholimex Food - CHOLIMEX FOOD JSC - Financial | VietstockFinance, 2022)
Figure 4. Gross profit margin ratio
Figure 4 shows that the gross profit margin of Cholimex Food decreased steadily in the period of 2019-2021, which shows that the production efficiency of the business is
<small>201920202021Gross profit</small>
<small>(Millions of VND)</small> <sup>629510.08</sup> <sup>648134.66</sup> <sup>673792.66</sup><small>Total revenue</small>
<small>(Millions of VND)</small> <sup>2175757.83</sup> <sup>2263329.47</sup> <sup>2508601.06</sup><small>Gross profit margin ratio</small>
<small>(%)</small> <sup>28.93</sup> <sup>28.64</sup> <sup>26.86</sup>
<small> 25.00 26.00 27.00 28.00 29.00 30.00</small>
GROSS PROFIT MARGIN RATIO
</div><span class="text_page_counter">Trang 10</span><div class="page_container" data-page="10">did not optimize Cost of goods sold. It means that the advantage and competitiveness of Cholimex Food is declining.
<b>2. Net profit margin ratio </b>
Net profit margin measures how much net income is generated relative to the revenue received, expressed as a percentage. This metric helps investors gauge the performance of a business that it is generating enough profit from sales. In other words, net profit margin helps to reflect the financial health of the business that how much profit after tax for a dollar of sales. The formula is calculated as follows:
Net profit margin = Net profit Total revenue ⁄
(Source: Annual Finance report - Cholimex Food, 2022) (Source: CMF: CTCP Cholimex Food - CHOLIMEX FOOD JSC - Financial | VietstockFinance, 2022)
Figure 5. Net profit margin ratio
Figure 5 shows that Cholimex Food's net profit increased steadily in the period of 2019-2021, however, its net profit margin decreased slightly but unevenly. That shows
<small>201920202021Net profit</small>
<small>(Millions of VND)</small> <sup>166596.48</sup> <sup>178626.33</sup> <sup>185987.37</sup><small>Total revenue</small>
<small>(Millions of VND)</small> <sup>2175757.83</sup> <sup>2263329.47</sup> <sup>2508601.06</sup><small>Net profit margin ratio</small>
<small>(%)</small> <sup>7.66</sup> <sup>7.89</sup> <sup>7.41</sup><small>7.107.307.407.607.808.00</small>
NET PROFIT MARGIN RATIO
</div><span class="text_page_counter">Trang 11</span><div class="page_container" data-page="11">high profit and lower risk than the other two years. Cholimex Food needs to review the cost of raw materials, production lines, transportation, distribution, and must find ways to optimize profit margins by increasing revenue through selling more goods to reduce business risks and improve net margin profit ratio.
<b>3. Operating margin ratio </b>
Operating margin is another measure of a company's profitability, measured in percentages. Profit from operating business after all operating expenses are subtracted from sales receipts or revenue above total revenue incurred. In which, operating profit margin calculates business operating expenses such as selling expenses, administrative expenses, etc. The formula is:
Operating margin ratio = Operating income / Total revenue
(Source: Annual Finance report - Cholimex Food, 2022) (Source: CMF: CTCP Cholimex Food - CHOLIMEX FOOD JSC - Financial | VietstockFinance, 2022)
Figure 6. Operating margin ratio
<small>201920202021Operating income</small>
<small>(Millions of VND)</small> <sup>208951.82</sup> <sup>219817.26</sup> <sup>228637.65</sup><small>Total revenue</small>
<small>(Millions of VND)</small> <sup>2175757.83</sup> <sup>2263329.47</sup> <sup>2508601.06</sup><small>Operating margin ratio</small>
<small>(%)</small> <sup>9.60</sup> <sup>9.71</sup> <sup>9.11</sup><small>8.809.009.209.409.609.80</small>
OPERATING MARGIN RATIO
</div><span class="text_page_counter">Trang 12</span><div class="page_container" data-page="12">2019-2021 tends to decrease steadily.This is a bad signal for the company, which can be caused by the ineffective control of operating costs or other factors affectin g revenue generation such as selling expenses, increased administrative expenses or customer demand for the product decreased.
<b>4. Return on assets ratio </b>
Return on assets, also known as ROA, is the ratio of net r eturn on total assets, expressed as a percentage. Its represent the ratio of net profit after tax to the average value of assets of the business. The manager can evaluate with 1 VND o f initial investment, how much profit the company can generate after tax as well as they can evaluate the efficiency of u sing a ssets of the business. The formula is calculated as follows:
Return on assets = Net income / Average assets
In which, the average asset value is calculated by:
Average assets = ( Beginning assets + Ending assests ) / 2
</div><span class="text_page_counter">Trang 13</span><div class="page_container" data-page="13">(Source: Annual Finance report - Cholimex Food, 2022) (Source: CMF: CTCP Cholimex Food - CHOLIMEX FOOD JSC - Financial | VietstockFinance, 2022)
Figure 7. Return on assets
Figure 7 shows that Cholimex Food's ROA decreased steadily during the period of 2019-2021. This shows that the efficiency level of asset exploitation of this enterprise is declining. Although the profit earned and the value of assets have increased steadily over the years. However, CMF's Return on assets index has decreased over the years but is still at a good level compared to other companies in the food industry.
<b>5. Return on equity ratio </b>
Return on equity, or ROE, is the rate of profit on equity, expressed as a percentage. This is a measure of how much profit each dollar spent. This index shows the effectiveness of investors' investments in the company and its ability to compete with its competitors in the same industry.
The formula is:
<small>201920202021Net income</small>
<small>(Millions of VND)</small> <sup>166596.48</sup> <sup>178626.33</sup> <sup>185987.37</sup><small>Average assets</small>
<small>(Millions of VND)</small> <sup>800227.24</sup> <sup>938026.09</sup> <sup>1086574.22</sup><small>Return on assets</small>
<small>(%)</small> <sup>20.82</sup> <sup>19.04</sup> <sup>17.12</sup>
RETURN ON ASSETS
</div><span class="text_page_counter">Trang 14</span><div class="page_container" data-page="14">OR:
Return on equity = Net profit margin * Asset turnover * Equity multiplier
In which, Equity multiplier is calculated by:
Equity multiplier = Average total assets / Average shareholders’ equity
(Source: Annual Finance report - Cholimex Food, 2022) (Source: CMF: CTCP Cholimex Food - CHOLIMEX FOOD JSC - Financial | VietstockFinance, 2022)
Figure 8. Return on equity
Figure 8 shows that the Return on Equity of Cholimex Food Joint Stock Company decreased steadily over the years from 2019-2021. Shows that the company's ability to use capital decreases, net profit and asset turnover decrease many times, financial leverage between assets and equity also decreases. It can be seen that the company's bad decision making affects the reinvestment of capital into assets. However, this ratio is still higher than the average ROE of the Food industry, in 2021 the ROE of
<small>201920202021Equity multiplier</small>
<small>(Times)</small> <sup>2.03</sup> <sup>1.89</sup> <sup>1.79</sup><small>Assets turnover ratio</small>
<small>(Times)</small> <sup>2.72</sup> <sup>2.41</sup> <sup>2.31</sup><small>Net profit margin ratio</small>
<small>(%)</small> <sup>7.66</sup> <sup>7.89</sup> <sup>7.41</sup><small>Return on equity</small>
<small>(%)</small> <sup>42.38</sup> <sup>35.89</sup> <sup>30.66</sup><small>01020304050</small>